💥 Still Holding My Short. (DJI)🥇 We are now testing predicted next major support levels from previous post below in related ideas.
First off. If your objective is to trade large timeframes like the 3 day then you need to be willing to absorb noise in a market. If you are going to trade a large timeframe you have to cut out your emotions and let it go. You will never become a successful swing trader if you can't do this. You look for your entry set your stoploss and move on to the next trade and continue to diversify your capital. You will NEVER capture every single exact bottom or every exact top. IT WILL NOT HAPPEN! It's going to take a lot of micro structures to form to create one overall massive trend. If you can't understand this and get caught up in emotions, trading probably isn't for you. I speak about a lot of the basic aspects of trading over and over again to help make my fellow traders understand regardless of what strategy you trade with, the core fundamentals play a bigger role than anything! Cut loss, use stop loss, let the timeframe play out, don't marry bad trades, don't dollar cost average on the way down, cut out emotions.
We have been short on the dow jones since 26,990 which is still roughly around 5% in profit. We had taken this trade based off the 3 hour timeframe as we scouted previous major structure to play. We lined up the Crossover strategy and the ema dots and went with it. We have now broken the green major support level and now are testing major key levels on previous horizontal green supports. You see that price has rebounded off those levels to try and test the upward green strong longterm old support. Remember support can become new Resistance. Let the trade play out. We are starting to get some green compression on the 3 hour candle looking for a crossover and ema dots to line up. My main focus is that we are under that longterm support. If it can hold than we could see a bigger selloff and start to roll this trade over into the larger timeframes for a longer hold, which I would prefer. I am not worried about it and will let it ride to see how it holds up on key s&r levels.
Have an awesome week! Look at some of the previous dji calls in the related ideas below. 👍
Dowjonesshort


MLT Called The Top! 6.9% Gain! 🥇 (DJI)👌 Well, Well, Well.... she seemed to of had a rough Thursday just as we expected it to have.
The main upward support level has been breached, which is not a good sign.
What we are looking for next to be test and try to hold is not not too far away.
25k-24.6k as I have it label as a key level of support.
We took this position on a 3 hour timeframe as the Crossover strategy and the ema dots shifted towards the red alignment.
We will look to see if we can get a reversal here or if it decides to just melt through the bottom. 🔥🔥🔥
Best of luck to you all! 🎲🎲🎲
🥇MLT | MAJOR LEAGUE TRADER

Trump Said It... The BIG "V" (DJI)🤔 Will the stock market drop or fly high... Let's take a look!
What is the big V pattern and what does it represent? I want you to focus on the structural support that we have drawn out connecting the 3 green arrows bottoms. This is a very key level of support that we want to take very seriously! We are all aware of the massive market selloff that we had in early 2020. We found a major level of support around 18.5k and then rebounded to run up towards 27.5k. The big v can also be considered a cup pattern which is a bullish pattern to show that the bulls are in control as we continue to print higher lows. But, let's keep in mind that patterns can change and do not always go according to the textbook of what It represents.
Next let's look where our most valuable piece of historical structural data was developed at. I have circled it in red. You can see that this was an area during the selloff where we had some relevant form or an impulse to try and push the market back up. We want to correlate that piece of information with where price sits at now. As of now we have attempted to breach above that structural top where Resistance was at that ended up crashing the market back down. Their is a saying where old support and old resistance can do the opposite and act as the opposite later down the road. Support and Resistance is a very critical thing to understand when trading any market!
This is a 3 hour chart as I am taking a more aggressive approach to play a short here at 26,990. We are getting early signs of a Crossover from red candles developing to Crossover the green line below. We want to see it travel towards 26,919 as that is the level of the historical top to see if it acts as new major support to push the market higher. If I wanted to long the dow jones I would look to play the breakout of 27,451. I will be applying a stoploss here of 1.72% on this short. Risk management is also a very important concept to understand when trading the market, probably the most important!
If we break 26,919 next we will want to look to travel towards the cups green arrow major support level to see how that holds. Look for a textbook Crossover strategy play there or hold if the candles stay red and push through it.
The next level on the way down would be the 2 green levels I've drawn out in the range of 25,000-24,600 to see if that old Resistance acts as new support.
As of now let's not get carried away and not hink too far ahead. Let's play the current range and walk with it.
I hope that I've helped you learn something today! 😁
If you would like to get training on how to trade the markets with our custom strategies and Indicators, then please consider checking out our website below!
We wish you the best and will stay updated on this one!
🥇MLT | MAJOR LEAGUE TRADER


Dow Jones: possible shorts (sell trade) upto 25000 key levelUS30, Dow Jones is to be expected for a possible short sell upto 25000 key level completing the wave before the next bullish or bearish move.

DOW Jones - C Wave Target Reached - Now Watch For This.Target Reached. See - Previous related ideas. - Let's look for the signs of a reversal.
Trading the Primary Reversal Level is riskier than trading Secondary Reversal Level so it depends on your risk appetite.
I will post another update when the Secondary Reversal Level is broken.
When trading a reversal level place the stop above the end of Wave C.
Good Luck!
Please LIKE and FOLLOW to get notification of updates and future posts.

DOW Jones - Tracking Minor Waves - C Wave Within Wave 2This minor wave update is part of my previous idea on the Dow Jones, see below.
This C wave is almost done we just need Wave 5 to complete and then see a sharp reversal.
A break of the end of Wave 4 (which is the E wave of Wave 4) will signify a reversal is in progress.
Wave 4: 24291 would be a good entry point or you can wait for a pullback.
Stop would be placed at the Wave 5 high which would be confirmed once this level is broken.
When executing this trade theoretically you will be trading start of the (A) wave of the coming D wave within Wave 2.
Please LIKE and FOLLOW to get notification of updates and future posts.

DJI Running on hopium of a new VaccineDouble top on the Dow, has failed thus far to reach the 61.8 retracement level in hopes of the market making a recovery, According to the wall street cheat sheet id say we are between the "Complacency and the Anxiety" stage, Its just a dead cat bounce IMO, Although some restrictions are slowly easing in some country's, the world is in turmoil, the recession as we know it we are only at the tip of the ice berg, Sell-offs that we have seen in March will make the next wave look like a hiccup, The Dow is running on hopes of a Corona Vaccine that will hopefully make the world into a better place again and things will go back to normal, The vaccine is still in testing stages which could make it 12+ months until its ready to go. This recession will make "The Great Depression" look like a speed-hump, Just wait until the Q2 data comes out, There will be millions more that have filled for unemployment. Oh no thats ok tho, The fed have the money printers working over time, = Inflation, watch global currencies die out
"We are in a recession and there is a global pandemic happening at the same time" The world is not going back to normal anytime soon.

DOW JONES - Say Good-Bye to the Good Times - Short at WillThe Dow Jones is about to embark on a journey down the rabbit hole.
No new high made because this is Wave 2.
All I can say is that its going to be a rough ride for many.
Hasta La Vista
Please LIKE and FOLLOW to get notification of updates and future posts.

#DJI.. SELL IN MAY AND RUN AWAY!.. I think that there will be a long-term correction wave in the global markets on a macro scale, and it is getting closer.. Markets will become very interesting in the coming years, we will wait and see..
For DJI, the structure I expressed in the chart is very important and should be watched carefully.. I firmly believe that, we will observe wedge pattern in the chart of many markets in the big correction wave..
What I wrote is about strong possibilities that most investors and analysts do not express or expect.. Please do your own due diligence when it comes to trading.. Invest at your own risk..
I wish you all the best..

SDOWI noticed a few things happening in the markets.
1. The DJIA has dropped from 29k all the way down to 18k in couple days.
2. SDOW has hit record lows while DJIA puts in lower Highs
3. VIX is still above 30 and has been above 60 during this crash.
The market is pumped up by all these stimulus packages the Don keeps creating, but is still struggling to get back above 25k, while the SDOW is priced as if the DJIA is above ATH's on the DJIA, mix this with the large div between the VIX & SDOW got me thinking when the market crashes (when I said) SDOW will need to play catch up, even if the crash is not as bad % wise as the most recent crash. I am looking for $24 to enter but may close all my longs and enter soon, depends on how the market reacts today. We could stay flat today then open on Monday for 1 last pump to 26-27k next week or we could just start crashing B4 this. So I am monitoring all this as we speak.


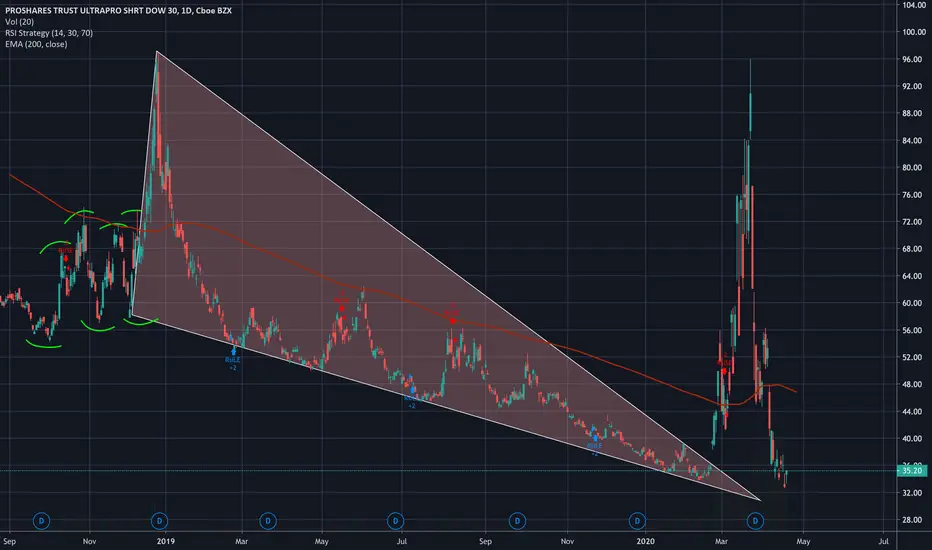
My Outlook On The DOW (DJI)Ascending wedge break to the right of long term upward support with highs being hit at 24150 key area of Resistance to test for an attempt at an upward breakout.
23000 is support area for the current range.
Weekly crossover for bullish shift and the ema dots are firing green.
But, keep in mind that we don't have a close on the weekly till may 4th.
Overall the weekly is in development and trying to recover from the crash.
We want to watch the open and see if it can push through 24150 with good volume pushing on the books.
Currently the one hour is green. If I get a Crossover on the 1 hr to the downside from rejection I'd than look for a 24000 break for a short to test 23000
If breaks to the upside your going to want to see it push towards the old wedge support and see if it rejects as new Resistance. That would be a good place to take profits.
We need to keep in mind that the monthly and the 3 month are overall bear pressure.
We now scout the weekly to try and find a good long term position to enter here, but it results in if we want to make higher highs or lower lows on the smaller timeframes
We still have to be conservative with the higher timeframes.
If this ranges breaks down than it could be a Distribution play and could result in a good size drop.
I hope this helps, I wish you all the best of luck trading this week!
Have a blessed day. 😁

DOW JONES shortWave analysis, impulse wave done , now we are in corrective wave two .
wait for breakage of the yellow trend line for initiation of wave 3 . ( may be with touch of 0.618 fibo .


End of wave C with a ending diagonal?On the final wave C, the fifth wave had form an ending diagonal!
Is this the end of the dead cat bounce?!

Dow Jones - US30 Short Trade IdeaPrice has retraced to 50% Fib level and previous broken structure. Watching Price action for sell setup on 4hr.
If this gives away the next stop for sell is at 61.8% Fib and confluence of multiple support and resistance.
Fundamentally it's a bear market and considering all the companies are literally closed for business and some of them already out of business, the next move is only to the down side.

US30 / DOW JONES - BEAR TRAP!On a technical basis, we believe this short term bull rally is a massive bear trap. Price has reached key level 24000 resistance. This area has acted as major support on the daily/weekly/monthly time frames.
Feds are pumping money into the markets causing strong optimism, but will this cure this down fall?
If we have major negative catalyst, we can expect price to break below our trend line to bring price to the down side to 21000

US30 SHORTSNice H/S forming for this pair on the 1H. Could give a nice drop if it comes through. Also retesting previous 1H trendline.

Daytraders, Are You Ready? (DJI)Symbol: DJI
This post is for all the day trading junkies out there. I am showing the 30 min time frame with a cross over to the downside. If I double that timeframe and go to the hourly, I'm at a tipping point in thr market. We would enter to short till 30 min and hourly line up to go back to the upside. We are putting our money on red. We will watch closely on the market open . If we see a change in our indicator and strategy than we will have to play break to top. But, for the most part we are short here.
----------------------------------------------------
Want to level up your trading skills?
We just realesed our new course! Follow our tradingview page and visit the link in our bio if you are looking for new strategy to add to your arsenal.
Also checkout our trading indicator available in the link on our page.
---------------------------------------------------
Thank you for your continued support, God bless.
- Major League Trader

Dow Jones now at 20941, Long Term Target is below 10000Long Term Dow Jones Industrial Average target is below 10,000
This is not a forecast I want to make, but this is what my longer term analysis shows. I hope the forecast does not come true but this is what my analysis shows, which is based on multiple time frame analysis of volatility and momentum.
Best strategy according to this analysis is to look for sell signals after every strong rally loses momentum, unless and until this high probability pattern is invalidated.
