Dowjonessignals

Dow Jones 4H-TIMEFRAME ANALYSIS 💡Dow Jones 4H-TIMEFRAME ANALYSIS 💡
Hello ladies and gentlemen
This is my new idea for the DJI
My idea is that DOW will continue to downtrend
Targets
27000
26400
I hope my idea is clear
Support me by like and share
Good luck💰💯

Trade Update: Sell 25-50% and move stop to 27200
Real-Time Algorithmic Trading Signals. Stay curious

DOW JONES broke above the 1D MA50. Buy Signal.Pattern: Channel Up on 1D.
Signal: Buy as the price broke above the 1D MA50, crossing it as a Resistance for the first time since April 27. Also the MACD formed a Bullish Cross. The past 3 occurrences initiated a rally.
Target: 29200 (the Resistance).
** Please support this idea with your likes and comments, it is the best way to keep it relevant and support me. **
--------------------------------------------------------------------------------------------------------
!! Donations via TradingView coins also help me a great deal at posting more free trading content and signals here !!
🎉 👍 Shout-out to TradingShot's 💰 top TradingView Coin donor 💰 this week ==> gergiabboud
--------------------------------------------------------------------------------------------------------


Dow Jones 1D-TIMEFRAME ANALYSIS 💡Dow Jones 1D-TIMEFRAME ANALYSIS 💡
Hello ladies and gentlemen
This is my new idea for Dow Jones
My idea is that DOW will continue to downtrend
Targets
24800
23500
I hope my idea is clear
Support me by like and share
Good luck 💰💯

Dow Jones is ready to go lower to complete (ABCDE) daily waves Dow Jones is ready to go lower to complete (ABCDE) daily waves and test the key resistance zone 25k

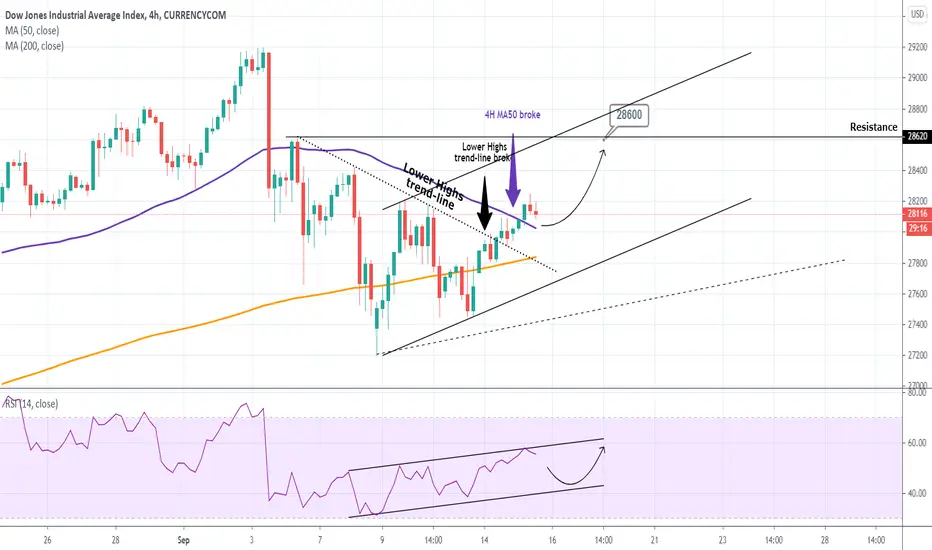
DOW JONES Buy SignalPattern: Channel Up on 4H.
Signal: Buy as the price broke above the Lower Highs trend-line and the 4H MA50.
Target: 28600 (just below the September 04 Resistance).
Medium term buy signal on Dow on the 1D chart:
** Please support this idea with your likes and comments, it is the best way to keep it relevant and support me. **
!! Donations via TradingView coins also help me a great deal at posting more free trading content and signals here !!
Shout-out to TradingShot's top TradingView Coin donor this week ==> CITIZENCAINE
DOW JONES Strong long-term Buy SignalPattern: Channel Up on 1D.
Signal: Buy as the price rebounded on the 1D MA50.
Target: 29000 (1.2 Fibonacci extension).
** Please support this idea with your likes and comments, it is the best way to keep it relevant and support me. **
!! Donations via TradingView coins also help me a great deal at posting more free trading content and signals here !!
Shout-out to TradingShot's top TradingView Coin donor this week ==> NilBalance

DOW JONES Trading PlanPattern: Channel Up on 4H.
Signal: (A) Sell as the RSI got rejected on its Resistance Zone. Wait for the MACD to cross in order to open the position. (B) Buy if the 28160 Resistance breaks.
Target: (A) 27000 (projected contact with the 4H MA50). (B) 29700 (+14.50% rise from the Higher Low).
** Please support this idea with your likes and comments, it is the best way to keep it relevant and support me. **
!! Donations via TradingView coins also help me a great deal at posting more free trading content and signals here !!
Shout-out to TradingShot's top TradingView Coin donor this week ==> @scheplick

DOW JONES Trading planPattern: Channel Up on 4H.
Signal: Bullish on every dashed line.
Target: The two Resistance levels 26,790 and 27,640.
** Please support this idea with your likes and comments, it is the best way to keep it relevant and support me. **

US 30/Dow Jones - AnalysisHello traders, here is the analysis from our team : We need price to push above 26024, pullback above this area. Then re break for nice run. Good luck today.
Let us know in the comment section below if you have any questions.😉

DOW JONES Sell SignalPattern: Bullish Megaphone on 4H.
Signal: Bearish as the price was rejected on the Megaphone's Higher High trend-line and broke through the (dashed) inner Higher High line.
Target: 24250 (roughly a -6% decline like the previous Higher High rejections, as well as contact with the 4H MA200).
** Please support this idea with your likes and comments, it is the best way to keep it relevant and support me. **
Previous DOW JONES trade:

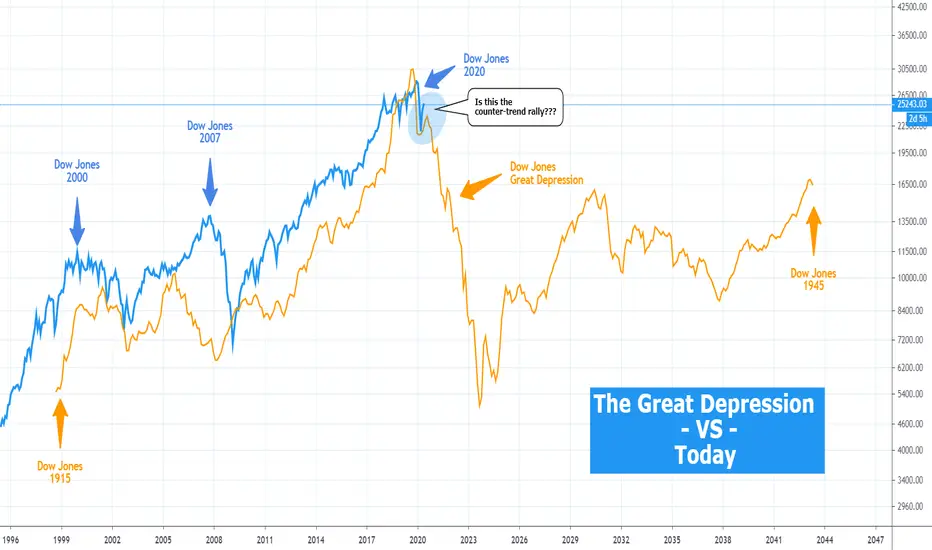
DOWJONES Is this the countertrend rally of the Great Depression?I will not spend much time describing this as the chart is pretty much self-explanatory.
I have plotted Dow Jones trend of 1915 - 1945 (orange line) which includes the Great Depression against the trend of the recent decades (late 90s to 2020) which is displayed in blue.
Do you think they look similar? And if so are we currently on a similar counter-trend rally as in the start of the Great Depression? The comments section is yours, let me know!
Please like, subscribe and share your ideas and charts with the community!
P.S. For the record, I am not trying to scare anyone, just shared an interesting comparison.
DOW JONES Trading PlanPattern: Emerging Channel Down on 4H.
Signal: Bearish as long as the 24395 trend-line is intact. Bullish if it breaks.
Target: 23350, 22950 and 22380 in succession (Supports 1, 2 and 3 respectively) depending on how much risk you want to take (R/R ratio).
** Please support this idea with your likes and comments, it is the best way to keep it relevant and support me. **

DOW JONES Signs of the Great Depression?This is a DJI comparison of the Great Depression and the phase that preceded it against the current COVID sell-off and the phase since the DotCom bubble that led to it.
** Please support this idea with your likes and comments, it is the best way to keep it relevant and support me. **
As you see both time phases are Megaphone patterns. Both started on high volatility (A,B,C,D) while the Megaphone was emerging and after testing the Higher High trend line for the longest time of the phase (E), the price broke above it making an over-extension (F). This is usually where most retail and other dumb money are trapped during recessions. What followed (F) during the Great Depression was of course a complete and lengthy collapse of the system, the worst recession in history. Also look how harmonically the 1M MA100 is moving on both patterns.
Will history repeat itself? I want to know your opinion about it.
*For the record the purpose of this comparison is not to spread panic, I will leave it to the mainstream media to do so. But it is so intriguing that I think can make a great discussion in the comment section below! So will it fill the gap?

DOW JONES How to trade this pull backPattern: Channel Up on 1M (since September).
Signal: Bullish with 1 position now on the Higher Low of the pattern and if it breaks 1 more on the 1D MA200.
Target: 30000 (projected Higher High).

DOW JONES Buy SignalPattern: Channel Up on 1D.
Signal: Bullish as the pattern made a Higher Low.
Target: 29300 (just below the 1D Resistance).

DOW JONES Sell SignalPattern: 1H Channel Up.
Signal: Bearish as the price failed to break the medium term Higher High trend line (bold black) was rejected sideways and formed a Death Cross (MA50 crossing below the MA200) while the 1H RSI is trading on a bearish divergence.
Target: 28,030 (1H Support) and 27,800 (4H Support).

Dow Jones - BUY NowPrice can be retrace from the trend line (red colour) and move to 0 level of fibo.
Note: Trade at your own risk.
www.turningpointfx.com
twitter.com
www.facebook.com
www.instagram.com

Dow Jones - Buy NowYes Dow Jone is in good for buy. Its already crossed the 0.786 fibo level and whenever price moving from down to upward in RSI and crossed the 64.34 (Blue horizontal line) its keep continue the bullish movement.
@ 26994 (this price can be change according to the broker)
TP 1 - 27120
TP 2 - 27135
TP 3 - 27150
SL - 26837
Note: Trade at your own risk high volatility and use money management.
Join with us for free signals
Telegram - t.me
Facebook - www.facebook.com
Twitter - twitter.com
Website - www.forexcaction.com

DOW JONES Buy SignalPattern: 4H Channel Up.
Signal: Bullishas the price is near the Higher Low region.
Target: 27200 (Lower High of the 1W Triangle) and 27400 in extension (1W Resistance)

DOW JONES Buy signal on break out and pull backPattern: Descending Head and Shoulders on 1W.
Signal: Bullish above the Lower High trend line and within 24700 - 25200. Supporting: thr 0.382 Fibonacci and RSI at 30.
Target: 26700 (1W Resistance).
