Dow Jones Index Rises Towards Key ResistanceDow Jones Index Rises Towards Key Resistance
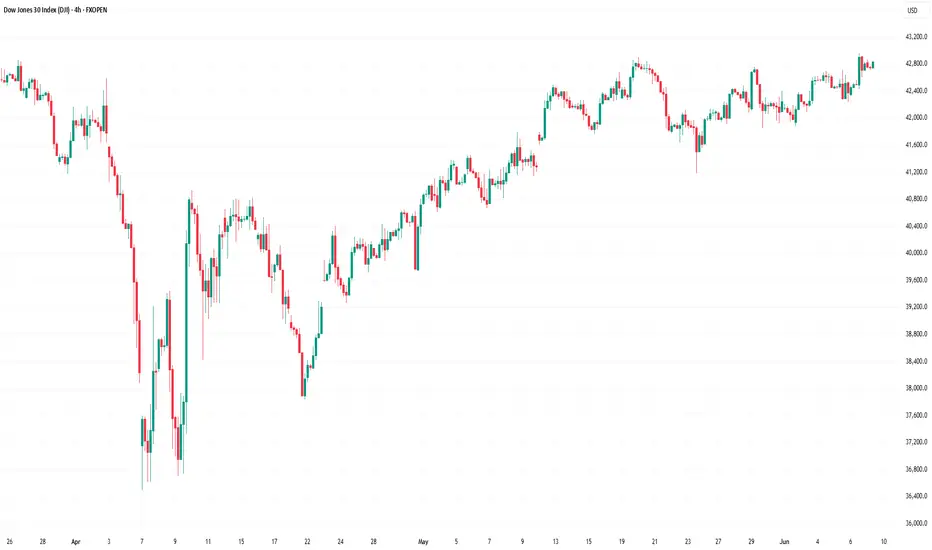
On Friday, the Dow Jones Industrial Average (Wall Street 30 mini on FXOpen) climbed above the 42,950 level — a high not seen since early March.
The index has gained around 1.6% since the beginning of June.
Why Is the Dow Jones Rising?
→ Friday’s US jobs report helped ease concerns about the country’s economic outlook. According to ForexFactory, Non-Farm Employment Change came in at +139K, beating the forecast of +126K.
→ On Thursday, Donald Trump and Chinese President Xi Jinping held a call, easing tariff tensions. Market participants also welcomed news that officials may hold trade negotiations in London on 9 June.
Could the DJIA (Wall Street 30 mini on FXOpen) Rally Continue?
Technical Analysis of the Dow Jones Chart
The chart suggests that the 42,950 level is acting as a significant resistance. The price has repeatedly reversed from the 42,660–42,950 area (as shown by the arrows).
At the same time:
→ Friday’s move above 42,950 triggered selling pressure, forming a candlestick with a long upper shadow;
→ This may have been a false bullish breakout of the May high;
→ The price remains within an ascending channel (shown in blue), but the bounces off the lower boundary appear weak.
Given this setup, it is reasonable to assume that intensified bearish activity near 42,950 on the USA30 could lead to a breakout below the channel’s lower boundary.
Additional pressure on the Dow Jones Industrial Average (Wall Street 30 mini on FXOpen) may come from developments in California, where protests have erupted against immigrant deportations, with President Donald Trump and Governor Gavin Newsom trading accusations.
This article represents the opinion of the Companies operating under the FXOpen brand only. It is not to be construed as an offer, solicitation, or recommendation with respect to products and services provided by the Companies operating under the FXOpen brand, nor is it to be considered financial advice.
Dowjonesstock
DJI Pair : DJI - Dow Jones Description : Rising Wedge as an Corrective Pattern in Short Time Frame with the Breakout of the Lower Trend Line and Retracement. Completed " 12345 " Impulsive Waves and " AB " Corrective Waves. RSI - Divergence. Break of Structure.

US30 IDEASo far the overall movement of US30 is bearish.
Price might be heading to the HTF LH, meaning that the current bullish trend is because price is reaching for the HTF LH and until it breaks it then the overall bearish trend will be broken.
I'm trading the bull run on the LTFs.
Predicted movements:
wave 1, 2 and 3

United Health: Healthy As A… Bear? 🐻… or what was that saying again? Anyway, after a short hiatus, the bears in our United Health-chart should regain their health and get back to work. They should soon push the share below the support at $456.73 and from there into the dark green zone between $427.67 and $391.43, where wave A in dark green should end. This low should then be followed by a considerable upwards movement above the resistance at $501.40. There is also a 37% chance that United Health could cold-shoulder the dark green zone and climb above $501.40 directly. In that case, we would consider wave alt.A in dark green to be already finished.

Home Depot: Diligent ⚙️As a hard worker, Home Depot has just recently nailed down wave X in green, hitting our green target zone between $282.54 and $260.03. From this low, the share has already started the anticipated ascent and thus should soon reach the resistance line at $347.25. Next, Home Depot should saw through this mark and climb into the gray zone between $360.98 and $402.97 to tape down wave b in gray before turning downwards again. The following descent should then lead the course back below $347.25 and subsequently below the support at $260.03. There is a 37% chance, though, for Home Depot to drop below this level early. In that case, we would assume that the share has last developed waves alt.1 and alt.2 in green instead of waves (A) and (B) in magenta and thus has already finished wave alt.b in gray.

Honeywell: Into the Honeypot 🍯Honeywell should push its fingers deep into the green honeypot between $194.17 and $178.41, breaking through the support at $196. There, the share should gain new strength by finishing wave 2 in green and turn upwards again. First, it should climb back above $196 and then take off from this mark, aiming for the resistance at $222.56. Once above this level, the course should gather further momentum and continue the ascent.

DowJones-US30The price break of the trend, and according to my analysis, the price can be corrected. Caution observe the money management and the stop loss, to know about them, follow me and comments and wait for the update.

Dow Jones ( DJI ) Next MoveDOW JONES INDUSTRAIL AVERAGE ( DJI )
Time Frame - H1
We have ELLIOT IMPULSIVE WAVE ( Bearish ) in Long Time Frame #LTF
Completed " 123 " Wave and Forming " 4th " Impulsive wave will Reject from Fibonacci Level ( 50% - 61.80% )
BULLISH CHANNEL Pattern in Short Time Frame #STF need Rejection from the Upper Trend Line #UTL
ELLIOT TRIPLE WAVE COMBO in Short Time Frame #STF and completed the " Y " Wave
Sell After Rejection from the Demand Zone ( 31908 - 32176 )

Dow Jones US30 Chart H1Here is my view for US30 on H1. The price could go down, you can put a pending order on the Order block or find an entry on LTF within OB Zone. Trade Safe!

Dow Jones US30 Chart H4Here is my view for US30 on H4. The price could go down, you can put a pending order on the Order block or find an entry on LTF within OB Zone. Trade Safe!

very strong support
Entry: $46.60
SL: $43.70 (loss 6.24 %) (visual only, close if daily closing price below)
TP1: $55 (profit 17.8 %, ratio 2.9)
TP2: $65 (profit 39.5 %, ratio 6.3)
Hello Traders and Investors,
in my opinion, this setup offers a very good trading opportunity as well as a good investment opportunity.
The price is at a strong buy zone. The price has already formed 2 nice weekly hammers. In daily, there was a hammer a few days ago and confirmation by the bullish candle the next day.
The price has been in a range of about $45 to $56 for over a year. If the price leaves this range to the upside, there is a high probability of reaching $65.
However, WBA also offers a good investment opportunity as the dividend yield is over 4% and the fundamentals are also very strong.
Deutsch
Hallo Trader und Investoren,
dieses Setup bietet meiner Meinung nach eine sehr gute Tradingmöglichkeit, sowie eine gute Investmentchance.
Der Kurs befindet sich an einer starken Kaufzone. Der Kurs hat schon 2 schöne Weekly Hammer gebildet. Ebenso im Daily gab es vor paar Tagen einen Hammer, sowie eine Bestätigung durch die bullische Kerze am nächsten Tag.
Der Kurs befindet sich seit über 1 Jahr in einer Range von ca. 45 $ bis 56 $. Falls der Kurs diese Range nach oben verlässt, gibt es eine hohe Wahrscheinlichkeit, dass der Preis die 65 $ erreicht.
Jedoch bietet WBA auch eine gute Investmentmöglichkeit, da die Dividendenrendite über 4 % liegt und die Fundamentaldaten auch sehr stark sind.

Dow Jones US30 Chart H1Here is my view for US30 on H1. The price should go up, you can put a pending order on the Order block or find an entry on LTF within OB Zone. Trade Safe!

Dow Jones: Ready for Takeoff ✈️ On his way downward, Mr. Jones has already dived into the white area between 35690 and 34805 points a few times and he still could go in there again to finish wave (2) in white. There, at the latest, we expect the index to rise again. If it breaks through the resistance at 36832 points on its way, higher goals will become more and more likely.
There is also a 40% chance that the index could rise immediately and hit the 36832 mark earlier already. So, you should all fasten your seatbelts, because Mr. Jones is ready for takeoff!


Dow Jones Index (US30): 36000 is comingAfter the good growth it has experienced, we expect to have a short-term correction to the specified level and then move on to its new Targets ...

Dow Jones crash before 2025!New highs for a few more years and then a big crash coming..
The chart speaks for itself.. (Eliott wave)
This is not an investment advice.

New Fiscal AID may Help Us30 , But Trump's losses will crashed..Democrats and Republicans remain at an impasse over new fiscal aid. That will help US30 to rise in the short term. But poles shows that Biden is ahead of trump. If Biden will stock market may drop again. During Covid-19 and Trump administration us30 raised a lot. and trump is stock market-friendly. In the case of trump losses, us30 may suffer a lot.
US30 Sell Limit @29150.00
One More Sell Limit @29500.00
Sell Stop @ 28250.00
TP1: 27700.00
TP2: 27200.00
TP3: 26500.00

DJI Showing Me The Money. Tipping Point?Day 3 of holding a big boy short on the dow and everything is going as planned.
Ema dots, custom rsi, custom candles all red shifting trend.
If this is wave 5 I think we should be in for a good size selloff.
This is a daily chart. Would love to see this close red.
How are your trades going?

DIA Gravity Center with too much respect Well here is another opinion that can tell the story of the DOWJONES STOCK,
in the weekly analysis we can tell that there is a high probability that the market will go down to test the green trend values,
Please share with me your thoughts,
Kind regards.

😯 Uh Ohhhh! (DJI)💰 LET'S GET INTO SOME DOW JONES ANALYSIS!💰
1️⃣ First off SMASH that LIKE BUTTON & Give us a FOLLOW for DAILY ANALYSIS! 👍
- The 3 day is starting to show signs of blood as it is the first start to red since the bottom.
- I've been bearish on a lot of my post for the longterm approach.
- DJI been short since 26,990. The close at the end of this week will tell us a lot on how the 3 day wants to lead us into the weekly chart.
Best of luck to you and all of your trades this week! 🤜
Drop your charts and comments down below, share with us what you think is going on in the markets! ❤❤❤
Thanks for checking out our analysis! ✌😁✌
🥇MLT | MAJOR LEAGUE TRADER

💰 Dow Jones Rejected? (DJI)💰 LET'S GET INTO SOME DOW JONES ANALYSIS!💰
1️⃣ First off SMASH that LIKE BUTTON & Give us a FOLLOW for DAILY ANALYSIS! ❤❤❤
(Overall Market Sentiment) 🐻 Bearish
- I have been tracking this big boy heavy lately as I do hold a short from 26,990 area. I let the most recent coercive way push back up and held onto my position because I wanted to see if the longterm break of support would turn into new Resistance. You can see we shot back up with some engulfing candles but now seem to of have found some Resistance as the candles begin to compress and start to Crossover red.
- Let's also take into consideration that all of thr ema dots are beginning to shift back towards red. This is my play to try and capture a massive swing on the dow, I don't look forward to selling anytime soon.
Thanks for checking out our analysis! ✌😁✌
🥇MLT | MAJOR LEAGUE TRADER

💥 Still Holding My Short. (DJI)🥇 We are now testing predicted next major support levels from previous post below in related ideas.
First off. If your objective is to trade large timeframes like the 3 day then you need to be willing to absorb noise in a market. If you are going to trade a large timeframe you have to cut out your emotions and let it go. You will never become a successful swing trader if you can't do this. You look for your entry set your stoploss and move on to the next trade and continue to diversify your capital. You will NEVER capture every single exact bottom or every exact top. IT WILL NOT HAPPEN! It's going to take a lot of micro structures to form to create one overall massive trend. If you can't understand this and get caught up in emotions, trading probably isn't for you. I speak about a lot of the basic aspects of trading over and over again to help make my fellow traders understand regardless of what strategy you trade with, the core fundamentals play a bigger role than anything! Cut loss, use stop loss, let the timeframe play out, don't marry bad trades, don't dollar cost average on the way down, cut out emotions.
We have been short on the dow jones since 26,990 which is still roughly around 5% in profit. We had taken this trade based off the 3 hour timeframe as we scouted previous major structure to play. We lined up the Crossover strategy and the ema dots and went with it. We have now broken the green major support level and now are testing major key levels on previous horizontal green supports. You see that price has rebounded off those levels to try and test the upward green strong longterm old support. Remember support can become new Resistance. Let the trade play out. We are starting to get some green compression on the 3 hour candle looking for a crossover and ema dots to line up. My main focus is that we are under that longterm support. If it can hold than we could see a bigger selloff and start to roll this trade over into the larger timeframes for a longer hold, which I would prefer. I am not worried about it and will let it ride to see how it holds up on key s&r levels.
Have an awesome week! Look at some of the previous dji calls in the related ideas below. 👍

MLT Called The Top! 6.9% Gain! 🥇 (DJI)👌 Well, Well, Well.... she seemed to of had a rough Thursday just as we expected it to have.
The main upward support level has been breached, which is not a good sign.
What we are looking for next to be test and try to hold is not not too far away.
25k-24.6k as I have it label as a key level of support.
We took this position on a 3 hour timeframe as the Crossover strategy and the ema dots shifted towards the red alignment.
We will look to see if we can get a reversal here or if it decides to just melt through the bottom. 🔥🔥🔥
Best of luck to you all! 🎲🎲🎲
🥇MLT | MAJOR LEAGUE TRADER
