Wait till 3535, then short.Against us is the whole downtrend, strong resistance (red line) and EMA. Within a few days, I am expecting a strong move down.
Down

SELL MAX LOT SL 1321.25 TG ON CHART SELL MAX LOT SL 1321.25 TG ON CHART
FOR MORE PM ME.......
MAKE MONEY IN TONS


Bitcoin: NVT Trendline break to spark Volatility BreakoutVolatility is contracting in Daily Bitcoin to similar levels seen prior to the violent move down from 6000 to 4000.
In this study, we're going to use the NVT indicator as a tool to confirm when could happen the next breakout.
The NVT line has bottomed during December 2018 and already allows us to draw trendlines on it.
We can observe the red NVT trendline being broken in anticipation of the last down move from 4000 to 3600.
Getting back to volatility, we see it coiling hard. And now the question is two-fold:
a) When the energy contained by the volatility is going to be released?
b) Which direction will take the explosive move?
To answer the WHEN question, I'd like to point the test of the next NVT trendline (blue dots).
I see high probability of a volatility breakout sparking as a result of breaking the NVT trendline. That might be the moment of truth.
With regards to DIRECTION, a solid break under the trendline clearly points towards a Down Move.
In that breakout scenario, I foresee BTC hitting harmonic targets sitting below the actual lows (2800 area).
And that would be the minimum target because an explosion in Daily chart certainly might have enough energy to hit lower levels.
Now, if we see the NVT line bouncing off the trendline, it could trigger a Gartley 222 being drawn.
And that's a move that would coil even more the volatility. It just would delay the resolution of the above questions for some days/weeks.
Right now I'm not reading clear signals to support the case for the Volatility to break in Up Direction.
Certainly, a bounce off the blue NVT trendline followed by a solid breakout above the red NVT trendline could be a good one. It's just that I don't see the signals that support that scenario (at least yet).
Stay tuned for the next significant move! ;)

EOS Trend continuation trade - 19% shortSELL : NOW
BUY back in the graph zone
STOP : Above previous high
Simple trend continuation idea
MACD has reset, Bollinger Bands are contracting, means price is getting ready for the next big move :)


Potential Financial Crisis Ahead (Speculation)Market Cycles will always be Market Cycles, Humans will always be Humans, Emotions stay Emotions.
(This is not financial advice, this is a volatile market where anything can happen)

ADA holding within its ascending triangle. RSI looks bearish.ADA is holding within its ascending triangle pattern on the price action, but the RSI triangle it was in has broken down, indicating we could see the price action start to follow before too long. I'm watching for a sustained break below 980 to confirm the break-down of this ascending triangle pattern. the 0.5 fib level around 960 and the .236 fib level around 930 are area's I'm watching for a rebound should it break down. A lot of this will be dependent on BTC; as for if BTC starts break down hard, I wouldn't be surprised to see ADA break down hard alongside it. If price can manage to hold within the ascending triangle and can start to push to the upside, I'm watching the 1.272 fib level around 1050, and the 2 fib level around 1130 as possible target area's should we get a sustained break-out to the upside.
--This is not financial advice. Always do your own research and come to your own conclusions before buying/investing, as investing in cryptocurrencies comes with high risk and high amounts of volatility .
If my post was helpful, and you'd like to support me, here are my donation addresses:
BTC: 3JA2z6FkxDhEHo5ncMEHHGLx78dzzwC1KH
ETH: 0x61DF878e5436530122f1A303e095dBd344502228
LTC: MVDbAhm2yoyCzeRnayMN61oZp75MZ5SZVj
Many thanks! :)

BTC/USD 4h Chart- Descending Triangle Pattern An interesting moment in which the triangle closes and the price should go up or down. In the textbooks it says that in a descending triangle, the price has to collapse, but will it happen?
Unfortunately, I do not have mantic abilities. But what I have seen over the years at BTC does not happen this scenario for the first time. I compare between 2014 and today 2018.
s3.tradingview.com
This situation is clearly visible here. In 2014, contrary to a descending triangle, the price gets a bullish trend and goes up.
I let you know what will happen in the future. If he considers contrary to expectations the price to go up "as I think it will happen" Give a thumb up.
Thank you, I appreciate it

ZRX back to support zoneHi traders,
Short opportunity on ZRX : StochRSI overextended - EMA200 acting as resistance - Weekly pivot unbroken => Back to S1
SELL : 0.825
BUY : 0.76
STOP : Above 0.85
RR : 2.3
Manage your risks


A volcanic "Price" eruptionEruption means here going high fast then plunging down. That's what I think has started to occur. Another eruption may occur also at any time (the second quake), but that is still really hypothetical so let the "price" "lava" falls down fist. (blablabla)
This is a very special analysis this time for 2 reasons. I'm doing my analysis on a 1-HOUR chart and
I'll make the analysis based on 2 new indicators I've created:
S4W Normalizer, and the S4W Velocity indicator.
Based on my analysis:
The sudden "pump" on price reaching 7800 USD has formed a wall. This is an opportunity for the S4W Normalizer indicator to bing a SHORT trading window, and to detect where the trade should stop.
There is 2 candidates for the stop, which are 2 revert-peaks I've framed in the S4W/Normalizer indicator. I think the price may go down to reach one of those 2 Stop candidates. The first one is more sure to be reached, the second one is more risky to be reached. but it may possibly goes below that level.
The S4W Velocity indicator has detected an upper peak that is a signal for a SHORT trade starting. I've drawn a vertical line to see where I would have place the real trade. I'm late in fact, so the trade started during that idea creation.
Conclusion: Bitcoin is still about to go down again, due to that wall that needs to be "stabilized".
I'm saying this to myself : "To say it short : short it now!!!"
So the current scenario for me is to stabilize that wall. How can a wall stands up without a real foundation. That's why I think the price should go down a bit, right now.
----------------------------------------
PS: Don't take my words for granted. Analyze, re-analyze, then trade at your own risks.
PS2: If you like this analyze, please click the LIKE button. FOLLOW me also to get my latest ideas. Thank you.
PS3: The S4W/Normalizer indicator is a corrected price graph that enhance peaks positions. Compare that indicator with the price, you will see it follows the price but the HH,HL,LL,LH are placed on different levels that can be exploited. Drawing or seeking elliot waves, waves can be used surelt (I'm not a wave surfer)...


Futur of ETH/USD (NOT SURE)I think the ETH will go up and down like the year before. Give me your opinion and your advice, I am a beginner in trading.

Gold still Down Trend And AslOo make Triangle PatternGold Still In down trend And ALsoOo make Triangle Pattern So if break 1210/1212 than Start Up trend target is 1224/1237/1248/1262/1285 if not hold than next is 1305/1316/1345 And If Break down Side SoOo Continue Down Trend 1194/1187/1180/1173 and If break 1160 than More Down like 1152/1123/1100 and last 1085 Best Of luck

Longer Term Montly View Gold Shor And Long AnalysisLonger Term Trend Is down So if 1st View Is If break 1160 Currently Low So Next Target Is 1125/1100/1085/1050 ANd Also last Is 890 And 2nd View Is If not Beak Low 1160 Than Going Continue up side and alsOo break 1210/14 level than next Targets Is 1238/1286/1315/1335 BEst Of luck......

AUD/USD - Bearish Week ahead?Hello traders,
This is my opinion for AUD/USD for this week.
Long term trendline resistance tested and rejected again.
Bigger support needs to be found.
I will update this trade soon when we reach 3 likes!

EUR/JPY - Short OportunityHello traders,
We are in a downtrend channel.
Wait for candle close and short if bearish!

EUR/USD - Sell oportunity on pullbackHello traders,
EUR/USD is looking to have a bearish ahead.
We wait for the pullback and then look for a short oportunity. Wait for bearish candle on resistance.

Rejected by 100 MA on hourly chartRejected by 100 MA and 100 MA crossed under 200 MA.
If it not get pumped we will see it at 6200 even 6000.
There is a big buy order for 162 btc at 6200 on Binance.

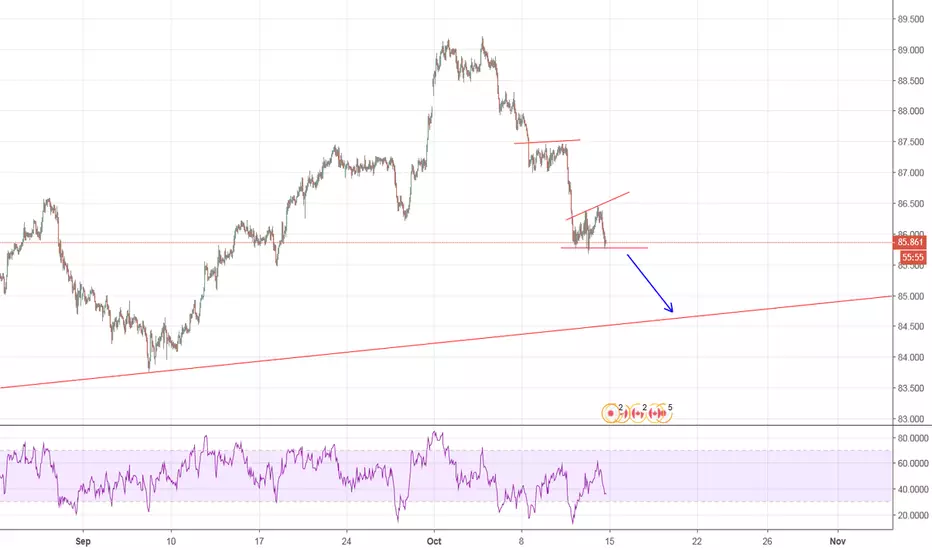
GBP/JPY - Bloody days aheadHello traders,
I have been watching this pair lately and after a bloody friday, more blood is coming this next week.
We should wait now for a small retracement before opening a short position.
Waiting for a smal reversal only and then more down moves again. Im waiting the price to retest the up trendline support.
I will update this trade soon!
Likes and comments are very apreciated :)
