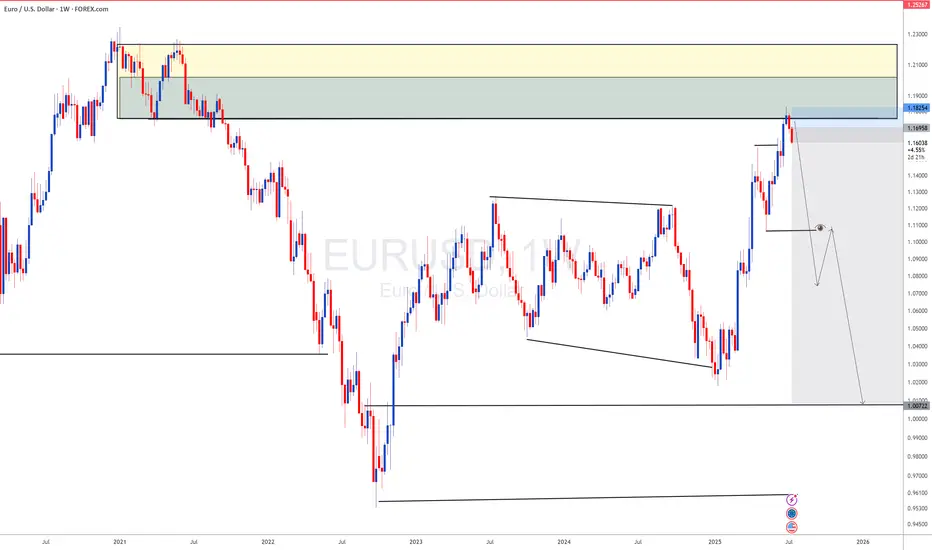
EURUSD as DXY s gaining momentum DXY has completed its long term downside now lets look for sell on EURUSD
Downside
SWDY Rebound AnalysisSWDY stock is trying to peak up, but unfortunately, it's rebounding back from the resistance line 80.081. In case of falling, it'll break the 1st support line 79.982 till reaching the 2nd support line 79.922, then the 3rd support line 79.832. In case of rising, it'll breach the 1st resistance line at 80.193, the 2nd resistance line at 80.344, and the 3rd resistance line at 80.464, which is more recommended due to its latest collaboration with Modon Holding to build an industrial zone for Egypt's Ras El Hekma on 10 Million square meters.

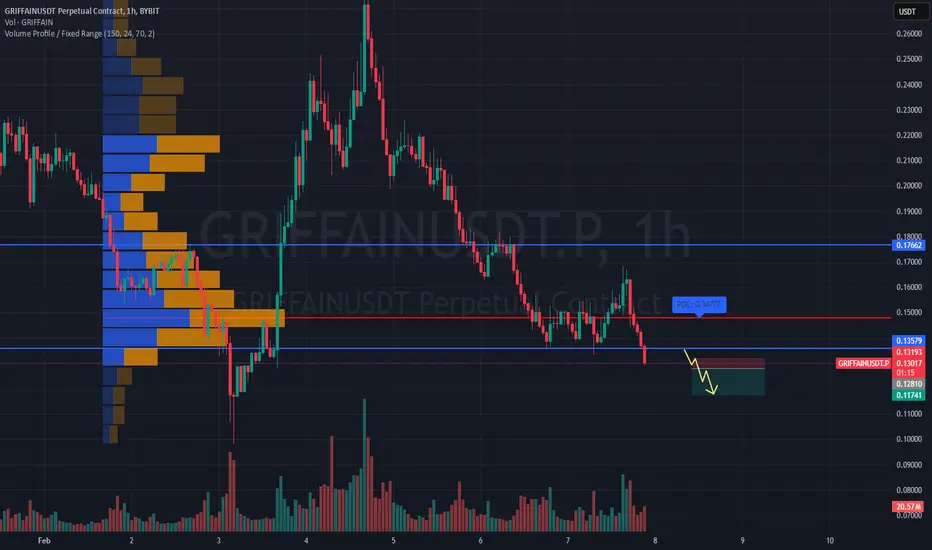
SHORT #GRIFFAINUSDT expecting further downside📉 SHORT BYBIT:GRIFFAINUSDT.P from $0.12810
🛡 Stop loss $0.13193
⏱ Timeframe: 1H
✅ Overview:
➡️ BYBIT:GRIFFAINUSDT.P is showing weakness after reaching a local high, rejecting from a resistance zone.
➡️ POC (Point of Control) at 0.13193 acts as a key volume area with significant trading activity.
➡️ Price action suggests seller dominance, indicating a potential continuation of the downtrend.
➡️ If the 0.12810 support level breaks, expect an increase in bearish momentum.
⚡ Plan:
➡️ Short entry upon confirmation of a breakdown below 0.12810.
➡️ Increased selling volume will confirm the continuation of the bearish trend.
➡️ Holding the position with dynamic monitoring until the first Take Profit level.
🎯 TP Targets:
💎 TP 1: 0.11741 – first target based on the nearest support level.
📢 BYBIT:GRIFFAINUSDT.P is showing bearish signs, but volume and pullback dynamics should be monitored.
📢 A break below 0.12810 could trigger a deeper decline.
📢 If buyers show strength, watch 0.13193 as a possible reversal point.
🚀 BYBIT:GRIFFAINUSDT.P maintains bearish momentum — expecting further downside!
#TRUMPUSDT expecting further decline📉 SHORT BYBIT:TRUMPUSDT.P from $17.400
🛡 Stop Loss: $17.966
⏱ 1H Timeframe
📍 Overview:
➡️ BYBIT:TRUMPUSDT.P is showing signs of weakness after forming local resistance. The price failed to hold above $17.966 , confirming seller pressure.
➡️ POC (Point of Control) is positioned above the current price, indicating that liquidity has already been distributed in the upper range, while demand zones are shifting lower.
➡️ The price tested $17.400 and started moving downward, reinforcing the bearish scenario. If this level breaks, a move toward $16.412 is likely, where demand was previously observed.
➡️ The $16.412 level may serve as a short-term bounce zone, so monitoring price reaction is crucial.
⚡ Plan:
➡️ Short entry after breaking $17.400 , confirming buyer weakness.
➡️ Risk management through Stop-Loss at $17.966 , placed above the nearest liquidity zone.
➡️ Primary downside target – $16.412 , where buyers may step in.
🎯 TP Targets:
💎 TP 1: $16.412
🚀 BYBIT:TRUMPUSDT.P continues to lose momentum — expecting further decline!
📢 BYBIT:TRUMPUSDT.P remains under pressure, and the current market structure suggests a potential continuation of the downtrend. If the asset breaks below $17.400, the decline may accelerate.
📢 It is crucial to monitor volume—if selling volume increases, the bearish trend will strengthen.
📢 However, the $16.412 level may act as a reversal zone, so partial profit-taking could be a smart strategy.

Alphabet (GOOGL) Analysis – Potential Downside RisksAlphabet is currently trading at $205. While it could still move higher, several factors might drive the price lower soon:
Extended Distance from 55 EMA:
The stock hasn’t touched the 55-day EMA for 147 days. While this doesn’t mean a pullback will happen immediately, a sharper downside move is possible.
Bearish Divergence:
The RSI has formed a lower high, while the price has made a higher high, signaling a potential bearish divergence.
Fundamental Risks – AI & Earnings:
Earnings Report on Tuesday:
Alphabet will report its earnings, and investors will focus on its high AI-related expenditures.
Revenue Growth Concerns:
The company may have experienced slower revenue growth in Q4 due to weakness in advertising and cloud services.
Competitive Pressure in AI:
Chinese startup DeepSeek recently launched low-cost AI models, raising concerns over a potential AI price war, which could impact Alphabet’s profitability.
While Alphabet remains strong, combining technical weakness and fundamental risks (earnings pressure, AI spending, and increased competition) could lead to a correction. If a pullback occurs, the 55 EMA could act as a key support level.
92% of positions are long. We all know the old saying—most people lose in trading. So if 92% of the market is long, we should at least be short for the moment.
This extreme bullish positioning suggests a potential contrarian opportunity, as overly crowded trades often lead to sharp reversals.

$UPS - what can Brown do for you?Downside channel, bearish overall flow and earnings is late January. I am tempted to give this a shot at 120p with risk being $127.50.
WALLSTREET L.

ELF, THE BEST CHRISTMAS MOVIE, SAAAAANTAAAAAAA!Really nice trends and price targets defined on this chart.
No idea what this coin is.
But technicals only, it looks like a really good buy.
Support is building at looking to potentially take off for a decent gain, before falling back to trend, which can spark the potential for another big gain.
I drew a line to represent something similar to what I'm seeing, but you don't want to follow this line, it will likely be inaccurate and is better for me to backtrack and remember what was going on with each chart at different times.
I wouldn't hold any higher than 2.3 or so for sure, but I have a hard time saying it will get there before Nov or Jan of 2024. But.. It is a very real price target for this coin.
The downside, percentage wise, is huge. So be careful and watch for a trend break.
Price target marked.
Feel free to ask if questions
I know I keep these a little quick on the discussion, but I try to make my charts pretty self explanatory.
I'm trying to make a lot of charts for earnings, potential market crash and more.
I'll link related ideas.

Looking strongly bearish on INTC at close today. 🔉Sound on!🔉
Thank you as always for watching my videos. I hope that you learned something very educational! Please feel free to like, share, and comment on this post. Remember only risk what you are willing to lose. Trading is very risky but it can change your life!

XAUUSD 90% CONFIRM ANALYSISDiscover an enticing Selling opportunity in GOLD as it undergoes a critical retest of a key resistance area. With market analysis, technical indicators, and price action as your allies, evaluate the potential downside move. Stay vigilant and informed to capitalize on this precious metal's market dynamics.

US Equities - lower high and large volumeUS Equities could be on a leg to the downside backed up by 3 weeks of heavy selling.
Not quite, but almost a double top.

Down channel 1) indian top company
2) prominent company to keep as portfolio stock
3) stock now bearish trending
4) down word channel
5) stock have to buy at this level
6) accumulation of stocks

Immupharma took the stairs #bearishIMM matches the adage, "Markets take the stairs up and the elevator down".

UPS has some, uh, GAPSI was looking into UPS as a possible investment, and wanted to get a price, but after looking at the chart, I'm not sure it's worth it. There seems to be a lot of potential downside, including a pretty sizeable gap around $120.
With almost everyone telling me the market is going to crash, I'm thinking we won't see it crash just yet, which does allow for some return in UPS's price to around $223-$225. The question, does it bounce there or keep going? I'm not sure, which is why I'll wait for confirmation of price action, but it's looking like UPS needs to cool off a bit. The move to $108 would be around a 45%-50% drop, which really isn't out of the question as it brings us back to pre-covid levels, when the shipping craze started.
Thoughts?

Simple Price action Break and Retest with XAUUSD SCALP H11. Market structure downside.
2. Breakout Momentum channel. for down side.
3. Entry = retest range momentum channel and Supply zone. SL: same picture.
4. Profit 2.5-3R

Netflix. Time to Chill.Today, Netflix's (NFLX) price plunged below the Head & Shoulders neckline, with a pronounced downward move. This breach substantially elevates the likelihood of an extended bearish phase, potentially materializing as a significant sell-off leading into the forthcoming fall season.
Projections indicate a retracement towards the 0.5 Fib Extension level, where the price could test support at the mean price of $323.87. This mean price represents the average of the comprehensive bull run, which initiated from the May 2022 low of $162.73 and culminated at a peak of $485, the recent July 2023 top. However, the price could find support at the bottom parallel of the uptrend channel around $370 first before reaching the mean average price target.
Moreover, the recent FOMC minutes revealed the Fed's continued hawkish view on inflation and the possibility of further rate hikes.
We can also expect more fiscal tightening and an inflation resurgence to fuel the coming downtrends across most of the equities markets, especially big tech and crypto. This is particularly noteworthy as the economy could begin to contract due to overly tightened fiscal conditions, along with the looming threat of another Government shutdown in October. Additionally, credit usage, debt levels, and debt interest amounts are all increasing at a faster pace as we progress under these economic conditions.

GBPUSDIn last 2 days we have observed price was under the dominance of Bearish trend. As the price is moving in bearish channel and seems like it is ready for another drop to downside.

XPDUSD - Palladium Surplus?Analysis:
When we take a look at the technicals we can see that price is in a downwards trend. We're seeing lows get broken showing us the bearish momentum. Price has recently broken below a key level of previous support which we now expect will hold as resistance. We don't really have any other added confluences to this setup like a trendline or fib retracement levels which is why this isn't one of our favourite setups but still one that we are looking at. To add more clarity to this setup we need to look at the fundamentals. The USD is very strong at the moment and each week we see the USD getting stronger so this isn't something that we want to be going against. One of the main uses of palladium is for catalytic converters in car exhaust systems but with EV cars taking over the market we're starting to see less demand for palladium and it seems like there could be a surplus of palladium which would push price down further. With all of the confluences factors that we have we see price continuing its downwards trend that it is in.
Please feel free to leave any comments you have and like this idea if you agree with us. Any feedback or comments will be read. We appreciate it all.
Stay Safe - JPI
Disclaimer:
This does not constitute as financial advise. We are not responsible for any monetary loss that you endure. Trading is hard to be profitable with and we take losses just like everyone else does to. Our ideas won't always be correct which is why we urge you to always do your own analysis first before entering into the market but please feel free to use our analysis to assist you with yours.

NZDUSD - Will The USD Rally Continue?Analysis:
From the charts we're clearly able to tell that price is in a downwards trend, showing us that we want to be shorting this pair only. Last week we saw a break of this key level and we're now seeing that same level get retested for resistance and there is a good chance that this area will hold. For added confluence we have a long term downwards trendline which has been respected multiple times, this gives us more confidence that price is in a downwards trend still. At our area we also have the 50% fib retracement level which we could expect sellers to be sat at wanting to push price down which again works in our favour. Fundamentally the USD is the 2nd strongest major currency pair making it very attractive to buy. The USD also has been on a rally recently showing that the bullish momentum is there. The NZD however is the 4th strongest major currency pair so when we compare the USD to the NZD we have more of a bias to be bullish on the USD then the NZD which goes in our favour for this setup.
Please feel free to leave any comments you have and like this idea if you agree with us. Any feedback or comments will be read. We appreciate it all.
Stay Safe - JPI
Disclaimer:
This does not constitute as financial advise. We are not responsible for any monetary loss that you endure. Trading is hard to be profitable with and we take losses just like everyone else does to. Our ideas won't always be correct which is why we urge you to always do your own analysis first before entering into the market but please feel free to use our analysis to assist you with yours.

GBPUSD Potential DownsideHello guys 👋
I just made analyst on GBPUSD which possible downside because can't break the resistance level. There is a divergence too on RSI.
#NFA #DYOR

(D) $AAPL APPROACHING CRITICAL JUNCTURE🍎 NASDAQ:AAPL approaching a critical juncture, tagging the resistance trendline established from ATH on the Daily. If we take the structure from ATH to now as a 3 wave correction, we could be finished and exiting the structure for upside now. However, we could get a bounce to the downside off the resistance, which would form a 5 wave corrective structure instead and provide confluence for my AMEX:SPY downside expectation's.

✅GBP_CAD LIMITED UPSIDE UNLIMITED DOWNSIDE|SHORT🔥
✅GBP_CAD is still trading
Below the massive falling resistance
Line and it seems that the pair
Is unable to break it so before
We see a bullish breakout
We will be bearish biased
And expecting a move down
From the resistance
SHORT🔥
✅Like and subscribe to never miss a new idea!✅

$SPY Eyeing Downside MomentumAMEX:SPY gap filled yesterday really quickly, but rejected at top and bounced off gold TL in EOD flush. Expecting CPI or FOMC minutes as catalyst for downside.
Note: bank ER is right after FOMC mins. Also, over $7.7B+ dark pool traded between 409.2-409.6 level; may act as S/R as this week unfolds.
Position: Eyeing downside momentum - watching how the market fluctuates beyond CPI and FOMC minutes.

DXY$DXY Dollar Showed Little Reaction to CPI Data so i'm looking for the markets to act normal with no more major news ahead anytime soon.
Therefore, i'm looking for DXY to drop and make a correction.
Disclaimer: This is not trade advice. Trading foreign currencies, stocks, indices, etc can be a challenging and potentially profitable opportunity for investors. However, before deciding to participate in the financial markets, you should carefully consider your investment objectives, level of experience, and risk appetite. Most importantly, do not invest money you cannot afford to lose!!!
Good luck and Happy trading!
