✅AUD_CAD POTENTIAL SHORT🔥
✅AUD_CAD surged again
To retest the resistance
But it is a strong key level
So I think that there
Is a high chance
That we will see a bearish
Pullback and a move down
SHORT🔥
✅Like and subscribe to never miss a new idea!✅
Downtrend

COIN Responds to Higher Terminal Rate ExpectationsCoinbase NASDAQ:COIN has been responding to higher terminal rate expectations, which have risen dramatically in the past month. In December 2022 and January 2023, the August Fed Funds futures contract previously showed a terminal rate of approximately 4.70%. And the consensus had adopted the view of significant rate cuts into year end 2023. Now, that has changed, and the FF futures contracts show that the market's view of rates is coming into alignment with the US Federal Reserve's messaging. The December 2023 contract has moved up approximately 22% since mid-December 2022.
Coinbase has been falling rapidly today, over -8.00% after PCE (the Fed's preferred inflation gauge) came in hotter than expected. Retail sales for January 2023 also came in hotter than expected, and measures of the economy give the Fed room to keep rates higher for longer. Markets want to have their cake and eat it too—but that's not possible in an inflationary environment (sticky components especially). Stronger economic data coincides with more sticky inflation data for now, which gives the Fed incentive (and room) to keep rates higher for longer.
Coinbase is correcting at a minimum. One cannot rule out the possibility of a retest of lows or a new low altogether. But until critical support is reached (and breached), it's best to take this one level at a time.
1. Today, COIN breached the lows from earlier this week, specifically the low on Feb. 22, 2023, creating a bearish short-term structure.
2. COIN has been in a short-term downtrend since February 2, 2023 highs. That provides a good risk-reward entry spot for short-term traders. Caution is advised due to the volatility regularly seen by this stock. And the closer the entry is to the defined risk level, the smaller the risk is and the larger the position size can be without violating risk-management principles (but the more likely the stop is to be triggered as well).
3. A conservative target is $52.50-$54.13 in the shorter term, provided the downtrend line holds
4. A moderately aggressive target is $44.90 to 46.61. This target is not in effect until the conservative target is breached and held to the downside.
5. If COIN does not make significant progress in the next few days, the idea will be cancelled. Vanna and charm hedging flows as March OPEX approaches can start to boost markets if downward progress is not made quickly in the coming week.
6. The Bollinger Bands suggest a downside breakout could occur in the coming days or weeks.
Supplementary Chart A
________________________________________
Author's Comment: Thank you for reviewing this post and considering its charts and analysis. The author welcomes comments, discussion and debate (respectfully presented) in the comment section. Shared charts are especially helpful to support any opposing or alternative view. This article is intended to present an unbiased, technical view of the security or tradable risk asset discussed.
Please note further that this technical-analysis viewpoint is short-term in nature. This is not a trade recommendation but a technical-analysis overview and commentary with levels to watch for the near term. This technical-analysis viewpoint could change at a moment's notice should price move beyond a level of invalidation. Further, proper risk-management techniques are vital to trading success. And countertrend or mean-reversion trading, e.g., trading a rally in a bear market, is lower probability and is tricky and challenging even for the most experienced traders.
DISCLAIMER: This post contains commentary published solely for educational and informational purposes. This post's content (and any content available through links in this post) and its views do not constitute financial advice or an investment or trading recommendation, and they do not account for readers' personal financial circumstances, or their investing or trading objectives, time frame, and risk tolerance. Readers should perform their own due diligence, and consult a qualified financial adviser or other investment / financial professional before entering any trade, investment or other transaction.

GBPCAD BEARISH SHARK PATTERN This is just An IDEA .
In GBPCAD H4 Timeframe have BEARISH SHARK Pattern GREEN LINES are Targets for TP.
WAIT FOR CLOSING RED CANDLE Under of BLUE Rectangle .
GREAT DAYS .

AUDCHF : POTENTIAL REVERSALGiven the corrective downtrend of price, there is a possibility of a rejection by forming a double bottom provided the descending channel is clearly formed and rejects at the third touch too.

Amazon Downtrend Call & Put Option PlayI think Amazon is on a down trend. How ever I also think there are goin to me some major levels for bounces. I'm looking forward to purchase a OTM put option to catch the overall trend. and to take call options at major support levels to previous resistance.

NZD-USD Bearish Bias! Sell!
Hello,Traders!
NZD-USD broke the key
Horizontal level and the
Breakout is confirmed
So I think that after
The pullback and retest
We will see a move down
Sell!
Like, comment and subscribe to boost your trading!
See other ideas below too!

#Bitcoin bad conditionsAccording to the bad statistics of PCE, if the market's expectation of a half percent interest rate increase in the upcoming FOMC meeting increases, risk markets will probably be under pressure.
The dollar index is getting stronger every moment and has reached an important static support
In these situations, the market is under pressure...
The market is bearish in the upper time frame
And every upper swing is an opportunity to save profit or exit :)

AUDCAD 1h short sellingHello traders, what we are going to look at today is the OANDA:AUDCAD currency pair.
If you look at the hourly chart of this pair, now there are opportunities to short sell it. But there is a little more up move to come. It has two short entries. My first entry is at 93100 and another entry is at 93600. As far as my eyes can see it is better to short 93600 rather than 93100.
These two entries give you a good result. But timing the market is very important. Just wait for the proper pattern and then enter in anyone of the entry and get wet in the rain of money.
Trade safe!
Thanks & Regards,
Alpha Trading Station
Disclaimer: This view is for educational purpose only & any stock mentioned here should not be taken as a trading/investing advice. We may or may not have position in the stocks mentioned here. Please consult your financial advisor before investing. Because Price is the "King of Market".

📉 Downtrend ID Cheatsheet *UPDATED*What Is a Downtrend? A downtrend is a gradual reduction in the price or value of a stock or commodity, or the activity of a financial market. A downtrend can be contrasted with an uptrend. Downtrends are characterized by lower peaks and troughs and mimic changes in the perception of investors. A downtrend is fueled by a change in the supply of stocks investors want to sell compared with the demand for the stock by investors who want to buy. Downtrends are responses to changes that surround the security, whether macroeconomic or those associated with a company's business activity.
🔹Understanding and Identifying Downtrends
As much as it is important to look out for uptrends when trading, it is equally important to understand and identify downtrends. A trader may potentially save money if they decide to sell off a declining stock. If many traders decide to sell a stock at the same time, it will result in a sharp decline in the stock price. The stock market is sentiment-driven, and fear of a further decline may result in even further selloffs of a stock. Some traders that frequently day trade may decide to implement stop-loss orders to protect themselves against a downtrend. A stop-loss order placed with a broker helps a trader sell once the price of the security reaches a certain price. Downtrends can vary from a gradual continuation to a sharp decline. A sharp decline may occur as a result of news-related topics, such as a poor quarterly earnings report or loss of a lawsuit. A downtrend can be identified and understood through various forms of technical analysis. One simple area of technical analysis is the use of trendlines. Trendlines connect a series of high or low points. The reversal of a declining trendline signals an uptrend. Another simple area of technical analysis is the moving average technical indicator. The moving average takes the mean of prices over a period in the past. If the price of a stock tends to stay below the moving average, it signals that the price is on a downtrend.
🔹Trading on a Downtrend
Many traders look to profit from sell offs of a stock. While many traders will sell, taking the view that a price will decrease further in the future, some traders take the opposite view of hoping for a price increase. Downtrends may also lead to attractive valuation and present new opportunities for traders to purchase shares of stock.
In another sense, downtrends allow traders to make money by short-selling stocks. In order to short a stock, a trader borrows shares and immediately sells them, in hopes that the price will fall. If the price of the stock goes down, then the individual will repurchase the shares back at the lower price and return the borrowed shares. The difference between the old price and the new price is the profit that a short-selling trader holds.
👤 @AlgoBuddy
📅 Daily Ideas about market update, psychology & indicators
❤️ If you appreciate our work, please like, comment and follow ❤️

📉 Downtrend Identification CheatsheetWhat Is a Downtrend? A downtrend is a gradual reduction in the price or value of a stock or commodity, or the activity of a financial market. A downtrend can be contrasted with an uptrend. Downtrends are characterized by lower peaks and troughs and mimic changes in the perception of investors. A downtrend is fueled by a change in the supply of stocks investors want to sell compared with the demand for the stock by investors who want to buy. Downtrends are responses to changes that surround the security, whether macroeconomic or those associated with a company's business activity.
🔹Understanding and Identifying Downtrends
As much as it is important to look out for uptrends when trading, it is equally important to understand and identify downtrends. A trader may potentially save money if they decide to sell off a declining stock. If many traders decide to sell a stock at the same time, it will result in a sharp decline in the stock price. The stock market is sentiment-driven, and fear of a further decline may result in even further selloffs of a stock. Some traders that frequently day trade may decide to implement stop-loss orders to protect themselves against a downtrend. A stop-loss order placed with a broker helps a trader sell once the price of the security reaches a certain price. Downtrends can vary from a gradual continuation to a sharp decline. A sharp decline may occur as a result of news-related topics, such as a poor quarterly earnings report or loss of a lawsuit. A downtrend can be identified and understood through various forms of technical analysis. One simple area of technical analysis is the use of trendlines. Trendlines connect a series of high or low points. The reversal of a declining trendline signals an uptrend. Another simple area of technical analysis is the moving average technical indicator. The moving average takes the mean of prices over a period in the past. If the price of a stock tends to stay below the moving average, it signals that the price is on a downtrend.
🔹Trading on a Downtrend
Many traders look to profit from sell offs of a stock. While many traders will sell, taking the view that a price will decrease further in the future, some traders take the opposite view of hoping for a price increase. Downtrends may also lead to attractive valuation and present new opportunities for traders to purchase shares of stock.
In another sense, downtrends allow traders to make money by short-selling stocks. In order to short a stock, a trader borrows shares and immediately sells them, in hopes that the price will fall. If the price of the stock goes down, then the individual will repurchase the shares back at the lower price and return the borrowed shares. The difference between the old price and the new price is the profit that a short-selling trader holds.
👤 @AlgoBuddy
📅 Daily Ideas about market update, psychology & indicators
❤️ If you appreciate our work, please like, comment and follow ❤️

✅EUR_GBP BREAKOUT|SHORT🔥
✅EUR_GBP was trading in an uptrend
But now we are seeing a bearish breakout
So I am bearish biased and I think
That the price will fall down
To retest the demand level below
SHORT🔥
✅Like and subscribe to never miss a new idea!✅

✅AUD_CHF WILL KEEP FALLING|SHORT🔥
✅AUD_CHF is growing locally and will
Soon retest a horizontal resistance level
And because the pair is in the downtrend overall
This presents a classical
Trend following selling opportunity
SHORT🔥
✅Like and subscribe to never miss a new idea!✅

Is BTC still heading to the baseline support?I still think BTC is heading to the baseline support around 12k, I am talking about further down from here below capitulation, moving further into desperation territory, followed by a long consolidation period.
Why? because the downtrend haven't changed yet, together with equities cryptos are in a bear trend IMO.
Bearish points: The 50ma has just crossed above the 200ma, RSI also showing contraction in overbought territory.
The speed of the downfall has changed, but not the direction IMO.
Watch out.

XAUUSD : POTENTIAL SHORT ENTRYPotential expanding triangle formed within a downtrend.
A rejection at the third touch will suffice for a short entry.

BANK NIFTY ANALYSIS - 22/02/2023Buy Above - 40760
SL - 40700
Targets - 40900,41080,41200
Sell Below - 40600
SL - 40720
Targets - 40420,40260,40150
Trade Safe & Happy Trading Guys

BANK NIFTY ANALYSIS - 21/02/2023DOWN TREND PATTERN
Buy Above - 40800
SL - 40740
Targets - 40950,41080,41200
Sell Below - 40600
SL - 40720
Targets - 40420,40260,40150
Trade Safe & Happy Trading Guys

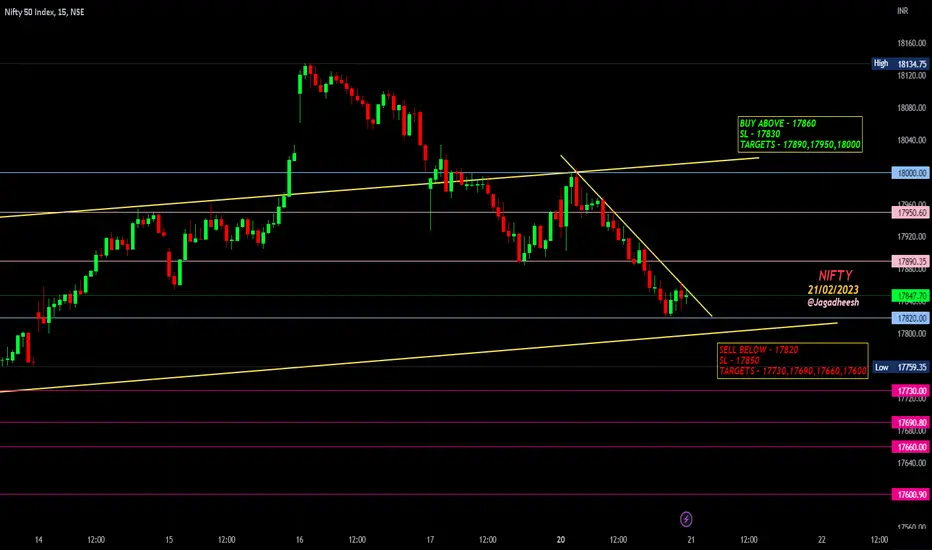
NIFTY ANALYSIS - 21/02/2023DOWN TREND PATTERN
Buy Above - 17860
SL - 17830
Targets - 17890,17950,18000
Sell Below - 17820
SL - 17850
Targets - 17730,17690,17660,17600
Trade Safe & Happy Trading Guys
✅NATURAL GAS WILL KEEP FALLING|SHORT🔥
✅NATURAL GAS broke out of
The range and as the price
Is in the downtrend I think
That we will see a bearish
Move down towards
The target below
SHORT🔥
✅Like and subscribe to never miss a new idea!✅

US30 Price Action and Weekly Market Structure - Short ObservedObserving US30 on the weekly chart we can see the bigger picture. In the chart we can see that price has been in an overall downtrend since leaving the top level marked. Price is currently indecisive at our most recent lower low/supply zone. Although we have been bouncing around going in no particular direction, we still see signs of rejection to the upside.
Considering we are in an overall downtrend, currently rejecting to break the previous lower low, several major bearish rejections, a few pinbars, I will be holding a short position to the next major level.

✅GOLD KEY LEVELS📊
✅GOLD is trading in a
Downtrend so I think it will
Go down further and retest
The support level 1
After that we will see
The price either go down
Towards the support level 2&3
Or we will see a change in the
Direction and the resistance 1&2
Will take the hit again
ANALYSIS📊
✅Like and subscribe to never miss a new idea!✅

NATGAS Broke The Range! Sell!
Hello,Traders!
NATGAS is trading in a
Downtrend and the price
Broke out of the horizontal
Range so I think that
We will see bearish
Continuation
Sell!
Like, comment and subscribe to boost your trading!
See other ideas below too!

NZD-CHF Swing Short! Sell!
Hello,Traders!
NZD-CHF broke the key
Horizontal level and the
Breakout is confirmed
So I think that we will
See a move down
Sell!
Like, comment and subscribe to boost your trading!
See other ideas below too!

ethusdt in downward trendlineA bearish trend line is drawn in a downward trending market. The lower highs are connected together to construct the bearish trend line.
