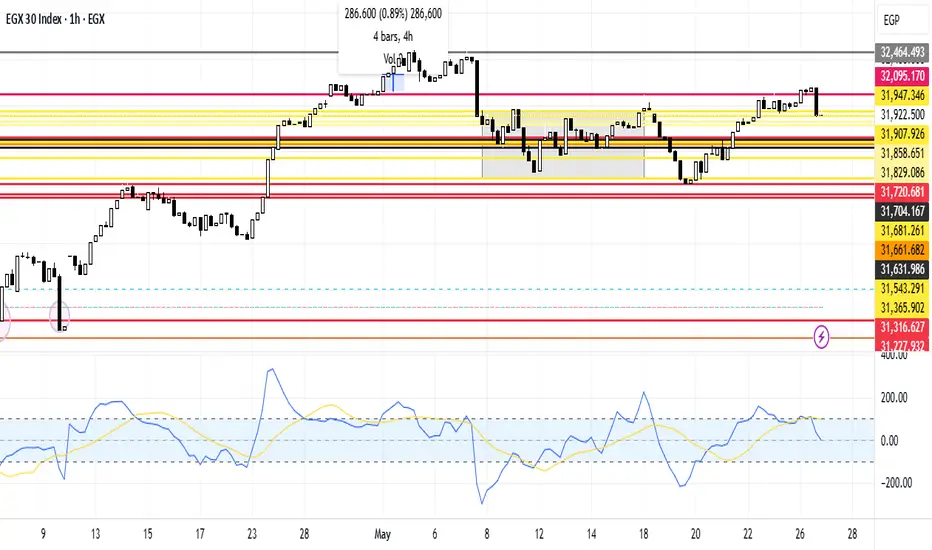
EGX30 Movement AnalysisEGX30 stock is currently in a higher region than before. Unfortunately it rebounded to the support line 31,907.926. In the case of continuing downward it's expected to reach the support line 31,858.651 then break the support line 31,829.086. In case of taking an upward trend, it is expected to breach the resistance line at 31,907.926 and then reach the resistance line at 31,947.346. And reach the third resistance line at 32,095.170 points.
Downward
GOLD - Price will make correction movement to support levelHi guys, this is my overview for XAUUSD, feel free to check it and write your feedback in comments👊
Some time ago price started to grow inside a rising channel, where it soon reached $2940 support level and broke it.
Then it some time traded near this level and then continued to grow in channel and soon reached resistance line of channel.
Soon, Gold reached the $3055 level and then corrected to the channel's support line, after which it turned around.
XAU reached $3055 level again and broke it, aftr which continued to grow and recently, it reached almost resistance line.
But soon, it turned around and started to decline, so, in my mind, Gold can continue to decline to $3055 level.
If this post is useful to you, you can support me with like/boost and advice in comments❤️

Plan for 22nd January 2025Nifty future and banknifty future analysis and intraday plan in kannada.
Positional trading ideas included.
This video is for information/education purpose only. you are 100% responsible for any actions you take by reading/viewing this post.
please consult your financial advisor before taking any action.
----Vinaykumar hiremath, CMT

BITCOIN after the FOBO ! ( FAKEOUT BREAKOUT)
BITCOIN, after the FAKEOUT BREAKOUT, has re-entered the bearish channel that we’ve been monitoring for several months. This was a false breakout, which left many of us hopeful for a bullish market, but it turned out to be the opposite!
But no worries, we must wait. The important thing here is that, within the bear market we saw last week, the price bounced off a very important and key zone that we’ve been tracking for several months.
This purple zone is what I call my inefficiency zone, which I also consider one of the strongest areas where Bitcoin has previously made strong impulses.
The only thing we should consider here is that Bitcoin will likely try to break the channel again. We can’t do anything until the price is on the other side of the channel. It’s that simple! Don’t try to enter right now because the price could pull back. Always pay attention to the immediate structure being presented and WAIT!
We already have confirmation that the price has bounced within our inefficiency zone. Now, we just wait for the breakout, so patience is key!
That’s my advice for this week.
Best regards, and thank you for supporting my analysis.

Gold will make downward movement to support levelHello traders, I want share with you my opinion about Gold. Looking at the chart, we can see how the price trades in the range, where it long time trading near the current support level, which coincided with the support area and top part of the range. After this, the price turned around and made a small movement up, after which rose back to the support area and soon started to decline to the bottom part of the range. When Gold fell to this part, it broke the 2485 level and declined a little below, thereby exiting from the range. Then the price started to an upward channel, where it broke the 2485 level one more time and in a short time rose to the resistance line of the channel and then made a correction to the support line. Next price continued to move up inside the channel and soon reached the 2525 level, after which made small correction to the support line of the channel. After this, Gold made a strong upward impulse, thereby breaking the 2525 level, and later exited from the channel. At the moment, the price continues to move up, so, in my opinion, Gold can make a downward movement to the support level. For this case, I set two TP, first at the 2550 points, and second at the 2525 level. Please share this idea with your friends and click Boost 🚀

Gold can continue to decline to support levelHello traders, I want share with you my opinion about Gold. Observing the chart, we can see that the price some time ago declined to 2157 points, but at once turned around and started to grow inside the upward pennant, where it soon reached the 2280 support level, which coincided with the support area. Soon, Gold broke this level and continued to grow to the resistance line of the pennant, which coincided with the resistance level with the seller zone too, but at once rebounded, after reaching this line, and made a correction movement to support line of the pennant pattern. Next, the price exited from this pattern and fell almost to the support level, where it turned around and started to rise inside the upward channel. In this channel, in a short time rose to a resistance level, and even entered to seller zone, leaving the channel. But a not long time ago Gold turned around and made a strong downward move from the seller zone, making a fake breakout of 2430 level. Now, in my opinion, the price can continue to decline to the 2280 support level, therefore I set my target at this level. Please share this idea with your friends and click Boost 🚀

Euro can reach resistance level and then start to declineHello traders, I want share with you my opinion about Euro. By observing the chart, we can see that the price some days ago rebounded from the support level, which coincided with the support area and started to grow to the resistance level. In a short time price reached the 1.0895 level, which coincided with the seller zone and soon broke it, after which it even rose a little more, but then turned around and started to decline inside the downward channel. In the channel, EUR broke the resistance level one more time and declined to the support area, which coincided with the support line of the channel. But soon, the price turned around and made an upward impulse, thereby making a fake breakout of the support level and later even exiting from the downward channel. After this move, the price declined inside the triangle from the resistance line to the support line, breaking the 1.0735 level. The Euro turned around from the support line of the triangle and in a short time rose to the 1.0735 level and soon broke it again, after which continued to rise to the resistance line of the pattern. Next, the price exited from the triangle pattern and soon reached a resistance level, but recently it rolled down and now the price tried to rise. But in my opinion, it can reach a resistance level and then start to decline. For this reason, I set my target at 1.0800 points. Please share this idea with your friends and click Boost 🚀

British Pound can reach seller zone and then start to declineHello traders, I want share with you my opinion about British Pound. By observing the chart, we can see that the price a not long time ago started to trades inside a downward wedge, where it rebounded from the support line and rose to the resistance line, coinciding with the resistance level with the seller zone. After this move, GBP turned around and in a short time declined to the buyer zone, breaking the support level and soon declined more and reached the support line of the wedge. Then price rebounded from this line and soon exited from the wedge, after which continued to move up inside the upward channel, where GBP soon broke the 1.2450 support level also. After this, the price rose to the resistance line of the channel and then corrected to the support line, after which rebounded and in a short time rose to the resistance level. At the moment, GBP continues to trades near this level and I think that the British Pound can reach the seller zone and then start to decline to support line of upward channel. For this reason, I set my target at 1.2575 points. Please share this idea with your friends and click Boost 🚀

Bitcoin can decline to support line of downward channelHello traders, I want share with you my opinion about Bitcoin. By observing the chart, we can see that the price some days ago entered to range, where it firstly declined to the current resistance level, which coincided with the support area and at once started to grow. In a short time price reached the 71000 resistance level, which coincided with the seller zone and tried to break. BTC failed and made a correction movement, after which in a short time rose back and finally broke the 71000 level, but can't fixed and soon declined back to the current resistance level, breaking the 71000 level one more time. Soon, BTC exited from range and then entered to downward channel, where it first rose to the resistance line, but later declined back to the support line of the channel, breaking the 62000 level. Then price made an impulse from the support line to the resistance line of the channel, after which rolled down to the support area, where now continues to trades near the current resistance level. I think that Bitcoin can continue to decline to support line of the downward channel, therefore I set my target at 55000 points, which coincided with this line. Please share this idea with your friends and click Boost 🚀

Gold Price Update Today: Short-Term Price Increase OutlookThe price of gold surged to nearly $2,320 at the start of Thursday, indicating a slight recovery in the market after previous challenging periods.
However, upon examining the 4-hour chart, it's evident that the potential for price increase remains limited. The Simple Moving Average SMA 20 is trending below the Simple Moving Average SMA 100, signaling unclear direction in the market.
Overall, gold is grappling with continuous challenges and fluctuations. Thorough analysis and monitoring of market news are essential for making sound and effective trading decisions.

Downtrend and Short-Term Bullish Outlook for GoldThe price of gold experienced a modest decline towards the end of Tuesday's trading session in the U.S. after reaching a high of 2,334 USD. During the Asian trading session the following day, XAUUSD continued to drop to 2,323 USD, marking a decrease of 0.11%. Despite the weakening of the U.S. dollar following the release of weaker-than-expected U.S. PMI data, gold prices still couldn't sustain their upward momentum. This could be attributed to expectations regarding the Federal Reserve's potential interest rate cuts.
From a technical standpoint, there are indications that gold may continue to trend downwards. On the 1-hour chart, the downward trend is supported by technical indicators. Gold prices are currently operating between the Simple Moving Averages SMA 20 and SMA 50, signaling short-term bullishness. Anticipated that prices will test the SMA 50 before potentially experiencing further significant declines.

Gold: Downward trend continue to maintain in the near futureGold is facing difficulties in capitalizing on the previous day's gains and is oscillating within a narrow range as it enters the European trading session on Wednesday. Global risk sentiment continues to be supported by reduced concerns over escalating geopolitical tensions in the Middle East. This is attributed to the decline in the US dollar (USD) price, coupled with reinforced expectations from the Federal Reserve.
From a technical perspective, the upward trend remains intact, but gold prices are currently showing signs of correction. It is anticipated that there will be a retracement towards Fibonacci's support level in the near future.

Gold Fluctuations and Upcoming TrendsThe gold market (XAU/USD) is facing strong selling pressure for the second consecutive day, dropping to near its lowest level in over two weeks, hovering around the $2,300 mark before entering the European trading session.
Despite overnight attacks on US forces in the Middle East, investors remain optimistic, believing that the conflict between Iran and Israel will not escalate further. Furthermore, expectations that the Fed may postpone interest rate cuts have reduced demand for the yellow metal.
From a technical perspective, looking at the chart reveals that gold is moving within a narrow range, indicating weak momentum from both sides. It is anticipated that gold will continue to decline as it breaks through this support level, potentially pushing prices even lower.

Market Analysis: Gold Correction Signals Amid Political CalmGold has experienced a significant drop, pushing prices below the $2,340 threshold in Monday's US trading session. The easing of political tensions has provided clear indications that gold is gearing up for a profound adjustment. Additionally, expectations that the Federal Reserve will postpone interest rate cuts amidst stable inflationary conditions have further bolstered the strength of the US dollar, driving capital away from safe-haven assets like precious metals.
From a technical standpoint, the short-term outlook for gold suggests a reversal adjustment as it heads towards the 20-day simple moving average (SMA) before continuing its downward trajectory.

Analyzing Gold Price: Gold's Decline Amid Rising US Bond YieldsIn the European trading session, gold continued to decline to near 2,350 USD after retreating during the Asian session on Monday. This persistent decline is attributed to the increase in US Treasury bond yields. Additionally, the political situation in the Middle East has eased, reducing concerns and the search for safe-haven assets like gold.
Looking at the chart, we can see that the price has broken through the trend line and formed a double top pattern. In the near future, gold prices may continue to undergo further corrections and trend towards a downward direction, especially as technical indicators indicate market weakness.

HelenP. I Ripple can correct to support level and then bounce upHi folks today I'm prepared for you Ripple analytics. A few moments ago price started to decline in a downward channel, where it at once rebounded from the resistance line and in a short time declined to the trend line, which is the support line of the channel too, thereby breaking the 0.6435 resistance level. But later, the price turned around and rose to a resistance zone, after which it rebounded and some time traded below. Then XRP rose to the resistance level again, but at once turned around and in a short time declined to the trend line, which coincided with the support level and zone. Price even made a fake breakout of a downward channel, after which it soon backed up and continued to trades near the 0.4800 support level. Now, I expect that Ripple will make a correction to the support level and then start to move up. For this reason, I set my target at 0.5425 points. If you like my analytics you may support me with your like/comment ❤️

Euro can rebound down from resistance line and continue fallHello traders, I want share with you my opinion about Euro. Looking at the chart, we can see how the price a not long time ago started to rise inside the upward channel, where firstly it declined to the 1.0780 resistance level, which coincided with the seller zone. Soon, the price broke this level and declined to support line of the channel, after which EUR at once rebounded and made an upward impulse to the resistance line of the channel, breaking the 1.0780 level one more time. Next, the price some time traded near, but later Euro turned around and started to decline inside the downward channel, leaving the past channel. In the downward channel, EUR fell to the support level, which coincided with the buyer zone, breaking the 1.0780 resistance level also. After this, the price bounced from the 1.0620 level and tried to rise, but declined to the buyer zone, which a not long time rebounded up to the resistance line of the channel, making a fake breakout. At the moment, I think that the Euro can rebound down from the resistance line, break the support level, and continue to decline in a downward channel. For this reason, I set my target at the 1.0500 level. Please share this idea with your friends and click Boost 🚀

BNBUSDT Downtrend in a ZigZagPrice action has been channeling in a zigzag pattern. Micro bearish impulse downward leg in development. Just pointing out levels to watch.

BNBUSDT Impulse downward scenarioImpulse downward scenario up-to-date. As expected by the last bearish analysis, CZ coin is heading down to fall @ demand zones after a Head and Shoulders breakdown. Pullback to neckline accomplished.

COINBASE/ Downward Zig ZagOur Pattern Piper found a downward zig zag (USD/JPY) to closely resemble Coinbase's downward zig zag. What do you think?

MKRUSD - Consolidation or Downward Move?After around 6 months of hugely profitable trading with MKR we've received a Short signal from Crypto Tipster v2 - looking at the chart there's 2 possibilities from here.
Either we're actually looking at a period of consolidation whereby the price isn'y going to do all that much within the current range until it reaches the end of this wedge in a couple of weeks; or we're going to experience a drop into the trading area below this wedge.
Given how profitable Crypto Tipster v2 has been with MKR recently we're inclined to go for it, 10% on the Short should be acheivable, 20% is also not unlikely!
If you enjoyed or agree with this idea - drop us a comment, like & follow! :)

POLISUSD '2D' - Broken Below the Last Stand!Oh dear - Polis has just broken down through what appears it's last layer of support before a huge 30%+ drop. With a strong Sell signal from Crypto Tipster v2 this could be a great trade to make to start 2023! We'd be aiming for 30% on this but 50% or more is entirely plausible given the recent downward swing.
If you enjoyed or agree with this idea - drop us a comment, like & follow! :)

XAUUSD Short Opportunity - DECEMBER RECAPDescription is within the chart - looking for downward momentum to occur after 1st LH is printed and 30m bearish engulfing candle - if 1813 level is broken - clean traffic to the left to around 1800.
