EURUSD UPDATERE- DISTIBUTION PHASE ????
My trading strategy isn't intended to be used as a signal service. It's a process of gaining knowledge of market structure and improving my trading abilities.
Like and subscribe and happy trading to all
Dowtheory

GBPUSD UPDATERE-DISTIRBUTION ZONE ????
My trading strategy isn't intended to be used as a signal service. It's a process of gaining knowledge of market structure and improving my trading abilities.
Like and subscribe and happy trading to all

GBPUSD WEEKLY TRADE IDEAMy trading strategy isn't intended to be used as a signal service. It's a process of gaining knowledge of market structure and improving my trading abilities.
Like and subscribe and happy trading to all

EURUSD WEEKLY TRADE IDEAMy trading strategy isn't intended to be used as a signal service. It's a process of gaining knowledge of market structure and improving my trading abilities.
Like and subscribe and happy trading to all

3090: TABUK CEMENTBullish Trend (HH, HL)
Retracement from 78.6% fib levels
Take your trades as per fib level targets with trailing stop loss

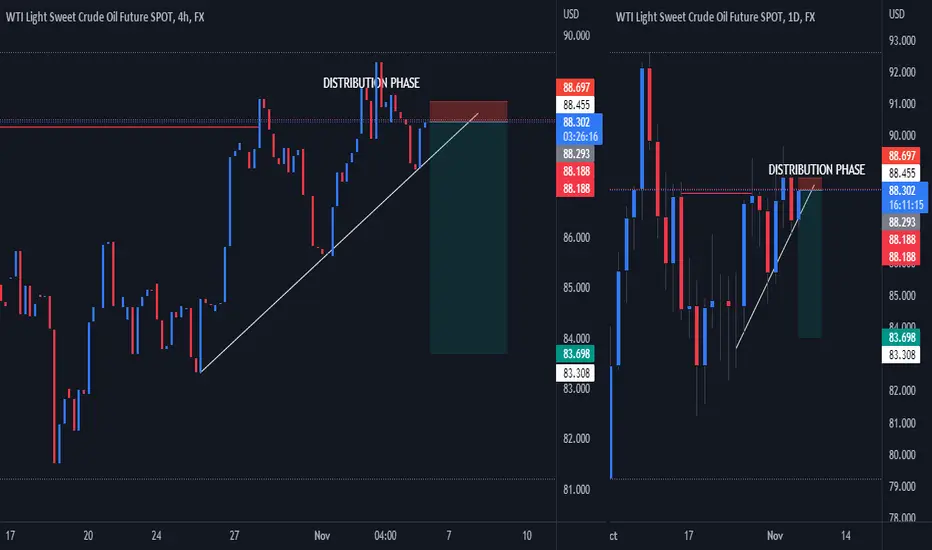
OIL WEEKLY TRADE IDEAMy trading strategy isn't intended to be used as a signal service. It's a process of gaining knowledge of market structure and improving my trading abilities.
Like and subscribe and happy trading to all
$SPX following the main principles of Dow Theory to a TThe key to success! - Understanding market structure!

1212: TASI ASTRA INDUSTRIAL GROUPBreakout is observed,
An aggressive Entry @ current level can be taken
Conservative Entry can be taken after retest (formation of HL)
Cup and Handle Pattern
AB=CD Harmonic Pattern
Ascending Triangle Pattern
Formation of HH, HL, Dow theory Bullish trend
Enjoy the ride
Fib Levels and extensions are mentioned for TPs (Long term targets)
Trail your stop loss accordingly

4191: TASI (LONG)Falling Wedge Breakout
Confirmation of Bullish trend (HH, HL)
Take the trade with stop loss
Ride the trend with trailing stop loss

TASI, 2082: ACWATrendline resistance breakout. (Confirmation of false breakdown)
Setup is ready for long.
1- Series of HH, HL --> Bullish Trend; Dow Theory
2- Above Trendline Support
3- Every time it hits trendline support, it takes upside movement
4- Biased: Bullish
Buy @ current level (164.4)
Buy after retest of trendline (162), confirmation of HL
Tight SL @ 153.25
or previous HL@ 145.4
Targets slightly below fib levels
TP1 @ 180.5
TP2 @ 187.5
or as per RR 1:2, 1:3
Ride the trend with trailing stop loss

DJ30 SHORT IDEAAfter the breakthrough of the support bar, and making LL and LH, the price indicates it will be bearish. There's a high possibility of reaching the crossover with the minor and major pitchfork median line. Stop loss at the recent LH and take profit on the crossover. #idea

SHORT NATURAL GASOngoing trade on natural gas—target price nearest median line parallel. So far now the price has breakout nicely and follows the dow theory.

NZDUSD SHORT ideaThe chart pattern formation (Double Bottom) indicates that it's leading to a short trade. It will likely reach the nearest Major median line and minor bottom median line parallel.

what is the difference between trend lines ?? as u can see here in ethusdt there are four trend lines ( three of it are main ) first of all what is trend line categories :-
1- major trend."primary trend"
2- secondary trend ." intermediate trend"
3- minor trend ." near term trend "
_ ( major trend ) dow theory classifies the major trend as being in affect for longer than ayear and it differs from market to another
as example in the commodity markets major trend is anything over six monthes .
_( secondary trend) dow defined this trend as three weeks to as many monthes and its the same for the futures market.
_(minor trend) this defined as anything less than two or three weeks.
*i hope its short and informative.

ETHUSD LongETHUSD is following the bullish pattern of the Dow theory and is making higher highs and lows. The ascending trendline is also acting as a support and it will probably go bullish from here.

DJT Is BullishDJT, a leading economic indicator, is breaking out of a long falling wedge pattern that targets the all-time high daily candle body closes. This is yet another piece of the puzzle suggesting a much better second half for this year. Bollinger bands squeezing so tight and multi-month divergences are also indicating that it won't be a small move.

Dow Theory Non Confirmation Spells Trouble for BitcoinETHUSD made new highs recently while BTCUSDT faltered.
We should see both prices decline in the coming days and weeks after this reversal signal.
Bearish analysis of Tata consultancy base on Dow theoryAnalysis of bearish Market , Tata Consultancy base on Dow thoeru with Mentioning HL & LL

Which Way ?? of BTCUSD We surely BTC now are downtrend In Timeframe Day but in Timeframe Week still up trend because still upper MA 200 , if we use Dow theory They starting make lower high, Lower low it's may be a Starting of Downtrend in Timeframe week then let see if break down MA200 (or around 25,800) will confirm downtrend in week and the Next level support around 19,500.
#Keep planning

AMD: You should pay attention to these KEY POINTS!Hello traders and investors! My last analysis on AMD was on April 27, but my previous reading was very accurate, as it respected our key points very well (link to my previous analysis below this post, as usual). Now, we must update a few things.
First, in the 1h chart, AMD reversed the trend, as we expected, and even when the volatility increased, it couldn’t lose the blue line at $ 84.24, which was our most important support level (the daily chart will show it better).
Now it seems AMD is doing a pullback to the previous support level around $ 104, which worked as a resistance two times recently, and now it is working as a support. This is the Principle of Polarity in Technical Analysis. Only if it loses this support we would see AMD dropping more. The next support is the black line at $ 99, which is an interesting point that we’ll talk about later.
For now, all we can assume is that since it is a bull trend, AMD will seek higher levels, even considering it’ll do pullbacks along the way. Remember: Trends persist until a clear reversal occurs (Dow Theory).
Remember the $ 84.24, the most important support? Here we see that AMD did a Double Bottom chart pattern just above this price level. In addition to this, if you zoom out, you’ll realize that this support dates back to July 2021. In order to trigger a long-term bear market on AMD, we must lose this line, and this won’t be easy.
For now, AMD is clearly bullish, doing higher highs/lows, heading to the target I mentioned in ym last analysis, when we were below $ 90: The Gap at $ 118. Meanwhile, pullbacks are acceptable, and would be just opportunities to buy. The 21 ema is a good support level to work with in the daily chart, and coincidence or not, it is at $ 99 right now (remember the black line I mentioned in the 1h chart?).
Let’s keep our eyes open, as AMD is near its key points right now. Maybe it’ll give another buy soon, if it reacts near any of its support levels. What could ruin the bullish bias? If it does a clear reversal sign, and if it loses its 21 ema in the daily chart.
I’ll keep you guys updated, so, remember to follow me to keep in touch with my daily analyses!

Transports Break SupportTransportation stocks have been unusually strong this year, but that might have changed yesterday.
The main feature on this chart of the Dow Jones Transportation Average is the September low at 13,947. Prices managed to remain above this level throughout the market’s correction as other indexes like the S&P 500 and Nadaq-100 knifed below the same respective points on their charts. DJT lost that distinction yesterday as it suffered its biggest drop in almost two years.
Second, the index broke out above its 50- and 200-day simple moving averages (SMAs) in mid-March as the broader market rebounded. But then it reversed and made lower highs at both SMAs in April and May.
Third, that price action dragged the 50-day SMA below the 200-day, resulting in a potentially bearish “death cross.”
Given the importance of “Dow Theory,” which uses Transports to judge moves in the broader market, yesterday’s price action could have bigger implications for sentiment. Traders may now view it as confirmation of a bearish trend.
TradeStation has, for decades, advanced the trading industry, providing access to stocks, options, futures and cryptocurrencies. See our Overview for more.
Important Information
TradeStation Securities, Inc., TradeStation Crypto, Inc., and TradeStation Technologies, Inc. are each wholly owned subsidiaries of TradeStation Group, Inc., all operating, and providing products and services, under the TradeStation brand and trademark. You Can Trade, Inc. is also a wholly owned subsidiary of TradeStation Group, Inc., operating under its own brand and trademarks. TradeStation Crypto, Inc. offers to self-directed investors and traders cryptocurrency brokerage services. It is neither licensed with the SEC or the CFTC nor is it a Member of NFA. When applying for, or purchasing, accounts, subscriptions, products, and services, it is important that you know which company you will be dealing with. Please click here for further important information explaining what this means.
This content is for informational and educational purposes only. This is not a recommendation regarding any investment or investment strategy. Any opinions expressed herein are those of the author and do not represent the views or opinions of TradeStation or any of its affiliates.
Investing involves risks. Past performance, whether actual or indicated by historical tests of strategies, is no guarantee of future performance or success. There is a possibility that you may sustain a loss equal to or greater than your entire investment regardless of which asset class you trade (equities, options, futures, or digital assets); therefore, you should not invest or risk money that you cannot afford to lose. Before trading any asset class, first read the relevant risk disclosure statements on the Important Documents page, found here: www.tradestation.com .


Dow Transports saying the crash is yet to comeI have done a 3 prong analysis on the Dow Transports VS the Dow Jones which are indicating a continued move down for the markets in the near future of 1-2 weeks. It could even be a crash.
