XAGUSD - Retracement XAGUSD - After accumulation printed series of higher highs and lower low's. Need to Break last higher to be bullish.
Dowtheory

DOTUSDT-1H-BEARISH TRENDDOTUSDT is making new lower high and lower lows so we are taking instant entry with fibonacci retracement 0.38 where price is got corrected and going bearish
there no clear evidence of bearish diversion

Get ahead of the Game of Crypto with Dow TheoryWelcome to @TradingView , this is @Vestinda! We're excited to share with you our insights on the Dow Jones Theory and how it can benefit cryptocurrency traders.
Dow Theory, also known as Dow Jones Theory, is a trading strategy developed by Charles Dow in the late 1800s.
Charles Dow did not write any books during his lifetime, but he did co-found The Wall Street Journal and the Dow Jones & Company. He also wrote many editorials for The Wall Street Journal. Here is a quote from one of his editorials that is particularly insightful:
"The successful investor is usually an individual who is inherently interested in business problems."
Dow theory continues to dominate and is regarded as one of the most sophisticated contemporary studies on technical analysis even after 100 years.
What exactly is Dow Theory?
Charles H. Dow compared the stock market to the tides of the ocean in the Wall Street Journal on January 31, 1901.
"A person watching the tide come in and wanting to know the exact location of the high tide places a stick in the sand at the points reached by the incoming waves until the stick reaches a position where the waves do not come up to it and finally recedes enough to show that the tide has turned." This method is effective for observing and predicting the flood tide of the stock market."
Dow believed that the current state of the stock market could be used to analyse the current state of the economy.
The stock market can provide valuable measures for understanding the reasons for high and low trends in the economy or individual stocks.
How Does the Dow Theory Work?
The Dow Theory is based on several fundamental tenets, which are outlined below:
1. The Averages Reflect Everything:
The market price takes into account every known or unknown factor that may impact both supply and demand. According to this observation, the market reflects all available information, even information that is not in the public domain. However, natural disasters such as droughts, cyclones, floods, or earthquakes cannot be considered.
Major Geopolitical Events are Already Priced In:
All significant geopolitical events, trade wars, domestic policies, elections, GDP growth, changes in interest rates, earning projections, or expectations are already priced in the market.
Unexpected Events Affect Short-Term Trends:
While unexpected events may occur, they usually only affect short-term trends, and the primary trend remains unaffected.
Overall, the Dow Theory emphasises the importance of analysing the primary trend of the market and understanding that all available information is already reflected in the market price.
2. The Market Has Three Trends:
The primary trend:
It can be as long as one year to several years and is the ‘main movement’ of the market. These movements are typically referred to as bull and bear markets. This primary uptrend is called as bullish on the other hand primary downtrend can be considered as bearish trends.
The reality of the situation is that nobody knows where and when the primary uptrend or downtrend will end.
As you can see in the image above when a stock is moving in primary uptrend it makes new high followed by few lows not lower than the previous lows.
Similarly the same patterns follows when it is in primary downtrend.
The objective of Dow Theory is to utilize what we do know, not to make chaotic guess about what we don’t know. Through a set of guidelines from Dow Theory one can measure to identify the primary trend and stay with it.
The intermediate trend or secondary trend:
This trend can last between 3 weeks to several months. Secondary movements are reactionary in nature, think of them as corrections during bull market, or rallies & recoveries in the bear market.
In a bull market, a secondary trend is considered a correction. In a bear market, secondary trend are called reaction rallies.
So suppose if a stock during its primary uptrend made a high, it will retrace back to some points to make a low (known as intermediate trend or correction).
Likewise during an primary downtrend, a stock can make a high after falling for several months or years(known as bear market rallies).
The minor trend or daily fluctuations:
This trend is least reliable which can be lasting from several days to few hours. Dow theory suggests not to put much attention to these trends. As a Long-term investor it is just the part of corrections in secondary uptrend or downtrend rally.
This are just daily fluctuations happening in market on day to day basis. It constitutes of noise in market and perhaps be subject to manipulation.
Out of the three trends mentioned only primary and secondary trends are trustworthy. However, the study of daily price action can add valuable insight, if you look in context of the larger picture.
So when you are looking for daily price action of several days, or weeks try to evaluate bigger structure getting formed. By putting enough attention one can certainly benefit in short term rallies.
A few pieces of a structure are meaningless, yet at the same time, they are essential to complete the entire picture.
3.Major Trends Have Three Phases:
Dow significantly paid attention to the primary trends (major) in which he spotted three phases. These are Accumulation phase, Public participation phase and Distribution phase.
These phases are cyclic in nature and repeats over the time.
A) Accumulation phase:
This phase occurs when the market is in bearish trend, sentiments are negative with no hope for any upcoming uptrend. For example as we saw in Indian share market a steep low in mid cap stocks, making new lows every other day.
Most of the investors see them stay in this trend for unknown time period. However, this is the time when big investors, huge fund houses, institutional investors start accumulating them gradually.
This is known as smart money keeping their view for long term investment. Although you would see sellers in market still selling, they find the buyers easily.
B) Public participation phase:
At this phase the market have already absorbed the negativity with ‘smart money’ getting invested. This is the second stage of a primary bull market and is usually sees the largest advance in prices.
During this phase majority of public(retailers) also thinks to join in as the price is rapidly advancing. However most of them are left behind due to speed in rallies as well as the averages start heading higher.
If you are also a trader or investor you might have this experience and a regret of not able to participate with rally. It is a period followed by improved business conditions and increased valuations in stocks.
C) Distribution phase:
The third stage is the excess phase which eventually be turned to distribution phase. During the third and final stage, the public (retailers) gets fully involved in the market, as they get mesmerized by the bull market rally.
Some of them who felt left will still try to look for valuations and want to be part of the rally.
But this is the time when ‘smart money’ starts liquidating shares on every high. Whereas public will try to buy at this level absorbing all liquidating (sell-off) volumes made by big investors.
On contrary in the distribution phase, whenever the prices attempt to go higher, the smart money off loads their holdings.
This is the beginning of bear market, where sentiments will start turning negative, you will see more and more companies filing bankruptcy, change in economic growth etc.
During bear market the level of frustration rises among retail investors as they start loosing all hopes.
4.The Averages Must Confirm Each Other:
Dow used to say that unless both Industrial and Rail(transportation) Averages exceed a previous peak, there is no confirmation or continuation of a bull market.
Both the averages did not have to move simultaneously, but the quicker one followed another – the stronger the confirmation.
To put it differently, observe the image above, as you can see both the averages are in bull market, trending upward from Point A to C.
5. Volume Must Confirm the Trend:
Volume is a tool to know how many shares have been bought and sold in a given period of time. It helps in analysing the trends and patterns.
Now according to Dow theory, a stock must be in uptrend with high volume and low in corrections.
Volumes may not be an attractive piece of information but you should try to combine the volume data with resistance and support levels to get a clear picture.
6. Trend Is expected to Be Continued Until Definite Signals of Its Reversal:
Quite similar to Newton’s first law of motion which states that an object will remain at rest or in uniform motion in a straight line unless acted upon by an external force.
In simple words an object will remain in their state of motion unless a external force acts to change the motion.
Likewise, the market will continue to move in a primary direction until a force, such as a change in business conditions, is strong enough to change the direction of this primary move. You can also see the signals for reversals when a trend is about to change.
7.Signals and Identification of Trends:
One of the major challenges faced while implementing Dow theory is the accurate identification of trend reversals. Remember, if you are following the dow theory one should be not only looking for overall market direction, but also the definite reversal signals.
One of the main skill used to identify trend reversals in Dow theory is peak and trough or high and low analysis. A peak is defined as the highest price of a market movement, while a trough is seen as the lowest price of a market movement.
Dow theory suggests that the market doesn’t move in a straight line but from highs (peaks) to lows (troughs), with the overall moves of the market trending in a direction.
An upward trend in Dow theory is a series of successively higher peaks and higher troughs. A downward trend is a series of successively lower peaks and lower troughs.
8. Manipulation In the Market:
According to Charles dow the manipulation of the primary trend is not possible. where as Intraday, or day to day trading and perhaps even the secondary movements could be vulnerable to manipulation.
These short movements, from a few hours to a few weeks, could be subject to manipulation by large institutions, speculators, breaking news or rumors.
There is possibility that speculators, specialists or anyone else involved in the markets could manipulate the prices in short run.
Individual shares could be manipulated for example the security rise up and then falls back and continues the primary trend. With this in mind one need to be aware of the situations while trading and investing.
However, it would be next to impossible to manipulate the market as a whole. The market is simply too big for any kind of manipulation to occur.
Why Dow Theory Is Not Infallible?
Dow Theory is not a sure-fire means of beating the market hence it is not something which is infallible or fault-less. Some of the criticism received about Dow Theory is that it is really not a theory.
Charles Dow's principles and theories, while developed for the stock market, can still be applied to crypto investing.
Here are a few ways his knowledge can be used:
Follow the trend: Dow's first principle is that the market moves in trends. In crypto investing, you can identify trends by looking at price charts and technical analysis. If the price of a particular cryptocurrency is in an uptrend, it may be a good time to consider buying. If it's in a downtrend, you may want to consider selling or waiting for a better entry point.
Consider market breadth: Dow's second principle is that the market's movements should be confirmed by market breadth. This means looking beyond just the price of one cryptocurrency and examining the overall health of the market. For example, if a particular cryptocurrency is in an uptrend but the majority of other cryptocurrencies are in a downtrend, it may not be a sustainable trend.
Use volume as a confirmation: Dow's third principle is that volume should confirm the trend. In crypto investing, volume can provide insight into the strength of a trend. For example, if the price of a cryptocurrency is increasing with high volume, it may indicate a strong uptrend. On the other hand, if the price is increasing with low volume, it may not be a sustainable trend.
Be aware of market cycles: Dow's fourth principle is that the market moves in cycles. This means that there will be periods of growth and periods of decline. In crypto investing, it's important to be aware of these cycles and adjust your strategy accordingly. For example, during a bull market, you may want to focus on buying and holding, while during a bear market, you may want to consider shorting or staying on the sidelines.
Overall, while the crypto market is different from the stock market, many of Dow's principles can still be applied to crypto investing to help you make more informed decisions.
In conclusion, Dow Theory, developed by Charles Dow in the late 1800s, remains one of the most respected theories in financial market history.
The theory's primary tenets are based on the idea that the stock market reflects all available information, and there are three trends in the market: primary, intermediate, and minor.
The primary trend is the most important and can last several years, while the intermediate trend and minor trend are reactionary in nature.
Dow Theory provides an excellent framework for traders and investors to evaluate the current state of the economy, and it has remained relevant even after 100 years. Whether you are an intraday trader, a short-term trader, or a long-term investor, the knowledge of Dow Theory will undoubtedly help you develop various strategies for your investments.
So, in conclusion, Dow Theory is a respectful theory that has stood the test of time and continues to be an essential tool for anyone who trades or invests in the financial and crypto market.
Unleash Your Inner Trader — Read Story About Bulls and Bears That Will Change Your Mindset!
Hey there, our lovely friends! 😊 If you enjoyed reading this, please hit the "like" button 👍 and share it on your social media and groups. By doing so, more people can discover this interesting information, and we'll be encouraged to create even more awesome content for you! ♥️

FOMC - MARCH 22, 2023 -US30 DOW JONES INDUSTRIAL AVERAGE Hello Traders,
As we approach FOMC and rate decision today, 2pm March 22, 2023
there's a possibility of continued rate hike to curb inflation and that could
send Stock Markets down.
Key Points:
VIX - Volatility Index is bullish for the week
Commodities - Bearish for the week
A rate increase is favourable for USD from an Investor's perspective. Overall economic outlook is bearish considering global world issues i.e: Russia/Ukraine, recession, inflation, etc.
Chart analysis shows clear picture based on trend lines, BOC, CHOC, and imbalance areas from prior week.
Anyways, always trade what you are comfortable with losing.
Until next time!
The Trading Regime.

MATIC Will be bullish soonDefined the order block between the range of 1.5-1.8.
RSI is also near the oversold region
The trend is decreasing and the volume is not increasing. So it means the seller will not be more interested in the long way. So the market will be pumped soon
Let's see what happens


1InchusdtAssalamualikum friends i hop every is good.
so over all marekt is bearish in a da timeframe but
in a 4 hours or 1 hours market is bullish so you can take a trade as a day trader
GOOD Luck :)

ATOMUSTassalamu alaikum Friends the market is bullish from last 15 days and follow the dow theory and create higher high bullish trent
and here market create also some bullish candle stick like engulfing candle.
and stop loss is previous low

A silver lining amongst all the negativity A relative comparison between the DJI, JNK & DJT is showing some underlying strength building in the market. This is also known as a "risk on" sentiment and that's when high risk assets do very well

Key levels for ANT/USDT if it keeps going upThese key levels have been identified on the weekly timeframe (ichimoku levels) and the next level is a the next higher high in the past.

XAUUSD LONGTaking long Position
making H and HL
Trend in bullish
S&R with great significance
No Divergence

Basics : Silver Daily Timeframe TVC:SILVER
By applying #Dow theory, following observations are noted
Downtrend : From Mar22 till Aug22; almost 34% profit if short position is considered.
Uptrend : From Sep22 till date; almost 32% profit if long position is considered.

Basics : Gold Daily Timeframe TVC:GOLD
Applying #Dowtheory, downward trend is observed from Mar22 till first week of Nov22.
A series of noticeable LLs & LHs identified.

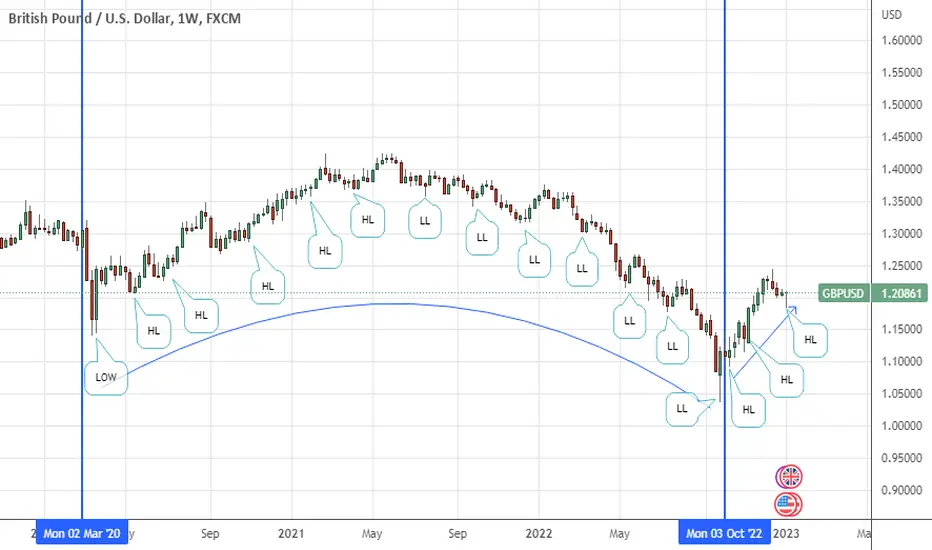
Basics : GBPUSD Weekly Timeframe FX:GBPUSD
By applying Dow theory, series of LLs identified in a downtrend arc.
Basics : EURGBP Weekly Timeframe FX:EURGBP
Using Dow theory, series of LLs, HLs & HHs identified on EURGBP Weekly Timeframe.

Basic : EURUSD Daily TimeframeFX:EURUSD
Using Dow theory, EURUSD made last low at 0.95398 ending downtrend on 28.Sep.22; after which continuous higher lows formed.
latest higher high was made at 15.12.2022, after which, higher low is formed in Jan22.

Basic : Euro Index Weekly TimeframeEURO INDEX
Dow Analysis of Euro Index suggests that it has broken down previous downtrend structure.
Made a low of 95.68 in Sep22, successive higher lows have been made at 102 & 105.

Basic : DXY Weekly Timeframe Dow TheoryTVC:DXY
Weekly analysis of US Dollar Index suggests that lower low of 103 down from 114.8, clearly suggesting downtrend.

Basics : Ethereum Weekly Timeframe BINANCE:ETHUSDT
Weekly analysis of BINANCE:ETHUSDT observed a low, 880, has been made in Jun22.
In Nov22, a higher low has been formed at 1072.
With current formation, no new lower low has been made by BINANCE:ETHUSDT suggesting another higher low after it crosses 1300.

Basic : BTC Daily TimeframeBITSTAMP:BTCUSD
Applied Dow Theory, Downtrend is observed since 27.Mar.22.
Made a high of 48,234, since then, continuously making LLs.
Latest LL of 15,766 in Nov22, after lackluster movement is shown in BITSTAMP:BTCUSD

Basics : Amazon Daily Timeframe NASDAQ:AMZN
Applied Dow Theory, LHs & LLs
Staring from Aug22, NASDAQ:AMZN made a high of 146.58, since then continuously making
lower highs and lower lows till 81.7

XUADUSD LONG POSITIONTrend is Bullish and we know Dow theory is the backbone of trading. Took long position at 2% risk reward hope we will achieve our goal. Finger Crossed
