Double Top or… Bearish Dragon?Hello, Traders!
An anatomy of market psychology on the BTC chart…
Sometimes it’s not about what’s next, but what we've already lived through. And this stretch on the Bitcoin (BTC) weekly chart (2021–2022) deserves a second look. What first appears to be a textbook Double Top might, with the right lens, reveal something more… mythical. Let’s break it down 👇
🔍 Double Top: The Obvious Story?
If you zoom in on BTC’s two major peaks — around $64K in April 2021 and $69K in November 2021 — it checks all the boxes: two high points, a clear support line around $30–32K (neckline), and eventually a breakdown that confirmed the pattern. Classic reversal, right? Yes — until you realize it wasn’t just flat repetition, but a structure with more texture and rhythm. This is where the concept of the bearish dragon pattern comes in.
🐉 The Bearish Dragon Trading Pattern
While not part of traditional TA textbooks, the dragon pattern trading model has gained popularity for its ability to capture more nuanced market psychology. In the bearish dragon trading pattern, we get:
Head → The First Push Upward (early 2021)
Left Foot → The First Top
Hump → A Sharp Correction that Builds Tension
Right Foot → A Second, Higher Top (bait for breakout traders)
Entry → The Moment Price Loses Trendline Support
Tail → The Dramatic Drop That Completes the Structure
In this example, BTC followed that script frighteningly well. And while this wasn’t a bullish dragon pattern trading setup (the bullish version mirrors this shape), it still serves as a valuable case study in how these visual patterns capture trader behavior in real time.
⚙️ So What?
Identifying a dragon trading pattern isn't just for artistic flair. These kinds of models reflect moments of emotional whiplash: fake-outs, fear, FOMO — all in one motion. This chart is a masterclass in how structure, sentiment, and supply zones align. And guess what? Even though this pattern completed long ago, some of the zones still matter today — as support, as resistance. Price memory is real. And dragons? Well, they leave footprints. ;)
📉 The Classic: Is It Just a Double Top?
Let’s start with the obvious interpretation. What we see on the BTC chart between April and November 2021 checks almost every box of the well-known Double Top — one of the most cited reversal patterns in technical analysis. It’s the kind of formation you’ll find in every trading textbook: two peaks at roughly the same level, separated by a mid-point correction (the "valley"), followed by a breakdown. And in theory, here’s how it plays out.
The first peak, in this case, around $64,000 in April 2021 shows strength, momentum, and enthusiasm. Then comes a pullback which, at first, looks like a healthy correction. Price drops to around $30,000, consolidates, and many consider it a buying opportunity. The second peak, in November 2021, climbs even slightly higher to around $69,000, but this is where things start to feel different. Momentum is weaker. Volume thins out. Retail interest is still there, but it’s more cautious. The hype feels forced.
And then the real turning point. The market loses its footing around $30–32K. That level, which previously acted as strong support, gets broken in early 2022. Not just tested, broken cleanly.
From a purely technical standpoint, that’s the moment the pattern is confirmed. A classic neckline break and with it, the implication that the uptrend is over, and a deeper reversal is underway. In traditional TA, this would be the textbook entry for a short trade, with a target roughly equal to the height from the peaks to the neckline. For BTC, that implied a drop well into the teens. And that’s exactly what happened.
So is this just a clean Double Top and nothing more? Maybe. The pattern fits. The breakdown was real. The projection played out.
What Do You See?
Yeah, this move is behind us, but sometimes it's worth going back to the dragons of the past. Do you see a clean Double Top here or a full-blown Bearish Dragon ready to bite? 🐲 And have you ever used the dragon pattern trading or dragon trading pattern concept in your analysis? Let’s talk patterns in the comments 👇
Dragonpattern

XRP is exhibiting a nice Reverse Dragon Pattern on the Daily.XRP has been doing its best impression of a yo-yo for quite some time now, but as you can see, XRP is also now showing a nice Reverse Dragon Pattern on the daily chart, which has the potential to be extremely bullish in the short to mid term.
The Dragon’s head is now forming on the daily chart, just above the upper trendline and, as I’ve discussed with my followers, has the potential for a strong bullish move upward—followed by a liquidation candle in the general area of the Weak Doji/Reverse Waterfall line—then a continuation move upward, likely back into the $3+ range over the course of the next couple of weeks in the month of May.
Good luck, and always use a stop loss when trading.

BTC (1D) HEAD & SHOULDERS, DBL BOTTOM, DRAGON PATTERN!!!!!!!January 15, 2025 - Analyzing the 1D Bitcoin chart. We've got several patterns playing out . Let's review them 1 by 1.

GBPUSD🗝️ LEVELS TO WATCH 👀AND WHY🤔🐲Hello Awesome Traders!
I trust you're having a fantastic trading week so far. Let's dive into an exciting opportunity presented by GBPUSD on its 1-hour chart. This setup is worth exploring as it offers potential for profitable trades.
GBPUSD has formed a double bottom pattern around the 1.2529 level, with striking similarities between the first and second bottoms.
Examining the CD leg, we observe two sets of equal downward swings, indicating symmetry in length. This setup is conducive to buying low and selling high, offering opportunities for traders.
For pattern enthusiasts, there are two notable formations: a flat AB=CD pattern and a dragon pattern. These patterns provide additional confluence and increase the setup's reliability.
I've drawn a trendline marked as 'E,' which the price should ideally break with a surge in volume to confirm market participation.
Targets:
For intraday traders, consider targeting the 62% Fibonacci retracement level of the AD leg at 1.25944.
Another target to watch for, especially for those eyeing the dragon pattern, is the 78% Fibonacci retracement level of the AD leg at 1.26125, which aligns with the 127% extension of the CD leg.
Trading Strategy:
Swing traders can monitor the chart over the next few days for potential long opportunities.
Keep an eye on price action and volume dynamics for confirmation before entering trades.
Set appropriate stop-loss orders to manage risk effectively.
For intraday trades, consider taking partial profits at key Fibonacci levels to lock in gains.
Happy trading, and may the pips be with you!

SPCE DragonCould be an early reversal here on $NYSE:SPCE. A spicy dragon pattern has formed and currently attempting a backtest of the spine. This one has been a big pumper in the past, so I am cautiously optimistic for now.
I'd expect a LL if it loses this supply line. Proceed with caution.

Would you look at that. Well, well, well...
Would you look at that.
Just look at it.
Have we seen this pattern before?
Our old friend, Mr. Dragon, has returned and... What's this!?
The big guy is carrying a smole bebe dragon. How cute. So maybe it's a Mrs. Dragon??
This type of dragon bottom can be v powerful with these meme stocks, definitely something worth watching. NYSE:AMC has been obliterated since the stock split, but it's smelling like reversal time and the previews have already started rolling.
AMC has been a big pumper in the past, so we could see a nice squeeze to the upside.
It's not weird to see these dragon bottoms run all the way up to the extreme 4.286 fib extension, especially with meme stocks.
Look how the 4.286 is lining up with the 200 MA (thin, squiggly, blue line). And don't forget to mind the gap up there (gold circle). It should get filled in time.
And if you think I'm crazy, CGC did something similar just a few weeks ago.
*Mwah*. Beautiful.
Still waiting on some big, green boi energy to give more confidence to the idea, but one could buy now, set a SL below the dragon legs, and let it ride.
Grab your popcorn and enjoy the show. :)

📈 LIT/USDT: Dragon Pattern Break to the Golden Mean Ratio ~$4 Welcome, traders! We've got an exciting chart setup on the LIT/USDT pair. The dragon pattern is in play, hinting at a potential breakout targeting the golden mean ratio around $4. Let's dive into the details:
Chart Analysis:
Pair: LIT/USDT
Timeframe: Monthly
Key Observations:
Dragon Pattern: The LIT/USDT chart is forming a dragon pattern, which is known for its potential reversal and trend continuation characteristics. 🐉
Golden Mean Ratio: The breakout target aligns with the golden mean ratio, a significant Fibonacci level often used in technical analysis. 📊✨
Ascending Trendline: The price has been following a robust ascending trendline, indicating bullish momentum. 📈📈
Trading Plan:
Entry: Consider entering a long position upon a confirmed breakout above the dragon pattern's upper boundary, preferably accompanied by a volume surge. 🚀📊
Stop Loss: Place a stop loss just below the dragon pattern's lower boundary to manage risk effectively. 🛡️⛔
Take Profit Target: Aim for the golden mean ratio at approximately $4. This level could act as resistance, so consider taking some profits here. 💰🎯
Risk Management:
Trading cryptocurrencies carries inherent risks, and it's essential to manage your risk carefully. Don't risk more than you can afford to lose, and consider using stop-loss orders to protect your capital.
Disclaimer: This is not financial advice. Always conduct your research and consider consulting with a financial advisor before making any trading decisions.
Keep a close eye on LIT/USDT as it approaches the dragon pattern's breakout point. A move towards the golden mean ratio around $4 could provide an excellent trading opportunity. Happy trading, and may the markets be in your favor! 🚀💹
Note: TradingView posts are for educational and informational purposes only. Remember to perform your research and use proper risk management when trading cryptocurrencies. 📚🔍

Neo - Fractal Double Bottom Pattern 📈Déjà Vu: A Tale of Double Bottom Resonance
Neo, much like Bitcoin and other digital assets, knows how to repeat history. In 2020, it showcased a double bottom pattern, and its evolution bears a striking resemblance to what we are witnessing today.
The Setup: An Intricate Dance of Market Forces
A double bottom pattern is no mere coincidence; it often involves market manipulation. The first leg of the pattern involves a substantial drop, catching many off guard. Then, as if by design, a lower low lures in more traders.
The Thrilling Twist: A Prelude to Growth
While the lower low may instill doubt, it's a setup for a dramatic turnaround. Just as in 2020, when Neo finally started its ascent, this pattern could serve as a prelude to a new bullish cycle.
Trading Perspective: Learning from Neo's Echo
Crypto traders can glean valuable insights from Neo's historical performance. Identifying patterns like these can better prepare them to navigate market fluctuations and seize opportunities.
Conclusion: A Pattern with Purpose
History has a way of echoing in the cryptocurrency realm. Neo's 2020 journey teaches us the value of recognizing patterns like the double bottom, shedding light on possible trends on the horizon.
📉 Double Bottom Patterns | 📊 Market Manipulation | 🚀 Bullish Cycles | 🧭 Trading Insights
❗See related ideas below❗
Feel free to share your thoughts in the comments! 💚📈💚

QTUM's Bullish 🐉Dragon🐉 Pattern 🚀In the realm of cryptocurrency, patterns often reveal the hidden narratives of price action. Today, we dive into the fascinating world of QTUM, where a remarkable pattern is unfolding - the Dragon. This pattern, akin to a double bottom but featuring a lower low, signifies a reversal with potential bullish undertones.
The Dragon Emerges: A Distinctive Pattern
The Dragon pattern is a technical formation recognized by traders for its potent reversal signals.
It shares similarities with the double bottom but offers a unique twist with a lower low.
The pattern typically comprises two lows, separated by a peak known as the 'head.'
QTUM's journey showcases the emergence of this pattern, signifying a potential trend reversal.
The Mechanics: Breaking Down the Dragon
The first low of the Dragon represents a substantial price drop, often driven by market sentiment.
Following this, a rally occurs, forming the 'head' of the Dragon, as traders regain confidence.
The second low creates the 'tail' of the Dragon, often dipping below the first low but not significantly.
The pattern's completion typically signifies a transition from a bearish trend to a bullish one.
The Dragon's Roar: Bullish Potential
The Dragon pattern is perceived as a powerful bullish signal by traders.
Its formation indicates a shift in sentiment, potentially leading to an upward trend.
QTUM's embrace of this pattern suggests an exciting opportunity for traders and investors.
Conclusion: Seizing the Dragon's Potential
As QTUM unfolds the Dragon pattern, traders and enthusiasts have the chance to explore this intriguing setup. Recognizing the mechanics of the pattern and understanding its significance can empower traders to make informed decisions.
While the crypto market remains dynamic and unpredictable, decoding patterns like the Dragon can be a valuable tool. Remember to employ sound risk management practices, stay informed, and be part of the thriving crypto community.
See related ideas below❗
Feel free to like, share, and leave your thoughts in the comments. 💚🚀💚

MVIS Springback TestCurrently retesting lows for the 3rd time and showing bullish divergence. Nearing earrings and a breakout point, fib targets on chart.

SHORT TO LONG TO SHORT :) A nice example of connecting patterns on different sized candles
On the 4H candles we can observe a triangle, after breaking through which we started to form a falling wedge on a smaller timeframe (15m). While the wedge was broken, a lesser-known dragon pattern was formed (I'm just starting to study it .. thanks to @sylviasylvia .. ) whose last target is located on the retest of the triangle, where there should be a second chance to enter the short .. BINANCE:1INCHUSDT

TU | Wave Projection | Bullish Dragon Pattern +25%Price action and chart pattern trading setup:
> A bullish dragon pattern with an uptrend ABC wave currently making a pullback to the rising channel support at the volume profile point of control
> The price is below key dynamic support SMA200 and SMA50 which is considered a downtrend movement or could just be a false break dump and pump
> Entry @ SMA50 and SMA200 breakout zone once the price recovered
> Stoploss @ B wave position -7% downside
> Target @ 1- 1.618 extension dragon head & shoulder zone
Always trade with affordable risk and respect your stoploss

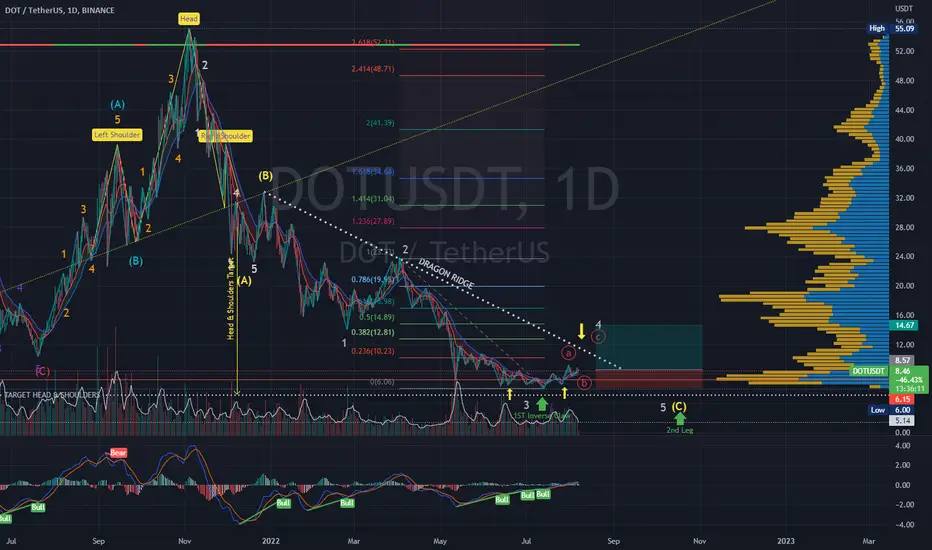
DOTUSDT | Wave Projection | Triple Bullish Divergence DragonPrice action and chart pattern trading
> Anticipating a breakout of dragon ridge or descending triangle breakout downtrend DRAGON ABC wave pattern with current Intermediate C-wave in zigzag formation
> Target @ possible making a minor 4-wave uptrend correction retracing 0.0382-0.5 previous 3-wave +50% - +70%
> Stoploss @ the lowest position of the -25 - 30% to the bottom forming the 1st claw of the dragon, relatively closed to the target of dragon main head & shoulders.
> Entry @ 1st Inverse Claw breakout
> RRR: 2.5:1
Indicator: MACD triple bullish divergence & RSI double divergence
Always trade with affordable risk and respect your stoploss
Reliance IndustriesHello and welcome to this analysis
After a sharp down move last week which might have ended its sideways corrective, Reliance is now attempting a double bottom in lower time frame, suggesting 2475 and 2575 as possible upside levels as long as its above 2470

Bearish DragonXD H4 (XABCD)Open - 1.66213
TP1 - 1.62321
TP2 - 1.58859
TP3 - 1.51149
SL - 1.68360
Please note that my setups are not signals to trade but my own personal analysis and predicted direction. To enter a trade it must be validated by multiple different indicators and confluence factors.

BBGI | Wave Projection Dragon Pattern - Bullish divergencePrice action and chart pattern trading setup
> An impulse downtrend Elliott Wave channel with a dragon pattern forming rear legs
> possible upcoming bullish divergence signal at the next support 8.00 baht targeting 2.618 extension
> Entry @ dragon ridge breakout
> Short term target @ previous wave 4 position
> Medium term target @ wave 1 and wave 2 position + 15 - 20% upside
> RRR: 2:1 for short term and 3:1 for medium term trade
Always trade with affordable risk and respect your stoploss

BTC log dragonWaiting for wave 5 inside a "bullish" falling wedge.
"Resistance" looks like "support" now.
We could "fall lower" to 61k but we seem to be forming a "higher low".
Important support/resistance 61k , 41.3k , 36.6k, 29.2k
I've added two channels from recent price action.
In case of breakout from the wedge the first stop could be the "top" of the channel at first "resistance" 41.3k, x marks the spot.

AUDJPY BEARISH DRAGON PATTERN AUDJPY has formed a dragon bearish pattern on its hourly chart.
The price is trading the wall @ 93.198
with possible targets projection to TP1 92.025 1272% BC
TP2 91.525 1618% BC
AUDJPY DRAGON BEARISH PATTERN
WALL 93.198
💼EL 93.528
⚠️SL 93.795
🎯TP1 92.025 1272% BC
🎯TP2 91.525 1618% BC

KC1! Coffee Futures Coffee Futures
Held onto the $220 support area , sprung and broke that supply line creating the dragon pattern and maturing into a bearish bat harmonic which has a PCZ of $254

Bearish dragon into a 1 hour bullish GartleyStart of a breakdown from a bearish dragon, into the BAMM move of the bullish 1 hour gartley

KTC | Symmetrical Triangle Squeezed Breakout Trading SetupPrice action and chart pattern trading setup
> symmetrical triangle with squeezed accumulation in the upper zone
> Possible upcoming breakout for medium-term uptrend during Thailand re-opening and rising interest rate
> Target 0.5 and 0.786 retracement zone
> Stop zone at 2nd lowest point of triangle zone for medium-term and the lowest point of triangle for long term trade
> Risk Reward Ratio: 2:1 for medium-term and 3:1 for long term trade
Always trade with affordable risk and respect your stoploss

GPSC | Possible Bullish Dragon Harmonic PatternPrice action and chart pattern trading setup
> possible upcoming bullish dragon harmonic pattern
> recommended entry at falling wedge breakout
> 1st target at 0.618 Fibonacci retracement at dragon hump zone near volume profile key resistance
> 2nd target at dragon head zone for medium term trading
> 3rd runtrend for dragon tailswing above 1.0.
> stoploss at dragon front feet near the lowest candlestick
> risk reward ratio 3:1 for medium-term trade
Indicator:
> bullish RSI above MA line approaching 50 for a strong uptrend signal
> MACD golden crossed signal line just below baseline 0 - improving in momentum
always trade with affordable risk and respect your stoploss

JR | Bullish Dragon Triangle Pattern - Double Claws BreakoutPrice action and chart pattern trading setup
> Bullish dragon pattern symmetrical triangle
> double claws bottom strong bullish candle breakout above SMA 20 and SMA 50
> short term target at dragon tailhook resistance of the triangle 0.5 retracement and dragon hump 0.618
> medium term target at dragon head 1.0
> long term target at tail extended zone 1.618
> stop loss at the double claws zone
> risk reward ratio 2:1 for short term, 3:1 for medium term trade
Indicator:
> bullish RSI crossed above MA line over 60
> MACD golden crossed signal line just below the baseline - early trend
Always trade with affordable risk and respect your stoploss
