$XELA is gonna fall todayPupm&Dump trading strategy idea.
$XELA is rising too much today.
The demand for shares of the company looks lower than the supply.
This and other conditions can cause a fall in the share price today.
So I opened a short position from $3,87;
stop-loss — $3,89;
take-profit — $3,52.
Do not view this idea as a recommendation for trading or investing. It is published only to introduce my own vision.
Always do your own analysis before making deals. When you use any materials, do not rely on blind trust.
You should remember that isolated deals do not give systematic profit, so trade/invest using a developed strategy.
If you like my content, you can subscribe to the news and receive my fresh ideas.
Thanks for being with me!
Dump

Can we finally move on?Although the left is on a more clear uptrend than the current, the fractal has a very similar price action amongst other things.
Bitcoin is more than likely early to the proper euphoric bull market cycle, and perhaps this is the fractal that helps illustrate that timeframe
MACD was starting to turn around, but perhaps there's one more dip that plays out similar to July of 2017. When you zoom into that month, and you zoom out of our current month, things start to look kinda familiar...and so does the data beneath it all...which is even more validating.
Still long since day trading isn't my thing & HODLing is.

GBTC Effect will make BTC DUMP?!I think btc will go to 27k-24k (The worst scenario is 24K). If you ask me why, my answer is "this is a drama from the big man".
Its probably TRUE, and its probrably WRONG too. So please DWYOR. NFA

$MTSL is gonna fall todayPupm&Dump trading strategy idea.
$MTSL is rising too much today.
The demand for shares of the company looks lower than the supply.
This and other conditions can cause a fall in the share price today.
So I opened a short position from $6,05;
stop-loss — $6,70;
take-profit — $4,76.
Do not view this idea as a recommendation for trading or investing. It is published only to introduce my own vision.
Always do your own analysis before making deals. When you use any materials, do not rely on blind trust.
You should remember that isolated deals do not give systematic profit, so trade/invest using a developed strategy.
If you like my content, you can subscribe to the news and receive my fresh ideas.
Thanks for being with me!

$XELA is gonna fall todayPupm&Dump trading strategy idea.
$XELA is rising too much today.
The demand for shares of the company looks lower than the supply.
This and other conditions can cause a fall in the share price today.
So I opened a short position from $3,13;
stop-loss — $3,23;
take-profit — $2,93.
Do not view this idea as a recommendation for trading or investing. It is published only to introduce my own vision.
Always do your own analysis before making deals. When you use any materials, do not rely on blind trust.
You should remember that isolated deals do not give systematic profit, so trade/invest using a developed strategy.
If you like my content, you can subscribe to the news and receive my fresh ideas.
Thanks for being with me!
$ATNF is gonna fall todayPupm&Dump trading strategy idea.
$ATNF is rising too much today.
The demand for shares of the company looks lower than the supply.
This and other conditions can cause a fall in the share price today.
So I opened a short position from $11,28;
stop-loss — $12,00;
take-profit — $9,86.
Do not view this idea as a recommendation for trading or investing. It is published only to introduce my own vision.
Always do your own analysis before making deals. When you use any materials, do not rely on blind trust.
You should remember that isolated deals do not give systematic profit, so trade/invest using a developed strategy.
If you like my content, you can subscribe to the news and receive my fresh ideas.
Thanks for being with me!

BTC can follow historical price actionhere i am showing you bitcoin's historical price action after every bull run.. if BTC follows similar pattern like 2013 & 2017 bull run our bottom can be $16000 to $13000 after smaller dead cat bounce by which we can retest around $40000 range.

$ASTS is gonna fall todayPupm&Dump trading strategy idea.
$ASTS is rising too much today.
The demand for shares of the company looks lower than the supply.
This and other conditions can cause a fall in the share price today.
So I opened a short position from $13,86;
stop-loss — $14,29;
take-profit — $13,02.
Do not view this idea as a recommendation for trading or investing. It is published only to introduce my own vision.
Always do your own analysis before making deals. When you use any materials, do not rely on blind trust.
You should remember that isolated deals do not give systematic profit, so trade/invest using a developed strategy.
If you like my content, you can subscribe to the news and receive my fresh ideas.
Thanks for being with me!

$SPCE is gonna fall todayPupm&Dump trading strategy idea.
$SPCE is rising too much today.
The demand for shares of the company looks lower than the supply.
This and other conditions can cause a fall in the share price today.
So I opened a short position from $53,48;
stop-loss — $55,62;
take-profit — $49,22.
Do not view this idea as a recommendation for trading or investing. It is published only to introduce my own vision.
Always do your own analysis before making deals. When you use any materials, do not rely on blind trust.
You should remember that isolated deals do not give systematic profit, so trade/invest using a developed strategy.
If you like my content, you can subscribe to the news and receive my fresh ideas.
Thanks for being with me!

$RSLS is gonna fall todayPupm&Dump trading strategy idea.
$RSLS is rising too much today.
The demand for shares of the company looks lower than the supply.
This and other conditions can cause a fall in the share price today.
So I opened a short position from $5,04;
stop-loss — $5,21;
take-profit — $4,72.
Do not view this idea as a recommendation for trading or investing. It is published only to introduce my own vision.
Always do your own analysis before making deals. When you use any materials, do not rely on blind trust.
You should remember that isolated deals do not give systematic profit, so trade/invest using a developed strategy.
If you like my content, you can subscribe to the news and receive my fresh ideas.
Thanks for being with me!

$CETX is gonna fall todayPupm&Dump trading strategy idea.
$CETX is rising too much today.
The demand for shares of the company looks lower than the supply.
This and other conditions can cause a fall in the share price today.
So I opened a short position from $1,96;
stop-loss — $2,19;
take-profit — $1,52.
Do not view this idea as a recommendation for trading or investing. It is published only to introduce my own vision.
Always do your own analysis before making deals. When you use any materials, do not rely on blind trust.
You should remember that isolated deals do not give systematic profit, so trade/invest using a developed strategy.
If you like my content, you can subscribe to the news and receive my fresh ideas.
Thanks for being with me!

Down the stairs we go for BitcoinAnother head and shoulders seems to be in play here. 20k would be our target area.

$NOVN is gonna fall todayPupm&Dump trading strategy idea.
$NOVN is rising too much today.
The demand for shares of the company looks lower than the supply.
This and other conditions can cause a fall in the share price today.
So I opened a short position from $10,18;
stop-loss — $10,72;
take-profit — $9,12.
Do not view this idea as a recommendation for trading or investing. It is published only to introduce my own vision.
Always do your own analysis before making deals. When you use any materials, do not rely on blind trust.
You should remember that isolated deals do not give systematic profit, so trade/invest using a developed strategy.
If you like my content, you can subscribe to the news and receive my fresh ideas.
Thanks for being with me!

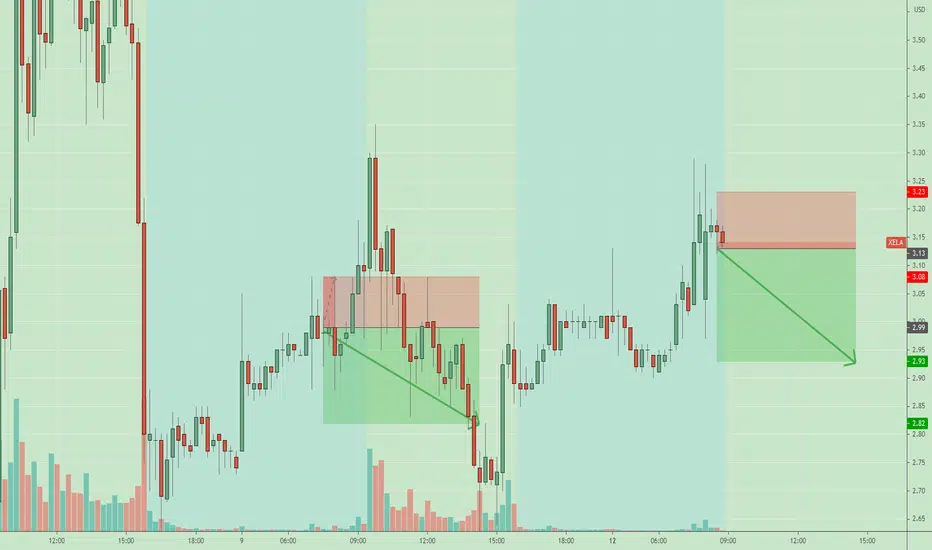
$XELA is gonna fall todayPupm&Dump trading strategy idea.
$XELA is rising too much today.
The demand for shares of the company looks lower than the supply.
This and other conditions can cause a fall in the share price today.
So I opened a short position from $2,99;
stop-loss — $3,08;
take-profit — $2,82.
Do not view this idea as a recommendation for trading or investing. It is published only to introduce my own vision.
Always do your own analysis before making deals. When you use any materials, do not rely on blind trust.
You should remember that isolated deals do not give systematic profit, so trade/invest using a developed strategy.
If you like my content, you can subscribe to the news and receive my fresh ideas.
Thanks for being with me!

$MRIN is gonna fall todayPupm&Dump trading strategy idea.
$MRIN is rising too much today.
The demand for shares of the company looks lower than the supply.
This and other conditions can cause a fall in the share price today.
So I opened a short position from $19,23;
stop-loss — $19,94;
take-profit — $17,82.
Do not view this idea as a recommendation for trading or investing. It is published only to introduce my own vision.
Always do your own analysis before making deals. When you use any materials, do not rely on blind trust.
You should remember that isolated deals do not give systematic profit, so trade/invest using a developed strategy.
If you like my content, you can subscribe to the news and receive my fresh ideas.
Thanks for being with me!

$HGEN is gonna fall todayPupm&Dump trading strategy idea.
$HGEN is rising too much today.
The demand for shares of the company looks lower than the supply.
This and other conditions can cause a fall in the share price today.
So I opened a short position from $18,28;
stop-loss — $19,10;
take-profit — $16,66.
Do not view this idea as a recommendation for trading or investing. It is published only to introduce my own vision.
Always do your own analysis before making deals. When you use any materials, do not rely on blind trust.
You should remember that isolated deals do not give systematic profit, so trade/invest using a developed strategy.
If you like my content, you can subscribe to the news and receive my fresh ideas.
Thanks for being with me!

$RSLS is gonna fall todayPupm&Dump trading strategy idea.
$RSLS is rising too much today.
The demand for shares of the company looks lower than the supply.
This and other conditions can cause a fall in the share price today.
So I opened a short position from $5,68;
stop-loss — $5,96;
take-profit — $5,12.
Do not view this idea as a recommendation for trading or investing. It is published only to introduce my own vision.
Always do your own analysis before making deals. When you use any materials, do not rely on blind trust.
You should remember that isolated deals do not give systematic profit, so trade/invest using a developed strategy.
If you like my content, you can subscribe to the news and receive my fresh ideas.
Thanks for being with me!

$TBLT is gonna fall todayPupm&Dump trading strategy idea.
$TLBT is rising too much today.
The demand for shares of the company looks lower than the supply.
This and other conditions can cause a fall in the share price today.
So I opened a short position from $1,18;
stop-loss — $1,35;
take-profit — $0,85.
Do not view this idea as a recommendation for trading or investing. It is published only to introduce my own vision.
Always do your own analysis before making deals. When you use any materials, do not rely on blind trust.
You should remember that isolated deals do not give systematic profit, so trade/invest using a developed strategy.
If you like my content, you can subscribe to the news and receive my fresh ideas.
Thanks for being with me!

$UONE is gonna fall todayPupm&Dump trading strategy idea.
$UONE is rising too much today.
The demand for shares of the company looks lower than the supply.
This and other conditions can cause a fall in the share price today.
So I opened a short position from $9,23;
stop-loss — $9,94;
take-profit — $7,82.
Do not view this idea as a recommendation for trading or investing. It is published only to introduce my own vision.
Always do your own analysis before making deals. When you use any materials, do not rely on blind trust.
You should remember that isolated deals do not give systematic profit, so trade/invest using a developed strategy.
If you like my content, you can subscribe to the news and receive my fresh ideas.
Thanks for being with me!

$BYFC is gonna fall todayPupm&Dump trading strategy idea.
$BYFC is rising too much today.
The demand for shares of the company looks lower than the supply.
This and other conditions can cause a fall in the share price today.
So I opened a short position from $2,99;
stop-loss — $3,11;
take-profit — $2,74.
Do not view this idea as a recommendation for trading or investing. It is published only to introduce my own vision.
Always do your own analysis before making deals. When you use any materials, do not rely on blind trust.
You should remember that isolated deals do not give systematic profit, so trade/invest using a developed strategy.
If you like my content, you can subscribe to the news and receive my fresh ideas.
Thanks for being with me!

$CARV is gonna fall todayPupm&Dump trading strategy idea.
$CARV is rising too much today.
The demand for shares of the company looks lower than the supply.
This and other conditions can cause a fall in the share price today.
So I opened a short position from $15,14;
stop-loss — $17,05;
take-profit — $11,32.
Do not view this idea as a recommendation for trading or investing. It is published only to introduce my own vision.
Always do your own analysis before making deals. When you use any materials, do not rely on blind trust.
You should remember that isolated deals do not give systematic profit, so trade/invest using a developed strategy.
If you like my content, you can subscribe to the news and receive my fresh ideas.
Thanks for being with me!

$DARE is gonna fall todayPupm&Dump trading strategy idea.
$DARE is rising too much today.
The demand for shares of the company looks lower than the supply.
This and other conditions can cause a fall in the share price today.
So I opened a short position from $2,12;
stop-loss — $2,22;
take-profit — $1,92.
Do not view this idea as a recommendation for trading or investing. It is published only to introduce my own vision.
Always do your own analysis before making deals. When you use any materials, do not rely on blind trust.
You should remember that isolated deals do not give systematic profit, so trade/invest using a developed strategy.
If you like my content, you can subscribe to the news and receive my fresh ideas.
Thanks for being with me!

$TESS is gonna fall todayPupm&Dump trading strategy idea.
$TESS is rising too much today.
The demand for shares of the company looks lower than the supply.
This and other conditions can cause a fall in the share price today.
So I opened a short position from $8,26;
stop-loss — $8,89;
take-profit — $7,02.
Do not view this idea as a recommendation for trading or investing. It is published only to introduce my own vision.
Always do your own analysis before making deals. When you use any materials, do not rely on blind trust.
You should remember that isolated deals do not give systematic profit, so trade/invest using a developed strategy.
If you like my content, you can subscribe to the news and receive my fresh ideas.
Thanks for being with me!
