Dollar Index (DXY): Possible Reversal | Inverse Head & ShouldersThe dollar has had a tough year, but that might be changing.
I’ve spotted a well-known reversal pattern: an Inverse Head & Shoulders.
This pattern features three dips, with the middle one—the "head"—being the deepest.
Now, the price has rebounded from the Right Shoulder and is heading higher.
It’s approaching the Neckline at $98.7, which needs to be broken for a bullish confirmation.
If that happens, the projected target is around $101.6, based on the depth of the pattern.
This lines up closely with the previous high of $102 from May. The target area is highlighted in the blue box.
However, if the price falls below the Right Shoulder’s low at $97.1, the pattern would be invalidated.
Anyone else see this pattern?
Could this be the bottom for the dollar?
Dollar Index Futures DX1!

"DXY Bullish Setup – High Probability Trade!"🚨 "DXY DOLLAR BANK HEIST" – THIEF TRADING STYLE MASTER PLAN (HIGH-IMPACT TRADE ALERT!)
🔥 "Steal the Market Like a Pro – This DXY Heist Could Print Serious Cash!" 🔥
🌍 Greetings, Market Pirates & Profit Raiders! 🌍
🤑 "Money isn’t made… it’s TAKEN!" 💰💸
Based on the 🔥 Thief Trading Style 🔥 (a lethal mix of technical + fundamental + psychological warfare), we're executing a DXY Dollar Index Bank Heist—a high-stakes robbery where YOU get to keep the loot!
📜 THE HEIST BLUEPRINT (TRADE PLAN)
🎯 ENTRY ZONE – "BREAK THE VAULT DOOR!"
📍Key Trigger: Wait for price to SMASH through the Moving Average Wall (97.700) – then STRIKE!
🔪 Thief’s Entry Trick:
Buy Stop Orders above MA (aggressive)
Buy Limit Orders near recent swing low (smart pullback play)
DCA/Layering Strategy for max profit extraction (real robbers scale in!)
🚨 ALERT SETUP: "Don’t miss the breakout – set an ALARM!" ⏰
🛑 STOP LOSS – "DON’T GET CAUGHT!"
"Yo, rookie! If you’re entering on a breakout, WAIT for confirmation before placing SL!"
📍Thief’s SL Zone: 97.400 (30min swing low – adjust based on your risk appetite!)
⚠️ WARNING: "Place it wrong, and the cops (market) will lock YOU up!" 🚔
🎯 TARGET – "ESCAPE WITH THE LOOT!"
🏆 Primary Target: 98.350 (Take profits before the resistance police show up!)
🔄 Scalper’s Bonus: "Trail your SL, squeeze every pip!"
💡 Pro Tip: "If you’re underfunded, ride with the swing traders – teamwork makes the dream work!"
💣 WHY THIS HEIST WILL WORK (MARKET DYNAMICS)
✅ Bullish Momentum Building (DXY showing strength!)
✅ Overbought? Maybe… but thieves don’t wait for permission!
✅ Trend Reversal Potential (Big money shifting!)
✅ Police (Resistance) Trap Ahead (Escape before they catch you!)
📡 NEWS & RISK MANAGEMENT (DON’T GET BUSTED!)
🚨 High-Impact News? AVOID new trades! (Use trailing stops to lock profits!)
📊 Check COT Reports, Macro Data, Geopolitics (Smart thieves do their homework!)
💥 BOOST THIS HEIST – LET’S GET RICH TOGETHER!
👊 "Hit the LIKE & BOOST button to fuel our next heist!"
💖 "More boosts = More robberies = More FREE money for YOU!" 🚀
⚠️ DISCLAIMER (LEGAL SPEAK)
"This ain’t financial advice – just a damn good robbery plan. Trade at your own risk, and don’t cry if you ignore the SL!" 😎
🔔 Stay tuned for the next heist… The market’s our playground! 🏴☠️💰
🚀 "See you at the next breakout, thief!" 🚀
🔥 #DXY #Forex #Trading #BankHeist #ThiefTrading #ProfitPirates #MakeMoney #TradingView #SmartMoney 🔥

“The Dollar Job: Break-In Strategy for 99+ Profits”💸 “DXY Heist Blueprint: Thieves’ Bullish Breakout Play” 🏴☠️
🌟Hi! Hola! Ola! Bonjour! Hallo! Marhaba!🌟
Welcome, Money Makers & Silent Robbers 🕶️💼✨
This is our next big Thief Trading Heist Plan targeting the 💵 DXY Dollar Index Vault. Armed with both technical precision 🔍 and fundamental insight 📊, we're ready to strike smart — not just fast.
🎯 THE MASTER HEIST PLAN:
🟢 ENTRY POINT – “Heist Entry Protocol”
🎯 Wait for price to break above Resistance @ 99.000 and candle to close ✅
💥 Plan A: Place Buy Stop Orders just above breakout
📥 Plan B: For Pullback Pros, use Buy Limit at recent swing low/high (15m–30m TF)
📌 Tip: Set alerts — don’t get caught napping while the vault opens! ⏰🔔
🛑 STOP LOSS – “Thief’s Escape Hatch”
🧠 Use 4H swing low at 98.100 as SL
⚖️ Adjust based on your lot size and number of open positions
🚨 Don't rush to set SL for Buy Stop entries before confirmation! Patience is part of the plan. 😎
🎯 TARGET – “Mission Objective”
💰 First Exit Target: 100.000
🏃♂️ Optional: Escape earlier near high-risk zones (Blue MA Line Trap Area)
⚔️ SCALPERS' CODE – Stay Sharp!
Only scalp on the Long side.
🔐 Use Trailing SL to guard your loot!
💸 Big wallets? Jump early.
🧠 Smaller stack? Follow the swing crew for coordinated execution.
🌐 MARKET OUTLOOK: WHY THE VAULT’S OPENING
💡 Currently seeing bullish momentum in the DXY
📈 Driven by macroeconomics, sentiment shifts, and intermarket pressure
📰 Want the full debrief? Check our analysis across:
COT Data
Geopolitics & News
Macro Trends & Sentiment
Fundamental Forces
📎🔗 See full breakdown
⚠️ TRADE MANAGEMENT ALERT
🚫 Avoid opening new trades during high-impact news
🔁 Always use Trailing Stops to lock in profits
❤️ Support The Heist – Boost the Plan!
Every boost powers our underground crew 🐱👤.
We rob the markets, not the people. 💼💰
Like & Boost to help grow the Thief Trading Gang 👊💥
Stay tuned, robbers – more heist plans dropping soon.
💸🚀📈🤑

DXY BANK VAULT BREAK-IN: Your Dollar Index Profit Blueprint🚨 DXY BANK HEIST: Dollar Index Breakout Robbery Plan (Long Setup) 🚨
🌟 Hi! Hola! Ola! Bonjour! Hallo! Marhaba! 🌟
Attention, Market Robbers & Dollar Bandits! 🏦💰💸
Using the 🔥Thief Trading Style🔥, we’re plotting a DXY (Dollar Index) bank heist—time to go LONG and escape near the ATR danger zone. Overbought? Yes. Risky? Absolutely. But the real robbery happens when weak hands panic. Take profits fast—you’ve earned this loot! 🏆💵
📈 ENTRY: BREAKOUT OR GET LEFT BEHIND!
Wait for DXY to cross 99.300 → Then strike hard!
Buy Stop Orders: Place above Moving Average.
Buy Limit Orders: Sneak in on 15M/30M pullbacks (swing lows/highs).
Pro Tip: Set a BREAKOUT ALARM—don’t miss the heist!
🛑 STOP LOSS: DON’T GET LOCKED UP!
For Buy Stop Orders: Never set SL before breakout—amateurs get caught!
Thief’s Safe Spot: Nearest swing low (2H chart).
Rebels: Place SL wherever… but your funeral! ⚰️
🏴☠️ TARGET: 102.300 (Bank Vault Cracked!)
Scalpers: Long only! Trail your SL like a pro thief.
Swing Traders: Ride this heist for maximum payout.
💵 MARKET CONTEXT: DXY IS BULLISH (But Traps Await!)
Fundamentals: COT Reports, Fed Plays, Geopolitics.
Intermarket Sentiment: Bonds, Gold, Stocks—all connected.
Full Analysis: Check our bio0 linkks 👉🔗 (Don’t trade blind!).
⚠️ ALERT: NEWS = VOLATILITY = TRAP ZONE!
Avoid new trades during high-impact news.
Lock profits with trailing stops—greed gets you caught!
💥 SUPPORT THE HEIST (OR GET LEFT BROKE!)
Smash that Boost Button 💖→ Stronger team = bigger scores!
Steal profits daily with the Thief Trading Style. 🎯🚀
Next heist coming soon… stay ready! 🤑🐱👤🔥

DXY Short-term rebound quite likely.The U.S. Dollar index (DXY) has been trading within almost a 3-year Channel Down, which has assisted us in choosing the right levels to sell high and buy low.
Despite being now on its 2nd major Bearish Leg, we see a short-term bounce possibly up to August quite likely based on the previous major Bearish Leg. As you see, the current setup resembles the April 13 023 Low after which the price rebounded short-term just above the 0.786 Fibonacci level, only to get rejected later and complete the bottom on the 1.1 Fib extension.
Even the 1W RSI sequences between the two fractals are identical. Therefore, before diving below 96.000, we believe a 100.000 test is quite likely.
-------------------------------------------------------------------------------
** Please LIKE 👍, FOLLOW ✅, SHARE 🙌 and COMMENT ✍ if you enjoy this idea! Also share your ideas and charts in the comments section below! This is best way to keep it relevant, support us, keep the content here free and allow the idea to reach as many people as possible. **
-------------------------------------------------------------------------------
💸💸💸💸💸💸
👇 👇 👇 👇 👇 👇

DX - USD Index Longterm Outlook Indicates Further DeclineThis long-term chart shows how the USD Index is trading within the boundaries of the Median Line set.
We see the lower extreme, solid support around the Center Line, and the upper extreme acting as resistance.
What’s next?
Well—if it’s not heading higher, it’s likely heading lower—and the rejection at the Upper Median Line (U-MLH) supports that view.
If we revisit the Center Line, my experience tells me it won’t hold—we’ll break through and head even lower.
Buckle up. It’s going to be a rough ride.

DXY: Approaching a bottom. Wait for the 1D MA50 to break.The U.S. Dollar Index is neutral on its 1D technical outlook (RSI = 45.278, MACD = -0.450, ADX = 23.415) as it seems to be approaching a long term support level, the bottom of the 12 month Channel Down. As long as it stays under the 1D MA50, the trend will remain bearish towards the bottom but once it crosses above, we will turn bullish and aim for a +9.95% bullish wave (TP = 107.000) same as the one before. Notice how similar the 1D RSI fractals are now and the previous bottom in September 2024.
## If you like our free content follow our profile to get more daily ideas. ##
## Comments and likes are greatly appreciated. ##

A Contrarian View On the US DollarI don't recall the last bullish headline I saw for the US dollar, bearish sentiment may be stretched, and I'm seeing plenty of clues across the US dollar index and all FX majors that we could at least be looking at a minor bounce. Whether it can turn into a larger short-covering rally is likely down to Trump's trade deals. Either way, I'm, on guard for an inflection point for the dollar.
Matt Simpson, Market Analyst at City Index and Forex.com

the trap has layerswhat if i told you the dxy was not done yet,
what if i told you, there was 1 more push up,
1 more test before it truly breaks and starts a bull market.
what if i told you that on that final test, that final push up,
the crypto market breaks and takes everything.
---
you probably wouldn't believe me.
---
looking at the dxy as a simple zig-zag with a complex flat in the b-wave.
once wave b is completed, at about 110-111,
i predict it drops down, deep
and while it drops,
it triggers alt season.
🌙

DXY Sell this rally. Bearish until end-of-year.The U.S. Dollar index (DXY) has been trading within a Channel Down since the September 26 2022 High and is currently on a medium-term Bearish Leg. The last 3 weeks however have been a short-term rebound (all 1W candles green), but the price is still below both the 1W MA200 (orang trend-line) and the 1W MA50 (blue trend-line).
This doesn't alter the bearish trend as this is not the first time we've seen this price action. More specifically, DXY also made a short-term rebound during the first Bearish Leg of the pattern and rebounded on January 30 2023 back to the 1W MA50. This delivered a strong rejection which eventually completed the Bearish Leg with one last round of selling to complete a -13.30% Bearish Leg in total.
Before that, we also saw the same pattern (also on 1W RSI terms) in 2020, when on August 31 2020 the price again had a short-term rebound only to resume the bearish trend and finish the sequence again at -13.40% from the top.
As a result, as long as the price remains (closes) below the 1W MA50, the last sell signal is given when the 1W RSI breaks above its MA (yellow trend-line) and then we can expect the Bearish Leg to complete a -13.30% decline with a 96.000 Target.
-------------------------------------------------------------------------------
** Please LIKE 👍, FOLLOW ✅, SHARE 🙌 and COMMENT ✍ if you enjoy this idea! Also share your ideas and charts in the comments section below! This is best way to keep it relevant, support us, keep the content here free and allow the idea to reach as many people as possible. **
-------------------------------------------------------------------------------
💸💸💸💸💸💸
👇 👇 👇 👇 👇 👇

top is in for the dxygm,
this idea has been in the works for years, ever since we topped out 3 years ago. there has been quite a bit of variations of this idea, but this one right here has been my primary idea for a very long time.
initially i imagined the dxy coming up to 111-113 before topping out, and i reckon it still can, but the worst is behind us, relatively speaking.
---
if my count here is correct, the dxy will begin extending down into wave c into the last days of 2025 where a major low will be put in place .
this will create a hyper-parabolic bull phase for risk assets, in conjunction with declining rates.
---
if you've been waiting for a signal to buy alts
this is your signal.
🌙
---
ps. view my private idea from last year via:
🌙

DXY: Summer CRASH but here is why it will SKYROCKET after.The U.S. Dollar Index is oversold on both its 1D and 1W technical outlooks but on the 1M it just turned bearish (RSI = 42.641, MACD = 0.810, ADX = 21.680). This is because it crossed under its 1M MA50 for the first time since January 2022. For more than 3 years the 1M MA50 has kept it on the upper side of the 2008 Channel Up but now the time has come for it to aim at its bottom as every time it broke under it, the pattern dropped more and made a bottom a few months later.
We anticipate a bottom around July, ideally with the 1M RSI inside our Target Zone, which consists of the last two lows. Then the new bullish wave of the pattern should begin, reaching the January 2025 High by the end of 2026.
## If you like our free content follow our profile to get more daily ideas. ##
## Comments and likes are greatly appreciated. ##

DXY just broke below the 1W MA200 after 6 months!The U.S. Dollar index (DXY) broke today below its 1W MA200 (orange trend-line) for the first time in 6 months (since the week of September 30 2024). By doing so, it has almost hit the bottom (Higher Lows trend-line) of the long-term Channel Up.
The last contact with the 1W MA200 initiated a massive Bullish Leg two weeks after, so it would be an encouraging development if the candle holds here or better yet even close above the 1W MA200.
If it does, we expect a new strong Bullish Leg to start, targeting initially at least the 0.786 horizontal (blue) Fibonacci level at 108.000.
If not, the 2-year Support Zone is the last defense, with 99.600 as its lowest level (the July 10 2023 Low). Below that, a multi-year downtrend for DXY awaits.
Notice however, the incredible 1W RSI symmetry between selling sequences. Since January 2023, we've had two -54.50% declines. Right now, the current decline since January 2025 is exactly at -54.50%. If DXY rebounds here, it will confirm this amazing symmetry.
-------------------------------------------------------------------------------
** Please LIKE 👍, FOLLOW ✅, SHARE 🙌 and COMMENT ✍ if you enjoy this idea! Also share your ideas and charts in the comments section below! This is best way to keep it relevant, support us, keep the content here free and allow the idea to reach as many people as possible. **
-------------------------------------------------------------------------------
💸💸💸💸💸💸
👇 👇 👇 👇 👇 👇

"DXY/Dollar Index" Bull Money Heist Plan (Scalping / Day Trade)🌟Hi! Hola! Ola! Bonjour! Hallo! Marhaba!🌟
Dear Money Makers & Robbers, 🤑 💰💸✈️
Based on 🔥Thief Trading style technical and fundamental analysis🔥, here is our master plan to heist the "DXY/Dollar Index" Indices Market. Please adhere to the strategy I've outlined in the chart, which emphasizes long entry. Our aim is the high-risk Red Zone. Risky level, overbought market, consolidation, trend reversal, trap at the level where traders and bearish robbers are stronger. 🏆💸"Take profit and treat yourself, traders. You deserve it!💪🏆🎉
Entry 📈 : "The heist is on! Wait for the MA breakout (104.100) then make your move - Bullish profits await!"
however I advise to Place Buy stop orders above the Moving average (or) Place buy limit orders within a 15 or 30 minute timeframe most recent or swing, low or high level.
📌I strongly advise you to set an "alert (Alarm)" on your chart so you can see when the breakout entry occurs.
Stop Loss 🛑:
Thief SL placed at the recent/swing low level Using the 1H timeframe (103.500) Scalping/Day trade basis.
SL is based on your risk of the trade, lot size and how many multiple orders you have to take.
🏴☠️Target 🎯: 105.000 (or) Escape Before the Target
🧲Scalpers, take note 👀 : only scalp on the Long side. If you have a lot of money, you can go straight away; if not, you can join swing traders and carry out the robbery plan. Use trailing SL to safeguard your money 💰.
"DXY/Dollar Index" Indices Market Heist Plan (Scalping / Day Trade) is currently experiencing a bullishness,., driven by several key factors.
📰🗞️Get & Read the Fundamental, Macro Economics, COT Report, Geopolitical and News Analysis, Sentimental Outlook, Intermarket Analysis, Index-Specific Analysis, Positioning and future trend targets... go ahead to check 👉👉👉🔗
⚠️Trading Alert : News Releases and Position Management 📰 🗞️ 🚫🚏
As a reminder, news releases can have a significant impact on market prices and volatility. To minimize potential losses and protect your running positions,
we recommend the following:
Avoid taking new trades during news releases
Use trailing stop-loss orders to protect your running positions and lock in profits
💖Supporting our robbery plan 💥Hit the Boost Button💥 will enable us to effortlessly make and steal money 💰💵. Boost the strength of our robbery team. Every day in this market make money with ease by using the Thief Trading Style.🏆💪🤝❤️🎉🚀
I'll see you soon with another heist plan, so stay tuned 🤑🐱👤🤗🤩

Bears give the USD a break, EUR/USD pullback may not be overThe retracement higher for the US dollar is finally underway, which also shows further upside potential. And this is why I am wary of being long EUR/USD over the foreseeable future, even if I suspect it is poised to break to new highs in the coming weeks.
Matt Simpson, Market Analyst at City Index and Forex.com

DXY Dollar Index Market Bearish Heist Plan🌟Hi! Hola! Ola! Bonjour! Hallo!🌟
Dear Money Makers & Robbers, 🤑 💰🐱👤🐱🏍
Based on 🔥Thief Trading style technical and fundamental analysis🔥, here is our master plan to heist the DXY Dollar Index Market. Please adhere to the strategy I've outlined in the chart, which emphasizes short entry. Our aim is the high-risk Green Zone. Risky level, oversold market, consolidation, trend reversal, trap at the level where traders and bullish thieves are getting stronger. 🏆💸Book Profits Be wealthy and safe trade.💪🏆🎉
Entry 📈 : "The heist is on! Wait for the breakout (37800) then make your move - Bearish profits await!"
however I advise placing Sell Stop Orders below the breakout MA or Place Sell limit orders within a 15 or 30 minute timeframe. Entry from the most recent or closest low or high level should be in retest. I Highly recommended you to put alert in your chart.
Stop Loss 🛑: Thief SL placed at 38500 (swing Trade Basis) Using the 4H period, the recent / swing high or low level.
SL is based on your risk of the trade, lot size and how many multiple orders you have to take.
Target 🎯: 36500 (or) Escape Before the Target
🧲Scalpers, take note 👀 : only scalp on the Short side. If you have a lot of money, you can go straight away; if not, you can join swing traders and carry out the robbery plan. Use trailing SL to safeguard your money 💰.
📰🗞️Fundamental, Macro, COT, Sentimental Outlook:
DXY Dollar Index Market is currently experiencing a Bearish trend., driven by several key factors.
⚡Fundamental Analysis
Fundamental factors driving DXY focus on U.S. economic conditions, Fed policy, and global currency dynamics.
Interest Rates:
U.S. Federal Reserve: Rates steady at 3-3.5%, down from 2024’s 4.5-5%. Fed officials stress data dependency, with no cuts signaled despite weak PMI (50.4) and jobless claims (219,000 vs. 215,000 forecast). Real yields (10-year Treasury at 3.8%, ~1% inflation-adjusted) support USD.
Other Countries: ECB at 2.5%, BoJ at 0.25-0.5%, BoE at 4-4.5%—U.S. yield advantage persists, though narrowing.
Impact: Bullish for DXY, tempered by global easing.
Inflation:
U.S.: PCE at 2.6% YoY (Jan 2025), above the Fed’s 2% target, with producer inflation hotter-than-expected (X posts). Inflation fears linger, supporting USD.
Other Countries: Eurozone at 2.8%, Japan at 2.5%, UK at 2.5-3%—global inflation pressures USD rivals less.
Impact: Bullish, as U.S. inflation sustains Fed hawkishness.
Economic Growth:
U.S.: Mixed signals—PMI at 50.4 (near stagnation), jobless claims up, but ADP jobs beat at 183,000 (Jan 2025). Tariffs add uncertainty.
Other Countries: China at 4.5% (slowing), Eurozone at 1.2%, Japan at 1%—U.S. outperforms peers.
Impact: Mildly bullish, U.S. resilience aids USD.
Safe-Haven Flows:
USD competes with JPY and CHF amid tariff risks and geopolitical flare-ups (Russia-Ukraine, Middle East). Recent yen strength (X posts) pressures DXY.
Impact: Mildly bearish, global risk-off challenges USD dominance.
Trade Balance:
U.S. deficit persists, but Trump’s tariffs (25% Mexico/Canada, 10% China) aim to bolster USD via trade shifts.
Impact: Bullish long-term, short-term neutral.
⚡Macroeconomic Factors
U.S.-focused with global context:
U.S. Policy: Fed’s tighter stance vs. global easing (ECB, BoJ) favors USD. Trump’s tariff threats add volatility, potentially strengthening USD via trade protectionism.
Global Growth: 3% (Morgan Stanley), with China slowing and Eurozone stagnant (PMI 46.2). U.S. relative strength supports DXY.
Commodity Prices: Oil at $70.44 pressures import-heavy peers (Japan), mildly weakening JPY vs. USD.
Currency Dynamics: Yen strength and EUR softness (EUR/USD below 1.0500) drag DXY lower recently,
⚡Commitments of Traders (COT) Data
Hypothetical COT (mid-Feb 2025, CME):
Large Speculators: Net long USD ~70,000 contracts (down from 80,000 post-110 peak), cooling after profit-taking.
Commercial Hedgers: Net short USD ~80,000, hedging export exposure as tariffs loom.
Open Interest: ~150,000 contracts, stable, reflecting U.S. trader engagement.
Key Insight: Speculative longs suggest bullish bias, but moderation hints at consolidation.
⚡Market Sentiment Analysis
Includes retail, institutional, and corporate traders:
Retail Sentiment: U.S. retail traders likely 60% short DXY at 106.000 (hypothetical broker data), betting on yen/CHF gains. Contrarian upside risk if shorts unwind.
Institutional Traders: U.S. funds (e.g., Citi, HSBC) mixed—bearish short-term (DXY to 96.87, Citi Hong Kong), bullish long-term (WalletInvestor to 119.193). Sentiment leans cautious.
Corporate Traders: U.S. exporters hedge at 106.50-107.00, neutral as tariffs loom; European firms favor EUR weakness.
Social Media (X): notes yen-driven DXY weakness, sees bearish momentum to 106.15—trending bearish.
Broker Data: U.S. IG sentiment ~55% long—balanced positioning.
⚡Quantitative Analysis
Moving Averages: 50-day SMA (106.30), 200-day SMA (105.50)—price below 50-day, above 200-day, neutral signal.
RSI: 45 (daily), bearish momentum fading, room for reversal.
Bollinger Bands: 105.80-106.80 range, 106.000 at midpoint—consolidation likely.
Fibonacci: 38.2% retracement from 110.00-102.50 at 105.62—key support holds.
Volatility Model: Implied volatility (1-month) at 7%, suggesting 0.75-point monthly range (±0.7%).
⚡Intermarket Analysis
USD/JPY: At 150.00, yen strength pressures DXY; drop to 145 could accelerate declines.
EUR/USD: Below 1.0500, EUR weakness supports DXY mildly.
Gold: XAU/USD at 2940 (risk-off proxy) inversely pressures USD.
Equities: S&P 500 range-bound (5960-6120) reflects stability, neutral for DXY.
Bonds: U.S. 10-year yield at 3.8% vs. JGB at 0.9%—yield gap aids USD.
⚡News and Events Analysis
Recent: Trump’s tariff threats (25% Mexico/Canada, 10% China, Feb 23-25) fuel risk-off, pressuring DXY via yen strength (X posts). Weak U.S. PMI and jobless claims offset by PCE at 2.6% (Jan 2025).
Upcoming: U.S. PCE data (Feb 28) critical—hotter data could lift DXY, softer data bearish. Fed rhetoric pending.
Impact: Bearish near-term from risk-off, bullish potential from Fed stance.
⚡Overall Summary Outlook
DXY at 106.000 balances U.S. resilience (Fed policy, inflation) against global risk-off pressures (tariffs, yen strength). Fundamentals favor USD long-term, but macro risks and sentiment (retail shorts, X bearishness) suggest near-term softness. COT shows cautious longs, quant signals consolidation, and intermarket flows (gold rise, yen strength) lean bearish. Short-term dip to 105.50-105.91 likely, medium-term range-bound with a bullish tilt if Fed holds firm.
⚡Future Prediction
Bullish Case: DXY to 108.00-110.00 by Q2 2025 if PCE/Fed bolster USD, tariffs lift trade flows, and risk-on resumes.
Bearish Case: Drop to 103.50-105.00 if yen/CHF surge, tariffs falter, or Fed dovishness emerges.
Prediction: Mildly bearish short-term to 105.50, then bullish to 108.00 by mid-2025, driven by Fed policy divergence.
⚠️Trading Alert : News Releases and Position Management 📰 🗞️ 🚫🚏
As a reminder, news releases can have a significant impact on market prices and volatility. To minimize potential losses and protect your running positions,
we recommend the following:
Avoid taking new trades during news releases
Use trailing stop-loss orders to protect your running positions and lock in profits
💖Supporting our robbery plan will enable us to effortlessly make and steal money 💰💵 Tell your friends, Colleagues and family to follow, like, and share. Boost the strength of our robbery team. Every day in this market make money with ease by using the Thief Trading Style.🏆💪🤝❤️🎉🚀
I'll see you soon with another heist plan, so stay tuned 🤑🐱👤🤗🤩

The Dollar Index has reversed upward.Hey everyone!
Looks like a solid entry for a DXY long and a good time to start ditching EUR and Gold (yes, I do think gold is heading down).
On the daily chart, we can see that we've completed five waves down and are now forming a reversal.
EUR/USD and GOLD/USD have already started reacting, Index Dollar (DXY) hitting the 61.8% Fibonacci retracement level.
Now the climb begins, with the first target around 125 for the Dollar Index.
The potential peak?
144, though we’ll likely see corrections along the way.
Buckle up—volatile times ahead... 🧐🧐🧐

Weakness of Dollar Could Be Over SoonTextbook Head & Shoulders pattern is underway on DXY chart.
Price is close to the target of 101.91.
Watch how price will react there as weakness of dollar could be over soon

The Dollar's Demise May Not Be Over Just YetThe US dollar index is on track for its worst week in nearly two and a half years. It is also nearly 6% off from the January high, which is similar in depth to the two previous selloffs seen in 2023 and 2024. Yet I do not think we've seen the low just yet, even if there is evidence of a potential bounce on the daily chart.
Matt Simpson, Market Analyst at City Index and Forex.com

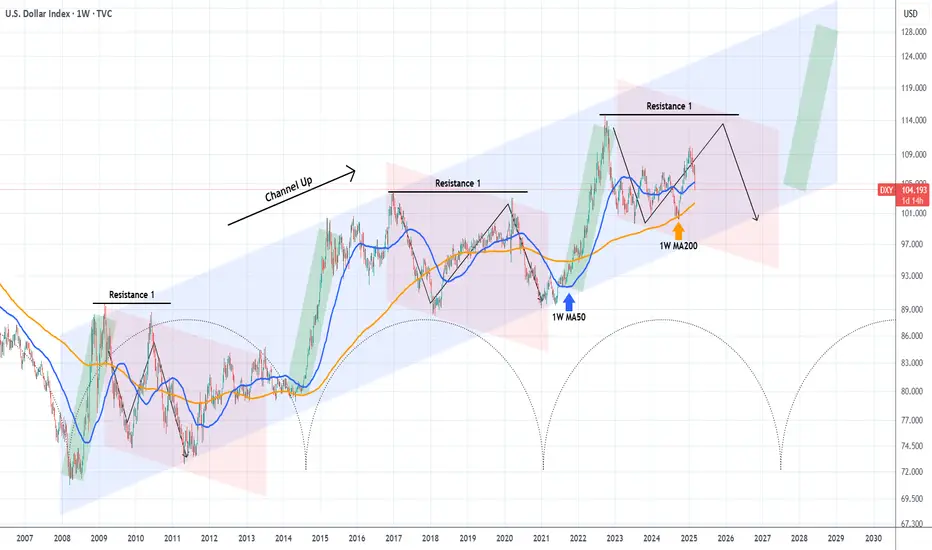
DXY looking for a final push higher before collapse.The U.S. Dollar index (DXY) has been on a strong decline recently, having even broken below its 1W MA50 (blue trend-line).
The multi-year trend is however bullish, a Channel Up pattern since the 2008 market bottom. With the use of the time Cycles tool, we can estimate when the next Bullish Leg starts, and that's not before 2027.
Based on the previous Channel Up corrections (red Channels) we should be expecting one final push towards Resistance 1, before a long-term decline and completion of the Bearish Leg.
As a result, as long as the 1W MA200 (orange trend-line) holds, we can take a low risk buy and target the 112.000 - 114.000 Zone.
-------------------------------------------------------------------------------
** Please LIKE 👍, FOLLOW ✅, SHARE 🙌 and COMMENT ✍ if you enjoy this idea! Also share your ideas and charts in the comments section below! This is best way to keep it relevant, support us, keep the content here free and allow the idea to reach as many people as possible. **
-------------------------------------------------------------------------------
💸💸💸💸💸💸
👇 👇 👇 👇 👇 👇
DXY Dollar Index Market Bearish Heist Plan (Day/Swing Trade)🌟Hi! Hola! Ola! Bonjour! Hallo!🌟
Dear Money Makers & Robbers, 🤑 💰🐱👤🐱🏍
Based on 🔥Thief Trading style technical and fundamental analysis🔥, here is our master plan to heist the DXY Dollar Index Market. Please adhere to the strategy I've outlined in the chart, which emphasizes short entry. Our aim is the high-risk Green Zone. Risky level, oversold market, consolidation, trend reversal, trap at the level where traders and bullish thieves are getting stronger. 🏆💸Book Profits Be wealthy and safe trade.💪🏆🎉
Entry 📈 : "The vault is wide open! Swipe the Bearish loot at any price - the heist is on!
however I advise to Place Sell limit orders within a 15 or 30 minute timeframe. Entry from the most recent or closest low or high level should be in retest.
Stop Loss 🛑: Thief SL placed at 108.500 (swing Trade Basis) Using the 4H period, the recent / swing high or low level.
SL is based on your risk of the trade, lot size and how many multiple orders you have to take.
Target 🎯: 105.500 (or) Escape Before the Target
🧲Scalpers, take note 👀 : only scalp on the Short side. If you have a lot of money, you can go straight away; if not, you can join swing traders and carry out the robbery plan. Use trailing SL to safeguard your money 💰.
📰🗞️Fundamental, Macro, COT, Sentimental Outlook:
DXY Dollar Index Market is currently experiencing a Bearish trend., driven by several key factors.
💠Fundamental Analysis
Weakening US Economy: The US economy's growth is slowing down, which could lead to a decline in the dollar's value.
Falling Interest Rates: The US Federal Reserve's decision to cut interest rates could weaken the dollar.
💠Macroeconomic Analysis
The US economy's growth, inflation rates, and employment numbers influence the dollar's strength.
Global economic trends, such as trade tensions and geopolitical events, also impact the dollar's value.
💠COT Data Analysis
Net Short Positions: Institutional traders and large banks have increased their net short positions in the DXY Dollar Index, indicating a bearish sentiment.
COT Ratio: The COT ratio has fallen to 1.2, indicating a bearish trend.
💠Market Sentimental Analysis
Bearish Sentiment: 55% of client accounts are short on this market, indicating a bearish sentiment.
Option Skew: The 25-delta put option skew has increased to 15, indicating a bearish sentiment.
💠Positioning Data Analysis
Institutional Traders: Institutional traders and large banks are positioning themselves for a bearish trend, with some predicting a decline to 105.50.
Corporate Traders: Corporate traders are also monitoring the index's performance, considering factors like interest rates and global economic trends.
💠Overall Outlook
Bearish Trend: The DXY Dollar Index is experiencing a bearish trend, with a potential decline to 105.50.
Key Support Levels: 106.57, 105.50.
💠Technical Analysis
Moving Averages: The 50-day MA is indicating a bearish trend.
Relative Strength Index (RSI): The RSI has fallen to 40, indicating oversold conditions.
Bollinger Bands: The lower band breakout indicates a bearish trend.
⚠️Trading Alert : News Releases and Position Management 📰 🗞️ 🚫🚏
As a reminder, news releases can have a significant impact on market prices and volatility. To minimize potential losses and protect your running positions,
we recommend the following:
Avoid taking new trades during news releases
Use trailing stop-loss orders to protect your running positions and lock in profits
📌Please note that this is a general analysis and not personalized investment advice. It's essential to consider your own risk tolerance and market analysis before making any investment decisions.
📌Keep in mind that these factors can change rapidly, and it's essential to stay up-to-date with market developments and adjust your analysis accordingly.
💖Supporting our robbery plan will enable us to effortlessly make and steal money 💰💵 Tell your friends, Colleagues and family to follow, like, and share. Boost the strength of our robbery team. Every day in this market make money with ease by using the Thief Trading Style.🏆💪🤝❤️🎉🚀
I'll see you soon with another heist plan, so stay tuned 🤑🐱👤🤗🤩

The Market Matrix - Gold, DXY, SP500 & Crude Oil Feb 16 2025This weeks edition of the market matrix.
How I'm looking to participate in the Gold, DXY, SP500 & Crude Oil markets this week.
I throw in some COT analysis as well.

Institutions Pull Back Their Funds From The FedDisclaimer : Geopolitical factors are currently a major concern.
This data analysis aims to serve as a fundamental basis derived directly from official sources to assess the USD exchange rate and the likelihood of future monetary policies under normal economic conditions, excluding geopolitical factors that create sentiment different from the actual economic conditions.
H.4.1 Report
FRED
CME FedWatch
Fed Balance Sheet:
Securities Held Outright: Increased by $38 million.
Reverse Repo (RRP): Significantly decreased by $51.875 million in the latest period.
Reserve Balances: Increased by $42.962 million.
TGA Data
Current balance: $809,154 million.
Change this week: Decreased by $8,799 million.
Change from last year: Decreased by $22,726 million significantly.
RRP
A significant decrease in the last 3 days, from $99.65 billion on February 10 to $67.82 billion on February 13, with a total decrease of -$31.83 billion.
M2 Money Supply Data:
M2 value as of December 2024: $21,533.8 billion.
Change from the previous month (Nov 2024): +$85.5 billion.
Change from last year (Dec 2023): +$808.4 billion.
Fed Interest Rate Decision:
Main decision: The Federal Reserve maintained the interest rate in the range of 4.25% - 4.50%.
Bank Reserve Interest Rate: Remains at 4.4%.
Primary Credit Rate: Remains at 4.5%.
The Federal Reserve will continue its Quantitative Tightening (QT) policy by continuing to reduce holdings of Treasury securities and MBS.
Market Expectations from CME FedWatch Tool:
Current target rate: 425-450 bps (4.25% - 4.50%).
Probability for an interest rate of 400-425 bps: 2.5%.
Probability for an interest rate of 425-450 bps: 97.5%.
Based on this analysis
The Federal Reserve has a policy to maintain interest rates stable in the range of 4.25% - 4.50%. Despite the significant decrease in Reverse Repo and the decrease in TGA, as well as the significant increase in M2 Money Supply, this policy is maintained to support economic stability and reduce excess liquidity in the market. The high probability (97.5%) of the market to maintain or increase the interest rate also reflects strong expectations for a conservative monetary policy by the Federal Reserve in the short term.
Impact on USD Overall
Based on the analysis of data from the Fed Balance Sheet, TGA, RRP, M2 Money Supply, and interest rate expectations, USD is likely to remain stable to strengthen in the short term, especially due to the tight monetary policy (Quantitative Tightening/QT) and the high probability of interest rates remaining in the 4.25%-4.50% range.
Components
RRP decreased significantly by -$31.83B in 3 days, liquidity increased, USD may weaken
A decrease in RRP means banks and financial institutions are withdrawing their funds from The Fed and are likely to move into other assets. This increases liquidity in the market, which may weaken the USD due to more dollars circulating, potentially lowering the exchange rate.
M2 Money Supply increased by +$808.4B YoY, liquidity increased, USD may weaken
A significant increase in M2 indicates more money circulating in the economy, which could pressure the purchasing power of the USD. If this growth continues, it resembles a loosening of monetary policy, which could weaken the USD in the long term.
The Fed remains with QT & does not lower interest rates, monetary contraction, USD may strengthen
The QT policy and no interest rate cuts indicate that the Fed still wants to control inflation and maintain tight monetary policy. This could attract investors to USD-based assets (Treasury Yields), keeping the USD strong compared to other currencies.
TGA decreased by -$8.8B weekly, -$22.7B YoY, liquidity increased, USD may weaken
A decrease in TGA balance indicates that the government is withdrawing funds for spending. This means more dollars entering the economy, which could add pressure to weaken the USD in the short term.
You can prepare a trading strategy based on the following scenarios:
Bullish USD if scenario: The Fed maintains QT, does not cut interest rates, and investors continue buying USD-based assets.
Neutral USD if scenario: The Fed maintains interest rates, but RRP & M2 Money Supply continue to rise.
Bearish USD if scenario: RRP continues to decrease drastically, M2 increases significantly, and the Fed starts considering interest rate cuts.
Short Term (1-3 months): USD is likely to remain strong due to tight monetary policy, but if liquidity continues to increase from RRP and M2, weakening could occur in the next quarter.
Long Term (6-12 months): If M2 continues to rise and the Fed changes its policy towards interest rate cuts, USD will gradually weaken.
Focus on market reactions to liquidity data such as RRP and M2.
If RRP drops drastically & M2 rises, USD weakens.
If the Fed maintains QT & high interest rates, USD remains stable.
Pay attention to the next FOMC Meeting & liquidity data (M2 & RRP) for further USD trend confirmation.
Important Note: Treat the above analysis as a fundamental basis in making your trading decisions. It is suitable for swing traders, but for the short term, it is important to consider geopolitical factors.
ICEUS:DXY ICEUS:DX1!
