Dollar Index Analysis – Trump, Hegemony & a Dangerous Disconnect🇺🇸💣 Dollar Index Analysis – Trump, Hegemony & a Dangerous Disconnect 📉⚠️
Hey Traders,
FXPROFESSOR here with a deep-dive update on the Dollar Index (DXY) – and this one hits both technicals and macro geopolitics.
🧠 Macro Context:
For decades, the U.S. strategically outsourced much of its basic manufacturing capacity to China—everything from screws, cables, plastics, and circuit boards. This freed America to focus on high-margin sectors like technology, finance, and defense innovation.
But this efficiency came at a cost: dependency. You can't be the military and economic hegemon of the world if you don’t manufacture your own basic components. That’s the foundation of hard power—and Trump understands this well.
🔁 Now Trump is trying to reverse that.
He knows America can’t win long-term without reclaiming production and export competitiveness – and a strong dollar kills that dream.
So what’s the play?
✅ Trump brings the volatility
✅ Fed stays cautious
✅ Dollar weakens... but without actual rate cuts
That’s the scary part 👇
📉 💵 Dollar Strength vs. Treasury Stress
This is also why the U.S. Treasury market is under stress. If the U.S. wants to rebuild domestic production, reduce trade deficits, and support massive fiscal spending, it needs to weaken the dollar and attract internal capital—not depend on foreign buyers of debt.
A strong dollar = trade imbalance, hollowed industry, and rising debt service costs.
A normalized dollar = controlled exports, internal manufacturing, and a potential realignment of global capital flows.
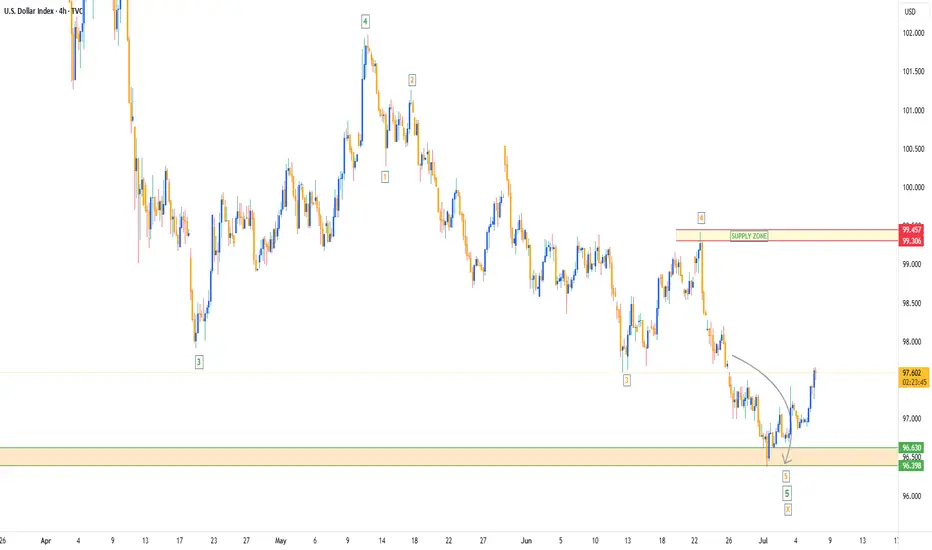
📉 The Chart: "The Year of the Normalized Dollar"
🟡 This is a continuation of the same chart I published over a year ago.
Key Rejection Zone: 100.965 (former support, now resistance)
Current Trajectory: Approaching my long-held target at 94.677
Macro Message: The dollar is dropping without a Fed pivot
Worrying Signal: If we hit major support while the Fed stays tight... the entire market may need to reprice expectations. That could shake equities and crypto alike.
🧊 This is not a clean-cut dollar short anymore . It’s already priced in, and that’s why I’m spooked.
🧭 What I’m Watching:
Will Trump’s trade war accelerate this move?
Will Powell finally cut in September—or double down?
Will the support at 94.5 hold, or break and open a much larger macro shift?
This chart is no longer just technical. It’s political. It’s strategic. It’s a chessboard for hegemony.
🎥 FULL 20-min video breakdown is now live!
I cover DXY, Bitcoin, tech stocks, gold, silver, DAX, BTC.D and much more
Watch it if you want the full map of what I’m thinking this week.
One Love,
The FXPROFESSOR 💙
Disclosure: I am happy to be part of the Trade Nation's Influencer program and receive a monthly fee for using their TradingView charts in my analysis. Awesome broker, where the trader really comes first! 🌟🤝📈
DXY

30M Insight: EURUSD Buy Limit ReadyGood Mornıng Traders;☀️
Based on a 30-minute analysis, I’ve identified a shift in EURUSD market structure. I’ll be waiting for price to reach my level with a buy limit order.
📥 BUY LIMIT ORDER: 1.17180
🛑 STOP LOSS: 1.16946
🎯 TP1: 1.17275
🎯 TP2: 1.17412
🎯 TP3: 1.17649
📊 Risk / Reward Ratio: 2.00
Patience meets precision. Let the market come to you.
🧠 Master your mindset with iron discipline.
Never fear the trade—let the trade fear you.
Keep your motivation high and your focus sharper than ever.
-----
Your likes and support are what keep me motivated to share these analyses consistently.
Huge thanks to everyone who shows love and appreciation! 🙏

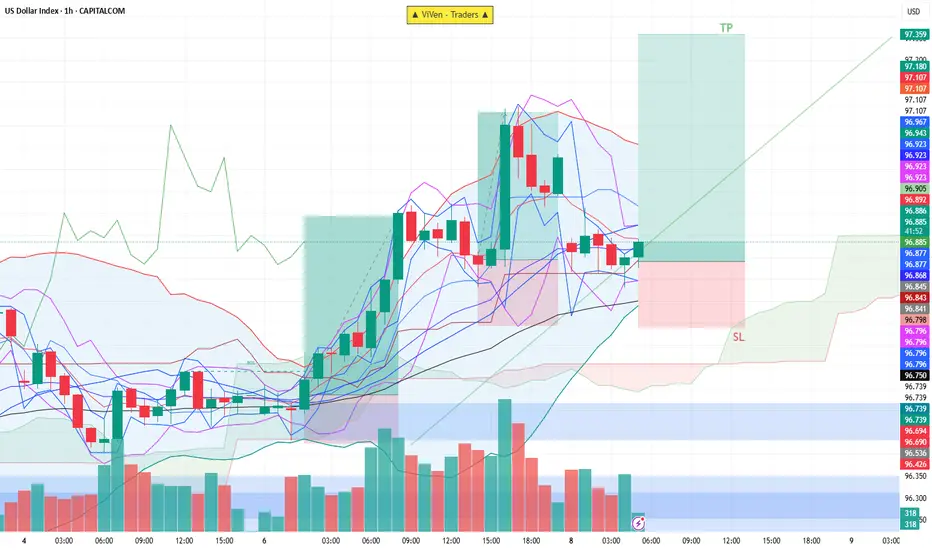
DXY Trade Setup✅ Trade Setup Details:
Entry: 96.850
Stop Loss (SL): 96.650
Take Profit (TP): 97.350
✅ This is a good RRR. A 2.5:1 ratio means you're risking $1 to potentially earn $2.50 — favorable for consistent trading.
📈 Chart & Technical Analysis (based on your image):
✅ Entry is near the middle Bollinger Band and above Ichimoku cloud — a technical support zone.
✅ SL is placed below recent support and Ichimoku base, giving some buffer in case of volatility.
✅ TP at 97.350 aligns with the recent swing high or top of the breakout channel.
⚠️ Things to Watch:
If DXY drops below 96.700, it may signal weakness or a shift in sentiment — watch volume and price reaction.
If price stays above cloud and rising trendline, your trade remains valid.
🟢 Summary:
Bias: Bullish
Setup: Good technical entry with solid support below and clear resistance target.
Risk-to-Reward: Excellent (2.5:1)
Strategy: Hold unless price breaks below 96.650 with volume.
EURO to see a MAJOR DECLINE as US$ RALLIES The chart posted is that of the Euro as you can see the targets based on fib relationship was just seen ! I have moved LONG DXY 96.70 and will remain Long dxy until I see an ALT otherwise the DXY should rally into OCT 10th best of trades WAVETIMER

Gbpusd long scalpWaiting confirmation with close above 1.35565, entry will at retest of that level for trade #7.
So far 6 out of 100 trades.
5 losses 1 win.

BIG BEAUTIFUL BILL - Markets are Ready to PUMP Again! At the 4th of July, the Independence Day, the "One Big Beautiful Bill Act" was signed into law by President Trump. In this idea I want to take a closer look at some points of this law and explain why I consider it VERY bullish for most of financial markets, and especially for crypto.
Here are some key points of the law:
Raises the U.S. debt ceiling by $5 trillion, the largest single increase in U.S. history
Makes many Trump-era 2017 tax cuts permanent: keeps lower individual tax rates, preserves expanded standard deduction, retains corporate tax rate at 21%
Introduces new tax breaks: increases Child Tax Credit, exempts tips, overtime, and Social Security from federal income tax (with limitations)
Adds ~$150 billion to defense and another $150 billion toward border enforcement, including massive ICE budget increase
Trims SNAP food aid by ~$186–200 billion, tightening eligibility (e.g. raising work‑requirement age)
What changes can happen in the economy? Big tax breaks combined with increased expenses cause the growth of financial deficit, the projected by CBO deficit can reach $3 trillion. In this situation the only solution is increasing the national debt which makes Interest Rates climb higher (Yale’s Budget Lab forecasts a 1.2 pp increase in the 10‑year yield).
Why do I think this is bullish for most of stocks and mainly for crypto?
The increase of debt ceiling has always had a positive impact on the crypto and namely on $BTC. The best example is Fiscal Responsibility Act that was signed back in June 5, 2023. This act increased the debt ceiling for +$4.7 billion, after that Bitcoin surged upwards from $25,000 to $75,000 in ~half a year. Similar outcome can be expected now too.
Market perceives U.S. fiscal loosening as inflationary and dollar-weakening, making Bitcoin (as a decentralized and limited-supply asset) more attractive. TVC:DXY has already shown signs of weakness.
Large deficits often force future monetary easing or Fed bond buying to absorb debt. Lower interest rates and more liquidity are historically bullish for risk assets, including crypto.
Rising yields and bond sell-offs spook traditional markets. In this situation, Bitcoin becomes an attractive uncorrelated hedge for portfolios amid volatility in traditional assets.
To sum up , I believe the Big Beautiful Law is, to put it mildly, not good for US economy. However, local effects on stock & crypto markets can be considered positive for investors & traders. With this said, I believe we can expect CRYPTOCAP:BTC to reach $150,000 goal this year and mark this milestone as an ATH for the current bull cycle.

GOLD - SHORT TO $2,800 (UPDATE)Gold once again last night came back to test our resistance zone, after huge bullish momentum all yesterday. But again we saw a bearish rejection from our ‘supply zone’, pushing price back down 300 PIPS.
Being extremely careful here, as Gold is currently at a make or break sort of area.

GBP/USD - Bearish Channel (07.07.2025)The GBP/USD Pair on the M30 timeframe presents a Potential Selling Opportunity due to a recent Formation of a Bearish Channel Pattern. This suggests a shift in momentum towards the downside in the coming hours.
Possible Short Trade:
Entry: Consider Entering A Short Position around Trendline Of The Pattern.
Target Levels:
1st Support – 1.3545
2nd Support – 1.3485
🎁 Please hit the like button and
🎁 Leave a comment to support for My Post !
Your likes and comments are incredibly motivating and will encourage me to share more analysis with you.
Best Regards, KABHI_TA_TRADING
Thank you.
Disclosure: I am part of Trade Nation's Influencer program and receive a monthly fee for using their TradingView charts in my analysis.

Gbpusd long scalp Same idea as previous post, I want to see a close above 1.35832 and a return into that level would be my entry. 3 targets as depicted.

Gbpusd long scalpWe've taken some sellside liquidity. I am expecting price revert back into the range. Simulated trade #6 already triggered at 1.35792 any return into this level would be a good entry or near this level allowing 3 pips.

EURUSD Short, 08 JulyHTF Bearish Continuation & Intraday Confirmation
HTF bias remains bearish, reacting from W/D OB and completing the daily imbalance left from yesterday. Now looking for continuation lower, supported by a clean 4H OB.
📉 Confluence:
15m Decisional OB in play
5m OB entry zone with a clean 1m BOS
DXY gap + imbalance still open in our favor + Correlation between EU and DXY
Asia session structure aligned
🎯 Entry: Retest of 5m OB after 1m BOS
🛡️ SL: Above recent high, ~10 pips
📌 TP: Asia low – 1:3 RR
⚠️ Risk: OB is mid-Asia (less ideal), and DXY Daily imbalance not filled yet
Still a solid setup with structure + HTF narrative backing it.

Gbpusd short scalp I will consider a short only if pull back happens prior to target 1 being a traded to.
I like the downward monetum this morning.
4 losses 1 win for the simulated scalps. If this one is triggered it is the 6th scalp out of 100

Dollar Index-Stops At Gap ResistanceAfter just a temporary setback in stocks and a brief move higher in the dollar earlier this week, we’re once again seeing a strong reversal across the board. This comes after Donald Trump extended the July 9th tariff deadline to August 1st, giving more time for trade negotiations with various countries. That brought some optimism back into the markets, and if stocks continue to gain, the dollar index is likely to remain in its downtrend.
In fact, the dollar index stopped right at the June 26th gap near the 97.70 resistance level. We believe that the corrective price action from July 1st could now be coming to an end, and the market may resume lower—especially if we get a breakout below the corrective channel support near 97.
GH

08.07.25 Morning ForecastPairs on Watch -
FX:EURUSD
FX:USDJPY
A short overview of the instruments I am looking at for today, multi-timeframe analysis down to what I will be looking at for an entry. Enjoy!

Gold will continue with its bullish breakoutLooking for new highs to be made. Price has pushed bullish as trump started talking about the tariffs early today. Even though they are not supposed to discuss till the 9th. We can get a early move for the week. Monitoring the price action to see if I can get in where I fit in!

DXY Short From Resistance! Sell!
Hello,Traders!
DXY made a nice rebound
From the lows but will soon
Hit a horizontal resistance
Around 97.900 from where
We will be expecting a
Local bearish correction
Sell!
Comment and subscribe to help us grow!
Check out other forecasts below too!
Disclosure: I am part of Trade Nation's Influencer program and receive a monthly fee for using their TradingView charts in my analysis.

Dollar Index OverviewThe Dollar moving as we expect it to within the Gold Fund! As soon as we saw a '5 Bearish Wave Completion' on the DXY, straight away buyers entered the market & start pushing price back up.
My Gold Fund investors & Gold Vault Academy students know from our 'Q3 Market Breakdown Report' what we're expecting for the Dollar in the next 3 months.
Major resistance level ahead?US Dollar Index (DXY) is rising towards the pivot and could reverse to the 1st support.
Pivot: 97.90
1st Support: 96.46
1st Resistance: 98.57
Risk Warning:
Trading Forex and CFDs carries a high level of risk to your capital and you should only trade with money you can afford to lose. Trading Forex and CFDs may not be suitable for all investors, so please ensure that you fully understand the risks involved and seek independent advice if necessary.
Disclaimer:
The above opinions given constitute general market commentary, and do not constitute the opinion or advice of IC Markets or any form of personal or investment advice.
Any opinions, news, research, analyses, prices, other information, or links to third-party sites contained on this website are provided on an "as-is" basis, are intended only to be informative, is not an advice nor a recommendation, nor research, or a record of our trading prices, or an offer of, or solicitation for a transaction in any financial instrument and thus should not be treated as such. The information provided does not involve any specific investment objectives, financial situation and needs of any specific person who may receive it. Please be aware, that past performance is not a reliable indicator of future performance and/or results. Past Performance or Forward-looking scenarios based upon the reasonable beliefs of the third-party provider are not a guarantee of future performance. Actual results may differ materially from those anticipated in forward-looking or past performance statements. IC Markets makes no representation or warranty and assumes no liability as to the accuracy or completeness of the information provided, nor any loss arising from any investment based on a recommendation, forecast or any information supplied by any third-party.

DXY: Bears Are Winning! Short!
My dear friends,
Today we will analyse DXY together☺️
The recent price action suggests a shift in mid-term momentum. A break below the current local range around 96.860 will confirm the new direction downwards with the target being the next key level of 96.760.and a reconvened placement of a stop-loss beyond the range.
❤️Sending you lots of Love and Hugs❤️

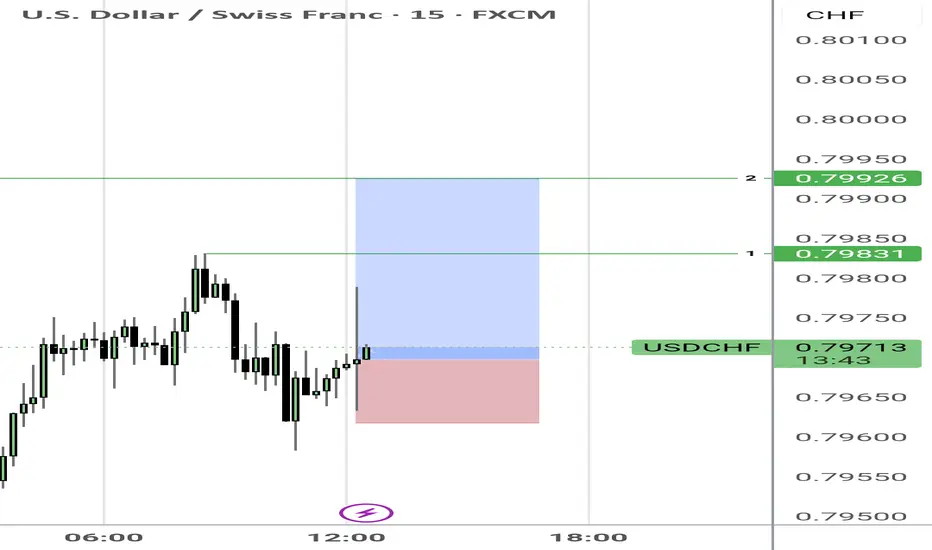
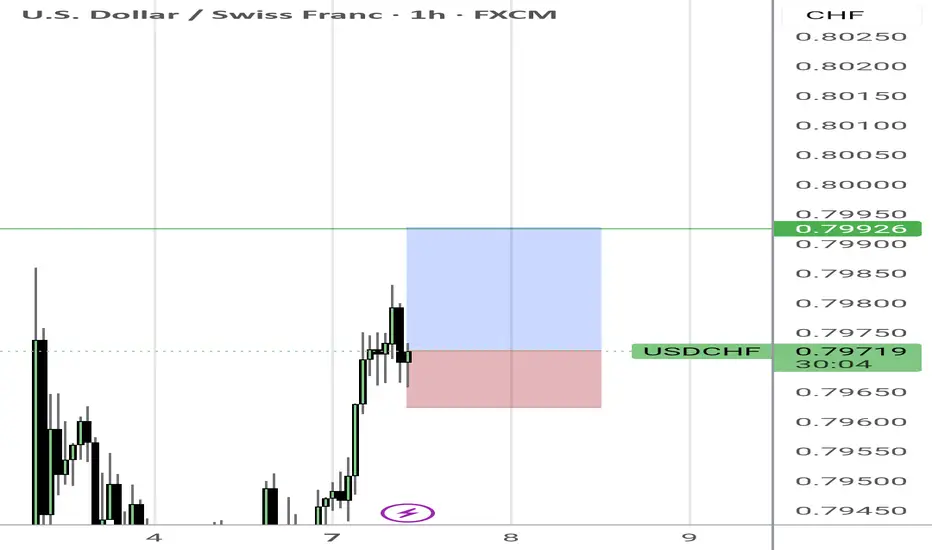
Usdchf long scalpI like the clear rejection of last time's bias at 50% of range.
We are hovering near equal highs.
I like to simulate a buy from here. This is the second simulation.
Follow for more. I plan to simulate 100 simulations of trades for entertainment purposes if I get the support.
SELL USDJPYIn todays session we are monitoring USDJPY for selling opportunity. Our entry is at 145.746 and our stops are above 146.357 . Our targets is 143.376. Use proper risk management. Cheers

What’s EURUSD Telling Us on the 30-Minute Chart?🌅 Good morning, my friends,
EURUSD just made a pullback within the last 30 minutes, so I entered a sell position based on that move.
🎯 Targets:
- TP1: 1.17607
- TP2: 1.17475
- TP3: 1.17174
🛑 Stop Loss: 1.17938
📊 Risk/Reward Ratio: 2.00
Your likes and support are what keep me motivated to share these analyses consistently.
Huge thanks to everyone who shows love and appreciation! 🙏
