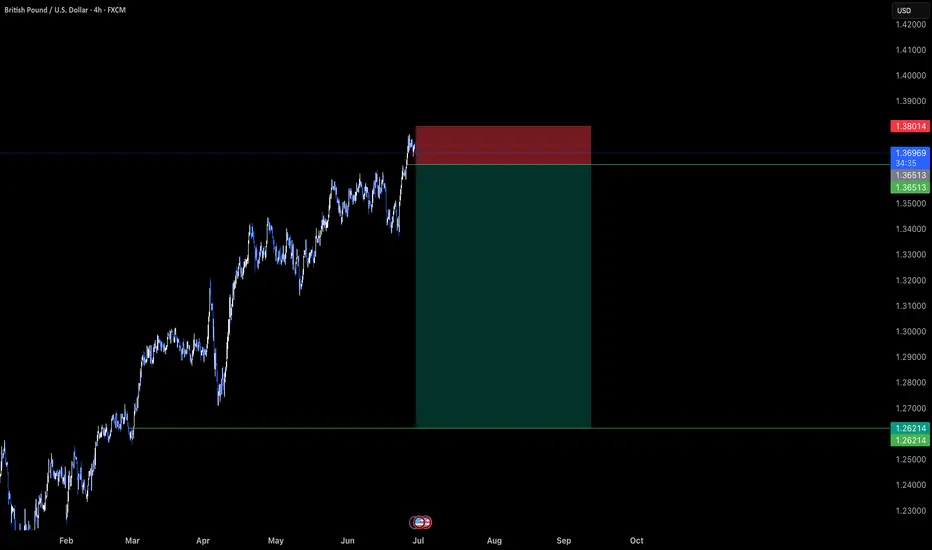
Gbpusd short idea I like this premium zone.
I am looking at 1.36544 to 1.36498 as good price to sell from.
Target is still same, refer to previous post.
DXY

Gold is Pushing Bullish but is it really ready???This looks like a early move to move full on bullish. I feel like it might need to sweep the low from mid week before they really ready to go bullish. waiting for things to show a bit more clear during the Kill Zone.

A Dollar in Freefall and a Bitcoin on the Brink
In the grand theater of global finance, narratives rarely align with perfect symmetry. The market is a complex ecosystem of competing forces, a cacophony of signals where long-term tectonic shifts can be momentarily drowned out by the piercing alarms of short-term volatility. Today, we stand at the precipice of one of the most profound and fascinating divergences in modern financial history, a story of two assets locked in an inverse dance, each telling a radically different tale about the immediate future.
On one side of this chasm stands the titan of the old world, the U.S. Dollar. The bedrock of global commerce, the world’s undisputed reserve currency for nearly a century, is in a state of unprecedented crisis. The U.S. Dollar Index (DXY), the globally recognized measure of the greenback’s strength against a basket of other major currencies, is in freefall. It is suffering its most catastrophic crash since 1991, and by some measures, is enduring its worst year since the historic turmoil of 1973. This is not a minor correction; it is a fundamental challenge to the dollar’s hegemony, a macro-level event driven by seismic shifts in U.S. economic policy, including aggressive trade tariffs and ballooning government deficits. For the world of alternative assets, a collapsing dollar is the loudest possible bullhorn, a clarion call to seek refuge in stores of value that lie beyond the reach of any single government.
On the other side of the chasm is the digital challenger, Bitcoin. Born from the ashes of the 2008 financial crisis as an answer to the very monetary debasement the dollar is now experiencing, Bitcoin should, by all fundamental logic, be soaring. The dollar’s demise is the very thesis upon which Bitcoin’s value proposition is built. And yet, while the long-term case has never looked stronger, the short-term picture is fraught with peril. A close reading of its technical chart reveals a market showing signs of exhaustion. A key momentum indicator, the stochastic oscillator, is flashing a stark warning, suggesting that the digital asset, far from rocketing to new highs, could be on the verge of a significant drop, a painful correction that could pull its price back below the psychological threshold of $100,000.
This is the great divergence. The macro-economic landscape is screaming for a flight to safety into hard assets like Bitcoin, while the micro-level technicals of Bitcoin itself are suggesting an imminent storm. It is a battle between the long-term fundamental signal and the short-term technical noise, a dilemma that forces every market participant to ask themselves a critical question: In a world where the old rules are breaking down, do you trust the map or the compass?
Chapter 1: The Fall of a Titan - Deconstructing the Dollar's Demise
To understand the magnitude of Bitcoin’s long-term promise, one must first dissect the anatomy of the dollar’s current collapse. The U.S. Dollar Index, or DXY, is not merely a measure of the dollar against a single currency; it is a weighted average of its value relative to a basket of six major world currencies: the Euro, the Japanese Yen, the British Pound, the Canadian Dollar, the Swedish Krona, and the Swiss Franc. Its movement is a reflection of global confidence in the U.S. economy and its stewardship. For this index to suffer its worst crash since 1991 is a historic event. To be on pace for its worst year since 1973 is a paradigm-shifting crisis.
The year 1973 is not a random benchmark. It was the year the Bretton Woods system, which had pegged global currencies to the U.S. dollar (which was in turn pegged to gold), officially died. Its collapse ushered in the modern era of free-floating fiat currencies. For the dollar’s current performance to be compared to that chaotic, system-altering period is to say that the very foundations of the post-1973 monetary order are being shaken.
The catalysts for this historic weakness are rooted in a dramatic shift in American economic policy, largely attributed to the actions of President Donald Trump’s administration. The two primary drivers are a protectionist trade policy and a fiscal policy of burgeoning deficits.
First, the tariffs. The implementation of broad tariffs on imported goods was intended to protect domestic industries and renegotiate trade relationships. However, such measures are a double-edged sword for a nation's currency. They create friction in the intricate web of global supply chains, increase costs for consumers and businesses, and often invite retaliatory tariffs from trading partners. This environment of trade conflict creates economic uncertainty, which can deter foreign investment. When international capital becomes wary of deploying in a country, demand for that country’s currency wanes, putting downward pressure on its value.
Second, and perhaps more fundamentally, are the rising deficits. The U.S. government has been running massive budget deficits, spending far more than it collects in revenue. This debt must be financed. When a country runs a large budget deficit alongside a large current account deficit (importing more than it exports), it becomes heavily reliant on foreign capital to purchase its government bonds. If the world’s appetite for that debt falters, or if the sheer volume of new debt issuance becomes too large to absorb, the nation’s central bank may be implicitly forced to monetize the debt—effectively printing new money to buy the bonds. This expansion of the money supply is the classic recipe for currency debasement.
The combination of trade protectionism and fiscal profligacy has created a perfect storm for the dollar. Global investors, looking at the rising deficits and the unpredictable trade environment, are beginning to question the long-term stability of the dollar as a store of value. This erosion of confidence is what is reflected in the DXY’s historic plunge. A weaker dollar makes U.S. exports cheaper and imports more expensive, but its most profound effect is on the global investment landscape. It forces a worldwide repricing of assets and sends a tidal wave of capital searching for alternatives that can preserve wealth in an era of fiat decay.
Chapter 2: The Digital Phoenix - Bitcoin's Long-Term Bull Case
In the world of finance, every action has an equal and opposite reaction. As the value of the world's primary reserve asset erodes, the value of its antithesis should, in theory, appreciate. Bitcoin is the dollar’s antithesis. Where the dollar’s supply is infinite and subject to the political whims of policymakers, Bitcoin’s supply is finite, transparent, and governed by immutable code. There will only ever be 21 million Bitcoin. This fundamental, mathematically enforced scarcity is the core of its value proposition.
The inverse correlation between the DXY and Bitcoin is one of the most powerful and intuitive relationships in the digital asset space. When the DXY falls, it signifies that the dollar is losing purchasing power relative to other major currencies. For investors around the globe, this means that holding dollars is a losing proposition. They begin to seek out assets that are not denominated in dollars and cannot be debased by the U.S. Federal Reserve. Bitcoin stands as the prime candidate for this capital flight. It is a non-sovereign, globally accessible, digital store of value that operates outside the traditional financial system. A falling dollar is therefore the strongest possible tailwind for Bitcoin, validating its very reason for existence.
This relationship transcends simple price mechanics; it is a philosophical and macroeconomic hedge. Owning Bitcoin is a bet against the long-term viability of the current debt-based fiat monetary system. The dollar’s crash, driven by deficits and monetary expansion, is not a flaw in the system; it is a feature of it. Bitcoin offers an escape hatch. It is a lifeboat for investors who see the iceberg of sovereign debt on the horizon.
This narrative is what has fueled the wave of institutional adoption that has defined the current market cycle. Sophisticated investors and corporations are not allocating to Bitcoin because they are speculating on short-term price movements. They are buying it as a long-term strategic reserve asset, a hedge against the very macroeconomic turmoil that the dollar’s crash represents. They see a world drowning in debt and a global reserve currency being actively devalued, and they are making a calculated, multi-generational bet on a system of verifiable digital scarcity. From this perspective, the long-term bull case for Bitcoin has never been clearer or more compelling. The dollar’s historic weakness is the ultimate validation of the Bitcoin thesis.
Chapter 3: The Ghost in the Machine - Bitcoin's Short-Term Technical Warning
If the story ended with the macro-economic picture, the path forward would be simple. But markets are not simple. They are a reflection of human psychology, a tapestry of fear and greed woven in real-time. While the fundamental, long-term story points resolutely upward, the short-term evidence, as read through the language of technical analysis, is painting a much darker picture.
Technical analysis operates on the principle that all known information, including the bullish macro fundamentals, is already reflected in an asset's price. It seeks to identify patterns and gauge market momentum to predict future movements. One of the most trusted tools for measuring momentum is the stochastic oscillator. It does not measure price or volume itself, but rather the speed and momentum of price changes. Think of it like a car's tachometer: it tells you not how fast you are going, but how hard the engine is working to maintain that speed.
The stochastic oscillator operates on a scale of 0 to 100. A reading above 80 is considered "overbought," suggesting the asset has moved up too quickly and the rally may be running out of steam. A reading below 20 is considered "oversold," suggesting a decline may be exhausted. The current technical analysis of Bitcoin’s chart reveals a deeply concerning signal from this indicator.
Despite the overwhelmingly bullish news of the dollar’s collapse, Bitcoin’s price momentum is reportedly waning. The stochastic oscillator is likely showing what is known as a "bearish divergence." This occurs when the price of an asset pushes to a new high, but the oscillator fails to do so, creating a lower high. This is a classic warning sign. It’s the market’s equivalent of a car’s engine sputtering and revving less intensely even as the driver pushes the accelerator to the floor. It suggests that the underlying buying pressure is weakening, that the rally is becoming exhausted, and that a reversal or significant correction may be imminent.
The technical forecast of a potential drop below the $100,000 level stems directly from this type of signal. It implies that the recent price strength is not supported by genuine momentum and that the market is vulnerable. Why would this happen when the fundamental news is so positive? There are several possibilities. Short-term traders who bought at lower prices may be taking profits. The market may be flushing out over-leveraged long positions, triggering a cascade of liquidations. Or, it could simply be the natural rhythm of a market. No asset moves up in a straight line. Even the most powerful bull trends require periods of consolidation and correction to shake out weak hands, build a stronger base of support, and gather energy for the next major advance. A pullback to below $100,000, while painful for those who bought at the top, could be a perfectly healthy and necessary event in the context of a much larger, multi-year bull market.
Chapter 4: Reconciling the Irreconcilable - The Investor's Dilemma
This great divergence presents every market participant with a profound dilemma, forcing a clear-eyed assessment of their own investment philosophy and time horizon. The market is speaking in two different languages simultaneously, and the message you hear depends on the language you choose to listen to.
For the long-term investor, the individual or institution with a five, ten, or twenty-year outlook, the story is clear. The historic crash of the U.S. dollar is the signal. It is the fundamental, world-altering event that confirms their thesis. The debasement of the world’s reserve currency is a generational opportunity to allocate capital to a superior, non-sovereign store of value. From this vantage point, the bearish reading on a short-term stochastic oscillator is, at best, irrelevant noise. It is the momentary turbulence felt on a flight destined for a much higher altitude. The strategy for this investor is one of conviction. They may choose to ignore the short-term dip entirely, or more likely, view it as a gift—a final opportunity to accumulate more of a scarce asset at a discount before the full force of the dollar’s crisis is felt in the market. Their actions are guided by the macro map, not the short-term compass.
For the short-term trader, the world looks entirely different. Their time horizon is measured in days, weeks, or months, not years. For them, the bearish divergence on the stochastic oscillator is the signal. The macro story of the dollar’s decline is merely the background context. Their primary concern is managing risk and capitalizing on immediate price swings. A warning of a potential drop below $100,000 is an actionable piece of intelligence. It might prompt them to take profits on existing long positions, hedge their portfolio with derivatives, or even initiate a short position to profit from the anticipated decline. Their survival depends on their ability to react to the compass of market momentum, regardless of the map’s ultimate destination.
The most sophisticated market participants, however, attempt to synthesize these two perspectives. They recognize that the long-term macro trend provides the overarching directional bias, while the short-term technicals provide the tactical roadmap for navigating that trend. Such an investor would maintain a core long position in Bitcoin, acknowledging the powerful tailwind of the dollar’s collapse. However, they would use the technical signals to actively manage their position and optimize their entries and exits. They might trim their position when the stochastic indicator signals overbought conditions, taking some profit off the table to reduce risk. They would then stand ready to redeploy that capital and add to their core holding when the technicals signal oversold conditions after the very correction they anticipated. This approach allows them to maintain their long-term conviction while respecting the short-term risks, blending the art of the trader with the discipline of the investor.
Conclusion: The Signal and the Noise
The financial markets are standing at a historic crossroads. The U.S. dollar, the sun around which the global monetary system has orbited for generations, is dimming. Its historic crash is a signal of the highest order, a fundamental warning that the era of unchallenged fiat dominance is facing its most serious test. This decay is creating a powerful gravitational pull toward assets defined by scarcity and sovereignty, with Bitcoin as the undisputed digital leader. This is the signal.
Simultaneously, the internal mechanics of the Bitcoin market are showing signs of short-term fatigue. The warnings from technical indicators like the stochastic oscillator are a reminder that no market is immune to the laws of gravity, that periods of profit-taking and consolidation are a natural and healthy part of any long-term advance. This is the noise.
The great challenge, and the great opportunity, for every investor today is to learn to distinguish between the two. The collapse of the dollar is a paradigm shift, while the potential drop in Bitcoin’s price is a cyclical correction. The former defines the destination; the latter describes the terrain along the way. The current divergence is a test of thesis, of timeframe, and of temperament. Those who are shaken out by the short-term noise will likely miss the long-term signal. But those who understand that the dollar’s fall is the very reason for Bitcoin’s rise, and who have the conviction to see the short-term turbulence for what it is, will be best positioned to navigate this great divergence and witness the dawn of a new financial landscape.

dollar elliott wave countingdxy is falling since it peaked in Q4 2022
since their last 75bps hike dollar is constantly falling and stocks, gold, bitcoin constantly rising and making new all time high
wave W = wave Y
(equal in length, 100% projection for wave Y)
since starting of the year due to trump tariff dollar is falling
this is year in first half dollar saw biggest collapse since end of gold standard
now 100% projection target for wave Y at 95 area is big static support level
if dxy recover back to 100 area then this will be first sign of reversal

GBPUSD - OUTLOOK This is my technical perspective on GBPUSD.
Fundamentally expecting the Dollar to strengthen in the coming weeks
"May fortune attend thee, and thy trade prosper." .......L2Earned
EURAUD -0.7% Short and AUDUSD MistakeA short position taken on EURAUD for a small loss after manually closing before swaps. I have also included a breakdown of a +4% AUDUSD long I was looking at taking but a small error on my behalf that caused me to stay out of the trade. Full explanation as to why I executed on this position and made the decision to manually close at the level I did.
Any questions you have just drop them below 👇

DXYDXY price has come down to test the important support zone 96-95. If the price cannot break through the 95 level, it is expected that the price will rebound. Consider buying the red zone.
🔥Trading futures, forex, CFDs and stocks carries a risk of loss.
Please consider carefully whether such trading is suitable for you.
>>GooD Luck 😊
❤️ Like and subscribe to never miss a new idea!

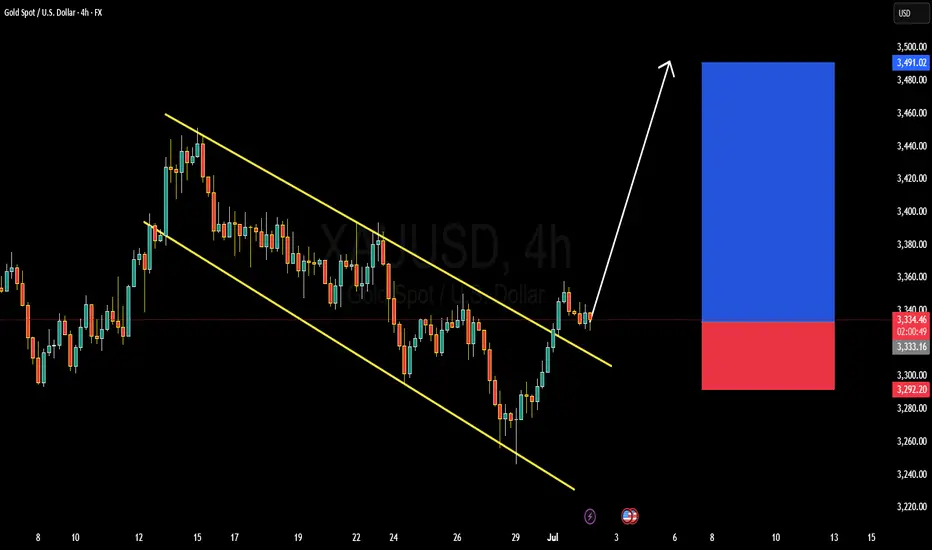
XAUUSD BULLISH OR BEARISH DETAILED ANALYSISXAUUSD has officially broken out of a well-structured descending channel on the 4H timeframe, suggesting a potential shift in market sentiment from bearish to bullish. After multiple rejections from the lower boundary and consistent pressure on the upper trendline, the breakout above the channel confirms a strong upside bias. Price is currently holding near 3330, and I’m now eyeing 3450 as the next key resistance level. This setup aligns perfectly with a textbook channel breakout, offering a solid risk-to-reward scenario for bullish continuation.
The breakout comes at a time when macro fundamentals are supportive of gold strength. With rising uncertainty surrounding global inflation trends and mixed economic signals from the US, investors are leaning back into gold as a defensive hedge. The US dollar has shown signs of softening amid increasing speculation that the Fed could pivot to a more neutral stance in the coming months. This gives gold more breathing room to the upside, especially as real yields begin to flatten out.
Geopolitical tensions, especially renewed volatility around global trade and Middle East developments, are further fueling demand for safe-haven assets like XAUUSD. The recent breakout is backed by rising volume and momentum indicators turning bullish, making this move more sustainable than a short-term spike. Gold typically thrives during periods of uncertainty and shifting rate expectations, and that’s exactly the phase we are entering now.
From a technical and macroeconomic perspective, gold is showing strength just as the broader markets begin to wobble. This breakout isn’t just about structure—it’s supported by real macro catalysts and seasonal demand strength. I'm bullish toward the 3450 zone, and any retest of the broken channel resistance now turned support would offer an attractive entry. Staying focused on gold as a top performer in Q3 could offer strong upside with controlled risk.
XAUUSD Free Signal: Bullish Breakout!!!Hello everyone.
I’m sharing a trade setup for GOLD.
Gold has shown strong bullish momentum this week. Picture is simple, The setup is straightforward: I’m following the gold uptrend, targeting last week’s high.
Type: Buy (Long)
Entry: $3,343 (after price breaks resistance at $3,340)
Stop Loss (SL): $3,328 (below the recent swing high)
Take Profit (TP): $3,393 (targeting last week’s high)
Risk-Reward Ratio: 1:3.3 (risking $15 to gain $50)
This trade offers a high reward, low risk (1:3 risk-reward ratio). Gold shows buyers dominating and sellers weakening. Additionally, the US dollar index (DXY) is in a strong bearish trend. On higher timeframes (1W, 1D), gold’s recent move appears to be a slow correction, supporting my long position.
What do you think of this gold setup? Share your thoughts in the comments! Follow for more free signals, and like if you’re taking this trade!
Disclaimer: This is not financial advice. Trading involves risks. Always do your own research and manage your risk carefully.

USD Roadmap: Bullish Recovery or Structural Breakdown?TVC:DXY CAPITALCOM:DXY
🟢 Scenario A – Bullish Rebound (Red Arrow Up):
Price bounces from the lower channel and breaks toward:
107.348, 110.176, or even 111.901 resistance area.
If the dollar is supported by China buying USD, hawkish Fed, or geopolitical tensions, this scenario gains weight.
🔸 Resistance: Blue downward-sloping line (possible trendline resistance or lower high area)
🔸 Risk: Price could form a lower high and then reverse.
🔴 Scenario B – Bearish Breakdown (Red Arrow Down):
If the USD fails to break above resistance (around 107–112) and gets rejected…
Then we see a move back down, possibly breaking the long-term channel, aiming for the lower diagonal support zone or even sub-92.
🔸 This would signal a major shift in USD strength, possibly driven by:
Fed rate cuts
Global de-dollarization
China not supporting USD
Stronger EUR or CNY

Dollar Index Bearish to $96The DXY has been in a downtrend for a while & that bearish pressure is not over yet. I expect more bearish downside towards the $96 zone, before we can re-analyse the market for any signs of bullish takeover.
⭕️Major Wave 3 Impulse Move Complete.
⭕️Major Wave 4 Corrective Move Complete.
⭕️Minor 4 Waves of Major Wave 5 Complete, With Minor Wave 5 Yet Pending.

GBPJPY H4 XABCD Short at Market TP Below Market🔸Hello traders, let's review the 4 hour chart for GBPJPY. Strong gains off the lows recently, however price getting overextended and expecting reversal later at/near PRZ/D.
🔸Speculative XABCD structure defined by point X 199 point A 188 point B 195.20 point C 186.80 point D/PRZ 198.40/80 .
🔸Currently most points validated, point D/PRZ validated as well.
Short sell at market SL over point D/PRZ TP details see chart
🔸Recommended strategy for GJ traders: Short Sell at Market
SL over point D/PRZ TP1 193.30 TP2 191.00 TP3 188.80.
🎁Please hit the like button and
🎁Leave a comment to support our team!
RISK DISCLAIMER:
Trading Futures , Forex, CFDs and Stocks involves a risk of loss.
Please consider carefully if such trading is appropriate for you.
Past performance is not indicative of future results.
Always limit your leverage and use tight stop loss.

Critical Channel Watch Begins on the 1-Hour Chart of USDJPY.Hey everyone,
📉 My Latest USDJPY Analysis:
USDJPY is currently moving within a downtrend. If the price breaks below the lower boundary of the parallel channel, our first target level will be 142.910. The most crucial factor here is the downward breakout of that channel—don’t overlook it.
Also, keep a close eye on key economic data releases on the fundamental side, as they could significantly influence your strategy.
I meticulously prepare these analyses for you, and I sincerely appreciate your support through likes. Every like from you is my biggest motivation to continue sharing my analyses.
I’m truly grateful for each of you—love to all my followers💙💙💙

USD/JPY Bearish Flag (30.06.2025)The USD/JPY Pair on the M30 timeframe presents a Potential Selling Opportunity due to a recent Formation of a Bearish Flag Breakout Pattern. This suggests a shift in momentum towards the downside in the coming hours.
Possible Short Trade:
Entry: Consider Entering A Short Position around Trendline Of The Pattern.
Target Levels:
1st Support – 143.40
2nd Support – 142.86
🎁 Please hit the like button and
🎁 Leave a comment to support for My Post !
Your likes and comments are incredibly motivating and will encourage me to share more analysis with you.
Best Regards, KABHI_TA_TRADING
Thank you.
Disclosure: I am part of Trade Nation's Influencer program and receive a monthly fee for using their TradingView charts in my analysis.

S&P 500 Outlook. Best Quarter Since 2023… But What Next?The S&P 500 just logged its best quarterly performance since Q4 2023 , surging on optimism around global trade negotiations and growing expectations that the Fed may begin cutting rates as early as September. US futures are green this morning, thanks to developments like Canada backing off digital taxes, ongoing dialogues with China ahead of the July 9 deadline, and risk-on sentiment is pushing yields and the dollar lower.
But as traders, we need to ask:
Are we witnessing a genuine economic inflection point? Or is this just a liquidity-driven rally that’s pricing in a best-case scenario?
Technical View
Support Zone: 6,150 was just broken through. And 6000, the round number level, coinciding with the 20-day EMA and previous swing level.
Resistance Levels: 6,235 is the next critical ceiling, a clean breakout could see price reach the extension level of 6,415.
Momentum Indicators: RSI remains elevated and is creeping toward the overbought. While momentum is strong, watch out for the possible development of a divergence.
Possible Scenarios
The 'Soft Landing’ Is Now the Base Case
Markets are trading as if the Fed has successfully engineered a soft landing. But that’s now fully priced in, and historically, the most dangerous trades are the ones everyone agrees on. If trade talks stall, inflation re-accelerates, or earnings disappoint, the reversal could be brutal and fast.
Risk-on Sentiment Without Volume Is a Yellow Flag
Despite the price strength, volume has been tapering off. The S&P’s recent leg up occurred on lighter-than-average participation, suggesting institutions may be watching, not chasing. That’s often the case in low-volatility summers, but it also implies that any negative catalyst could cause outsized downside moves.
Macro-Fundamentals May Not Justify Valuation Expansion
Yes, inflation is slowing, and the Fed might cut. But if they do, it’s likely because growth is weakening, not because the economy is roaring. So the very condition that triggers rate cuts could also cap earnings growth!
Projection
Bullish Scenario: A confirmed breakout above 6,280 could carry us toward 6,400–6,500 by mid-Q3, especially if the trade deals progress, July inflation comes in soft, and the Fed signals accommodation.
Bearish Risk: If price fails to hold above 6,120, especially if trade optimism fades, or inflation growth spikes or Fed rhetoric shifts hawkish again, this could then open a quick pullback toward 6,000 or lower, which also aligns with the 50-day SMA.
Key Events to Watch
July 9 Trade Talks Deadline: Any sign of stalling could bring volatility back fast.
June CPI Print (July 10): Crucial for confirming the Fed's next move.
Earnings Season Kickoff (mid-July): Tech-heavy expectations may not be easy to beat after such a strong run.
Conclusion
A record-setting quarter is impressive but not necessarily predictive. This quarter’s rally has been built more on relief and expectations than hard data. When expectations (not earnings) are doing the heavy lifting, any misstep from central banks or geopolitics could unravel gains rapidly.
A rate cut might be delayed, or inflation re-accelerates, or trade talks stall; any of these could leave equities hanging. Remember: the higher the climb without real earnings growth, the harder the fall when sentiment shifts. It's not just about the chart. It is about the narrative behind the price.
What’s your bias for Q3?
Are you buying this breakout or fading the optimism? Drop your thoughts below.

SELL FIBERAfter yesterdays stop out we are at it again, we believe EURUSD bears will step in at current prices. Our sell entry is at 1.17100 our TIGHT stop loss is at 1.17500 and target is as low as 1.14500 . Use proper risk management and always risk what you can afford to loose. Cheers gang

Whats the Play for the week? Are we bullish?Looking for more bullish activity to continue. Just need to see price confirm if it is indeed ready to proceed. if we can find a solid entry we will rock with it. but not trying to force anything.

DXY USD Dollar Bearish Short term, then bullishI am not a financial advisor. This is not meant to be and does not constitute financial, investment, trading, or any other types of advice or recommendation.

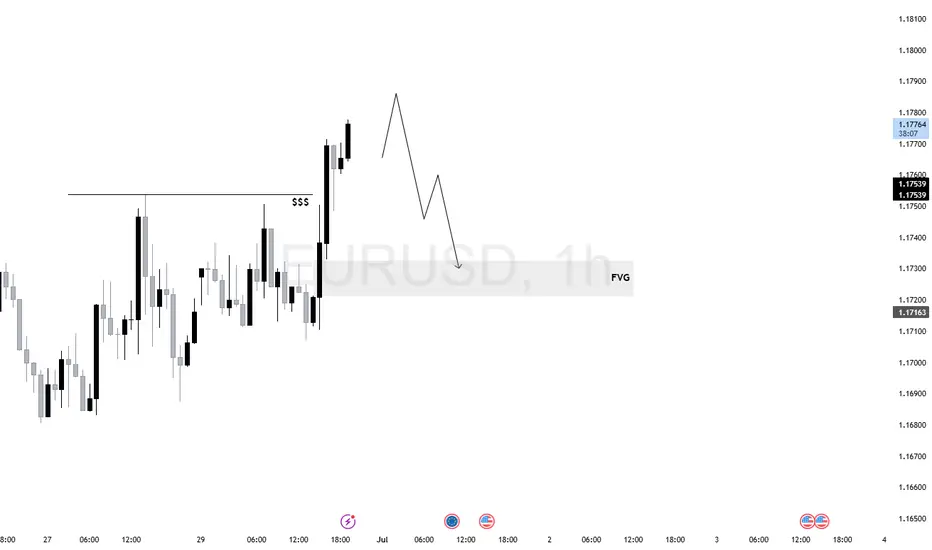
$EU (EURUSD) 1H AnalysisEURUSD swept short-term sell-side liquidity and printed a strong displacement above the relative equal highs.
Price is now in premium territory and likely hunting liquidity before rebalancing.
Bias remains bearish if price fails to form higher-timeframe continuation. Ideal setup would be a short from signs of rejection toward 1.17163 FVG zone.
DXY Game Plan - USD IndexIt is important to watch the DXY to understand the strength of the USD across global markets.
The DXY is a key index that reflects the U.S. dollar’s dominance in foreign exchange. Therefore, tracking it can provide valuable insights into the potential direction of all major asset classes.
In this post, I’ll break down both technical and fundamental expectations.
Technical Analysis
DXY has been in a retracement phase (bearish) since January 2025. During this time, we’ve seen EUR and other major forex pairs form strong bullish trends.
Currently, the DXY is approaching a weekly bullish trendline, where I expect a potential bounce.
Additionally, DXY is trading within a discount zone (below the 0.5 Fibonacci level, also known as equilibrium). Personally, I’m watching for a deeper move into the maximum discount zone (around the 0.75 Fib level).
This area also aligns with key liquidity concepts. Ideally, I want to see a deviation below the bullish trendline, with a sweep of one of the weekly liquidity levels marked on the chart (two black horizontal lines).
I'm not relying on a clean triangle trendline retest, but it's a possibility.
Game Plan
DXY taps the bullish trendline
Deviates below it, running weekly liquidity (black lines)
Hits the max discount zone (~0.75 Fib)
Then shows signs of reversal and strength
Once that setup completes, I’ll be expecting strong USD performance, and will look to short risk assets — including stocks and major forex pairs.
Fundamental Analysis
The Federal Reserve is currently resisting pressure to cut interest rates, while Trump is vocally pushing for rate cuts.
The market is already pricing in a 79% probability of a September rate cut (source: CME FedWatch Tool), so if that happens as expected, I don’t anticipate major market reaction.
However, a surprise rate cut in July would likely trigger a flash crash in DXY/USD — though based on my game plan, I would expect a V-shaped recovery shortly afterward.
EUR, GBP, AUD, and CAD have also hit key resistance zones, so I believe we're likely to see USD strength for a while.

Economic Red Alert: China Dumps $8.2T in US BondsThe Great Unwinding: How a World of Excess Supply and Fading Demand Is Fueling a Crisis of Confidence
The global financial system, long accustomed to the steady hum of predictable economic cycles, is now being jolted by a dissonant chord. It is the sound of a fundamental paradigm shift, a tectonic realignment where the twin forces of overwhelming supply and evaporating demand are grinding against each other, creating fissures in the very bedrock of the world economy. This is not a distant, theoretical threat; its tremors are being felt in real-time. The most recent and dramatic of these tremors was a stark, headline-grabbing move from Beijing: China’s abrupt sale of $8.2 trillion in U.S. Treasuries, a move that coincided with and exacerbated a precipitous decline in the U.S. dollar. While the sale itself is a single data point, it is far more than a routine portfolio adjustment. It is a symptom of a deeper malaise and a powerful accelerant for a crisis of confidence that is spreading through the arteries of global finance. The era of easy growth and limitless demand is over. We have entered the Great Unwinding, a period where the cracks from years of excess are beginning to show, and the consequences will be felt broadly, from sovereign balance sheets to household budgets.
To understand the gravity of the current moment, one must first diagnose the core imbalance plaguing the global economy. It is a classic, almost textbook, economic problem scaled to an unprecedented global level: a glut of supply crashing against a wall of weakening demand. This imbalance was born from the chaotic response to the COVID-19 pandemic. In 2020 and 2021, as governments unleashed trillions in fiscal stimulus and central banks flooded the system with liquidity, a massive demand signal was sent through the global supply chain. Consumers, flush with cash and stuck at home, ordered goods at a voracious pace. Companies, believing this trend was the new normal, ramped up production, chartered their own ships, and built up massive inventories of everything from semiconductors and furniture to automobiles and apparel. The prevailing logic was that demand was insatiable and the primary challenge was overcoming supply-side bottlenecks.
Now, the bullwhip has cracked back with a vengeance. The stimulus has faded, and the landscape has been radically altered by the most aggressive coordinated monetary tightening in modern history. Central banks, led by the U.S. Federal Reserve, hiked interest rates at a blistering pace to combat the very inflation their earlier policies had helped fuel. The effect has been a chilling of economic activity across the board. Demand, once thought to be boundless, has fallen off a cliff. Households, their pandemic-era savings depleted and their purchasing power eroded by stubborn inflation, are now contending with cripplingly high interest rates. The cost of financing a home, a car, or even a credit card balance has soared, forcing a dramatic retrenchment in consumer spending. Businesses, facing the same high borrowing costs, are shelving expansion plans, cutting capital expenditures, and desperately trying to offload the mountains of inventory they accumulated just a year or two prior.
This has created a world of profound excess. Warehouses are overflowing. Shipping rates have collapsed from their pandemic peaks. Companies that were once scrambling for microchips are now announcing production cuts due to a glut. This oversupply is deflationary in nature, putting immense downward pressure on corporate profit margins. Businesses are caught in a vise: their costs remain elevated due to sticky wage inflation and higher energy prices, while their ability to pass on these costs is vanishing as consumer demand evaporates. This is the breeding ground for the "cracks" that are now becoming visible. The first casualties are the so-called "zombie companies"—firms that were only able to survive in a zero-interest-rate environment by constantly refinancing their debt. With borrowing costs now prohibitively high, they are facing a wave of defaults. The commercial real estate sector, already hollowed out by the work-from-home trend, is buckling under the weight of maturing loans that cannot be refinanced on favorable terms. Regional banks, laden with low-yielding, long-duration bonds and exposed to failing commercial property loans, are showing signs of systemic stress. The cracks are not isolated; they are interconnected, threatening a chain reaction of deleveraging and asset fire sales.
It is against this precarious backdrop of a weakening U.S. economy and a global supply glut that China’s sale of U.S. Treasuries must be interpreted. The move is not occurring in a vacuum. It is a calculated action within a deeply fragile geopolitical and economic context, and it carries multiple, overlapping meanings. On one level, it is a clear continuation of China’s long-term strategic objective of de-dollarization. For years, Beijing has been wary of its deep financial entanglement with its primary geopolitical rival. The freezing of Russia’s foreign currency reserves following the invasion of Ukraine served as a stark wake-up call, demonstrating how the dollar-centric financial system could be weaponized. By gradually reducing its holdings of U.S. debt, China seeks to insulate itself from potential U.S. sanctions and chip away at the dollar's status as the world's undisputed reserve currency. This $8.2 trillion sale is another deliberate step on that long march.
However, there are more immediate and tactical motivations at play. China is grappling with its own severe economic crisis. The nation is battling deflation, a collapsing property sector, and record-high youth unemployment. In this environment, its primary objective is to stabilize its own currency, the Yuan, which has been under intense downward pressure. A key strategy for achieving this is to intervene in currency markets. Paradoxically, this intervention often requires selling U.S. Treasuries. The process involves the People's Bank of China selling its Treasury holdings to obtain U.S. dollars, and then selling those dollars in the open market to buy up Yuan, thereby supporting its value. So, while the headline reads as an attack on U.S. assets, it is also a sign of China's own domestic weakness—a desperate measure to defend its own financial stability by using its vast reserves.
Regardless of the primary motivation—be it strategic de-dollarization or tactical currency management—the timing and impact of the sale are profoundly significant. It comes at a moment of peak vulnerability for the U.S. dollar and the Treasury market. The dollar has been extending massive losses not because of China’s actions alone, but because the underlying fundamentals of the U.S. economy are deteriorating. Markets are increasingly pricing in a pivot from the Federal Reserve, anticipating that the "cracks" in the economy will force it to end its tightening cycle and begin cutting interest rates sooner rather than later. This expectation of lower future yields makes the dollar less attractive to foreign investors, causing it to weaken against other major currencies.
China’s sale acts as a powerful accelerant to this trend. The U.S. Treasury market is supposed to be the deepest, most liquid, and safest financial market in the world. It is the bedrock upon which the entire global financial system is built. When a major creditor like China becomes a conspicuous seller, it sends a powerful signal. It introduces a new source of supply into a market that is already struggling to absorb the massive amount of debt being issued by the U.S. government to fund its budget deficits. This creates a dangerous feedback loop. More supply of Treasuries puts downward pressure on their prices, which in turn pushes up their yields. Higher Treasury yields translate directly into higher borrowing costs for the entire U.S. economy, further squeezing households and businesses, deepening the economic slowdown, and increasing the pressure on the Fed to cut rates, which in turn further weakens the dollar. China’s action, therefore, pours fuel on the fire, eroding confidence in the very asset that is meant to be the ultimate safe haven.
The contagion from this dynamic—a weakening U.S. economy, a falling dollar, and an unstable Treasury market—will not be contained within American borders. The cracks will spread globally, creating a volatile and unpredictable environment for all nations. For emerging markets, the situation is a double-edged sword. A weaker dollar is traditionally a tailwind for these economies, as it reduces the burden of their dollar-denominated debts. However, this benefit is likely to be completely overshadowed by the collapse in global demand. As the U.S. and other major economies slow down, their demand for raw materials, manufactured goods, and services from the developing world will plummet, devastating the export-driven models of many emerging nations. They will find themselves caught between lower debt servicing costs and a collapse in their primary source of income.
For other developed economies like Europe and Japan, the consequences are more straightforwardly negative. A rapidly falling dollar means a rapidly rising Euro and Yen. This makes their exports more expensive and less competitive on the global market, acting as a significant drag on their own already fragile economies. The European Central Bank and the Bank of Japan will find themselves in an impossible position. If they cut interest rates to weaken their currencies and support their exporters, they risk re-igniting inflation. If they hold rates firm, they risk allowing their currencies to appreciate to levels that could push their economies into a deep recession. This currency turmoil, originating from the weakness in the U.S., effectively exports America’s economic problems to the rest of the world.
Furthermore, the instability in the U.S. Treasury market has profound implications for every financial institution on the planet. Central banks, commercial banks, pension funds, and insurance companies all hold U.S. Treasuries as their primary reserve asset. The assumption has always been that this asset is risk-free and its value is stable. The recent volatility and the high-profile selling by a major state actor challenge this core assumption. This forces a global repricing of risk. If the "risk-free" asset is no longer truly risk-free, then the premium required to hold any other, riskier asset—from corporate bonds to equities—must increase. This leads to a tightening of financial conditions globally, starving the world economy of credit and investment at the precise moment it is most needed.
In conclusion, the abrupt sale of $8.2 trillion in U.S. Treasuries by China is far more than a fleeting headline. It is a critical data point that illuminates the precarious state of the global economy. It is a manifestation of the Great Unwinding, a painful transition away from an era of limitless, debt-fueled demand and toward a new reality defined by excess supply, faltering consumption, and escalating geopolitical friction. The underlying cause of this instability is the deep imbalance created by years of policy missteps, which have left the world with a glut of goods and a mountain of debt. The weakening U.S. economy and the resulting slide in the dollar are the natural consequences of this imbalance. China’s actions serve as both a symptom of this weakness and a catalyst for a deeper crisis of confidence in the U.S.-centric financial system. The cracks are no longer hypothetical; they are appearing in the banking sector, in corporate credit markets, and now in the bedrock of the system itself—the U.S. Treasury market. The tremors from this shift will be felt broadly, ushering in a period of heightened volatility, economic pain, and a fundamental reordering of the global financial landscape.

GOLD - SHORT TO $2,800 (UPDATE)As expected last week Gold climbed into our 'Supply Zone' of $3,347 & rejected as I said it would on our video analysis. It even managed to close below our 'BOS' zone.
The game plan this week is to keep an eye on market structure for further sells. With every pump up we should be looking at how price can sell off again & how we can join the sell trend to profit off it.

DXY: Local Bullish Bias! Long!
My dear friends,
Today we will analyse DXY together☺️
The market is at an inflection zone and price has now reached an area around 96.706 where previous reversals or breakouts have occurred.And a price reaction that we are seeing on multiple timeframes here could signal the next move up so we can enter on confirmation, and target the next key level of 96.819.Stop-loss is recommended beyond the inflection zone.
❤️Sending you lots of Love and Hugs❤️
