Dollar Index Bearish to $96 (UPDATE)I posted this DXY sell thesis yesterday for you all while price was still at $97.70. Since then sellers have taken out the previous Wave 3 low, creating a new daily low today at $96.90📉
We still have more downside yet to come towards our $96.60 target. So, use this 'DXY Sell Thesis' to help you with your trading, so once you can use this as a confluence to buy inverse correlated markets
DXY

DXY I AM MOVING TO 100 % LONG DXY WAVE 4 lowThe chart posted is my view of the DXY I am as bullish now as I was at 71 .Best of TRADES WAVETIMER 96.70 to 97.6

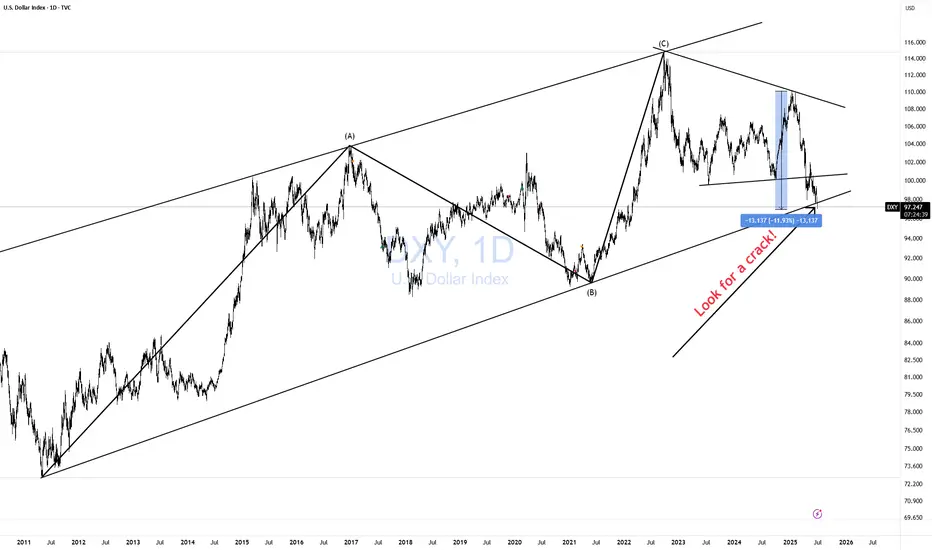
DXY CRACK! BAD JUJU!After Trump unilaterally imposed Tariffs (Taxes) on its citizens to buy imported goods from the rest of the world, promising 90 deals in 90 days, "in two weeks", the demand for the dollar payment system has collapsed by -12% reducing purchasing power for all $ holders'.
Imports of goods mean exporting $s to the rest of the world. As a world reserve currency (WRC), the US gets the benefit of seeing those $s invested back into the US. That creates demand for the $ payment system, and raises $ holders' purchasing power, reducing inflation.
What else happens? A bit complicated but I will try to explain. High demand for $ means the US indirectly exports inflation. Meaning, more $ for the same amount of goods and services. However, as a WRC, the US is not really exporting inflation. That is a bit inaccurate bc the US payment system as a WRC is actually includes a lot more goods and services from the entire planet. This makes sense if you think about it. However only going one way, meaning as long as the demand from the world for our payment system, more $ required by the world reflect more goods and services. As such not inflationary.
Now let's reverse it so you can see why it is not entirely accurate. Should the Global Economy (which is worth today about $100 trillion,) demand ever drop off. The $ value will collapse as people sell their $ holdings in exchange for other currencies. What you are seeing right now in this chart with a CRACK in it.
The US GDP is currently about $30 trillion. There is no way! A $ payment system designed for a $100T economy can suddenly absorb all those $ in a $30T economy. Inflation would skyrocket as more and more $ chase the same amount of goods and services ($30T). This is not rocket science. This is basic 3rd-grade arithmetic!
This CRACK! could be very bad JUJU!
CAUTION is in order. Don't let normality bias fool you. No matter how you feel about Trump. It is irrelevant to basic arithmetic.
SP500 short USD is losing its reserve currency status but I guess it is also loosing its measuring cup status as well.
While people are cheering for all time highs in USD, SP500 in CHF does not look good at all.

DXY Short-term rebound quite likely.The U.S. Dollar index (DXY) has been trading within almost a 3-year Channel Down, which has assisted us in choosing the right levels to sell high and buy low.
Despite being now on its 2nd major Bearish Leg, we see a short-term bounce possibly up to August quite likely based on the previous major Bearish Leg. As you see, the current setup resembles the April 13 023 Low after which the price rebounded short-term just above the 0.786 Fibonacci level, only to get rejected later and complete the bottom on the 1.1 Fib extension.
Even the 1W RSI sequences between the two fractals are identical. Therefore, before diving below 96.000, we believe a 100.000 test is quite likely.
-------------------------------------------------------------------------------
** Please LIKE 👍, FOLLOW ✅, SHARE 🙌 and COMMENT ✍ if you enjoy this idea! Also share your ideas and charts in the comments section below! This is best way to keep it relevant, support us, keep the content here free and allow the idea to reach as many people as possible. **
-------------------------------------------------------------------------------
💸💸💸💸💸💸
👇 👇 👇 👇 👇 👇

DXY: Strong Bullish Sentiment! Long!
My dear friends,
Today we will analyse DXY together☺️
The price is near a wide key level
and the pair is approaching a significant decision level of 96.899 Therefore, a strong bullish reaction here could determine the next move up.We will watch for a confirmation candle, and then target the next key level of 97.077.Recommend Stop-loss is beyond the current level.
❤️Sending you lots of Love and Hugs❤️

EURUSD Soars Beyond 1.17, Eyeing 2021 Highs on DXY DrawdownAs EUR/USD breaks further above the upper boundary of a 17-year descending channel, U.S. dollar dominance over the pair appears to be fading, leaving room for long-term upside potential.
The pair has now reached levels last seen in September 2021 near 1.1750. A decisive close above this level could extend gains toward the 1.20 mark, aligned with the 2021 peaks.
On the downside, a close back below the 1.1570 support may trigger a pullback toward 1.14 and 1.13 before a potential bullish continuation. If that fails, the upper boundary of the former channel could be retested at 1.11 and 1.10.
- Razan Hilal, CMT

XAUUSD Possible Move 26.05.2025Gold is currently respecting an ascending channel, showing consistent higher highs and higher lows. Price is now testing the upper boundary of this channel and approaching a key supply zone (3353–3357), which previously triggered a strong sell-off.
Key Zones:
🔼 Sell Zone: 3353–3357 (confluence of supply + channel resistance)
🔽 Buy Zone: 3325–3329 (demand zone + channel support)
✅ Trade Ideas:
📍Buy Setup
Entry: 3325–3329
SL: Below 3310
TP: 3350–3355
📍Sell Setup
Entry: 3353–3357
SL: Above 3367
TP: 3330–3325
🔔 Important Note:
⚠️ Today's U.S. Jobless Claims data is critical. Expect volatility and possible breakout/fakeout scenarios around the time of release. Trade only on confirmation.

SELL EURUSDIn todays session we are actively monitoring EURUSD for selling opportunity. Our entry is at the current high price of 1.16600 our target is below 1.15800 and stops above 1.16900 (to be adjusted accordingly). Use proper risk management and cheers to you all.

Potential bulllish reveresal?The US Dollar Index (DXY) is falling towards the pivot, which aligns with the Fibonacci confluence and could reverse to the 1st resistance.
Pivot: 97.08
1st Support: 96.44
1st Resistance: 98.10
Risk Warning:
Trading Forex and CFDs carries a high level of risk to your capital and you should only trade with money you can afford to lose. Trading Forex and CFDs may not be suitable for all investors, so please ensure that you fully understand the risks involved and seek independent advice if necessary.
Disclaimer:
The above opinions given constitute general market commentary, and do not constitute the opinion or advice of IC Markets or any form of personal or investment advice.
Any opinions, news, research, analyses, prices, other information, or links to third-party sites contained on this website are provided on an "as-is" basis, are intended only to be informative, is not an advice nor a recommendation, nor research, or a record of our trading prices, or an offer of, or solicitation for a transaction in any financial instrument and thus should not be treated as such. The information provided does not involve any specific investment objectives, financial situation and needs of any specific person who may receive it. Please be aware, that past performance is not a reliable indicator of future performance and/or results. Past Performance or Forward-looking scenarios based upon the reasonable beliefs of the third-party provider are not a guarantee of future performance. Actual results may differ materially from those anticipated in forward-looking or past performance statements. IC Markets makes no representation or warranty and assumes no liability as to the accuracy or completeness of the information provided, nor any loss arising from any investment based on a recommendation, forecast or any information supplied by any third-party.

XAU/USD - Channel Breakout (26.06.2025)The XAU/USD pair on the M30 timeframe presents a Potential Buying Opportunity due to a recent Formation of a Channel Breakout Pattern. This suggests a shift in momentum towards the upside and a higher likelihood of further advances in the coming hours.
Possible Long Trade:
Entry: Consider Entering A Long Position around Trendline Of The Pattern.
Target Levels:
1st Resistance – 3385
2nd Resistance – 3410
🎁 Please hit the like button and
🎁 Leave a comment to support for My Post !
Your likes and comments are incredibly motivating and will encourage me to share more analysis with you.
Best Regards, KABHI_TA_TRADING
Thank you.
Disclosure: I am part of Trade Nation's Influencer program and receive a monthly fee for using their TradingView charts in my analysis.

Gold now pushing bullish for new LevelsWaited for this Move all day yesterday and it didnt start till London session. Oh well happens some time! Looking for the Weekly Low level to be broken so we can continue the bullish activity.

Canadian Dollar vs. US Dollar. The Spring Is Compressing.In previous posts, we have already begun to look at the key drivers of the US outperformance over the past decade.
The US market dominance has been largely driven by the rapid rise of tech giants (such as Apple, Microsoft, Amazon and Alphabet), which have benefited from strong profit growth, global market reach and significant investor inflows.
Unsatisfactory International Performance
Markets outside the US have faced headwinds including multiple stifling sanctions and tariffs, slowing economic growth, political uncertainty (especially in Europe), a stronger US dollar and the declining influence of high-growth tech sectors.
The Valuation Gap
By 2025, US equities will be considered relatively expensive compared to their international peers, which may offer more attractive valuations in the future.
Recent Shifts (2025 Trend)
Since early 2025, international equities have begun to outperform the S&P 500, and European and Asian equities have regained investor interest. Global market currencies are also widely dominated by the US dollar.
Factors include optimism around the following three big themes.
DE-DOLLARIZATION. DE-AMERICANIZATION. DIVERSIFICATION.
De-dollarization is the process by which countries reduce their reliance on the US dollar (USD) as the world's dominant reserve currency, medium of exchange, and unit of account in international trade and finance. This trend implies a shift away from the central role of the US dollar in global economic transactions to alternative currencies, assets, or financial systems.
Historical context and significance of the US dollar
The US dollar became the world's primary reserve currency after World War II, as enshrined in the Bretton Woods Agreement of 1944. This system pegged other currencies to the dollar, which was convertible into gold, making the dollar the backbone of international finance. The United States became the world's leading economic power, and the dollar replaced the British pound sterling as the dominant currency for global trade and reserves.
The dollar has been the most widely held reserve currency for decades. As of the end of 2024, it still accounts for about 57% of global foreign exchange reserves, far more than the euro (20%) and the Japanese yen (6%). However, this share has fallen from over 70% in 2001, signaling a gradual shift and prompting discussions about de-dollarization.
How De-Dollarization Works
Countries looking to reduce their reliance on the dollar are pursuing several strategies:
Diversifying reserves: Central banks are holding fewer U.S. dollars and increasing their holdings of other currencies, such as the euro, yen, British pound, or new alternatives such as the Chinese yuan. While the yuan's share remains small (about 2.2%), it has grown, especially among countries like Russia.
Using alternative currencies in trade: Countries are entering into bilateral or regional agreements to conduct trade in their own currencies rather than using the dollar as an intermediary. For example, China has introduced yuan-denominated oil futures (the "petroyuan") to challenge the petrodollar system. Increasing gold reserves: Many countries, including China, Russia and India, have significantly increased their purchases of gold as a safer reserve asset, reducing their dollar holdings.
Developing alternative financial systems: Some countries and blocs, such as BRICS, are working to develop alternatives to the US-dominated SWIFT payment system to avoid the risk of sanctions and gain true economic and political independence.
Reasons for de-dollarization
The move towards de-dollarization is driven by geopolitical and economic factors:
Backlash against US economic hegemony: The US often uses dollar dominance to impose sanctions and exert political pressure, encouraging countries to seek financial sovereignty.
Rise of new economic powers: Emerging economies like China and groups like the BRICS are seeking to reduce their vulnerability to U.S. influence and promote regional integration and alternative financial infrastructures.
Geopolitical tensions: Conflicts like the war in Ukraine have intensified efforts by countries like Russia to remove the dollar from their reserves to avoid sanctions.
Implications and outlook
While the dollar remains dominant, a more de-dollarized world is already changing global economic power. The U.S. may lose some advantages, such as lower borrowing costs and geopolitical influence. For the U.S. economy, de-dollarization could lead to a weaker currency, higher interest rates, and reduced foreign investment, although some effects, such as inflation from a weaker dollar, could belimited .
For other countries, de-dollarization could mean greater economic independence and less exposure to U.S. policy risks. However, no currency currently matches the dollar’s liquidity, stability, and global recognition, so a full transition is unlikely in the near future .
Summary
De-dollarization is a complex, ongoing process that reflects a gradual shift away from the global dominance of the U.S. dollar. It involves diversifying reserves, using alternative currencies and assets, and creating new financial systems to reduce dependence on the dollar.
Driven by geopolitical tensions and the rise of emerging economic powers, de-dollarization challenges the entrenched role of the dollar but is unlikely to completely replace it anytime soon.
Instead, it is leading to a more multipolar monetary system in international finance, increasing demand for alternative investments to the U.S.
Technical task
The main technical chart is presented in a quarterly breakdown, reflecting the dynamics of the Canadian dollar against the US dollar FX_IDC:CADUSD in the long term.
With the continued positive momentum of the relative strength indicator RSI(14), flat support near the level of 0.70 and a decreasing resistance level (descending top/ flat bottom) in case of a breakout represent the possibility of price growth to 0.80, with the prospect of parity in the currency pair and strengthening of the Canadian dollar to all-time highs, in the horizon of the next five years.
--
Best wishes,
Your Beloved @PandorraResearch Team 😎

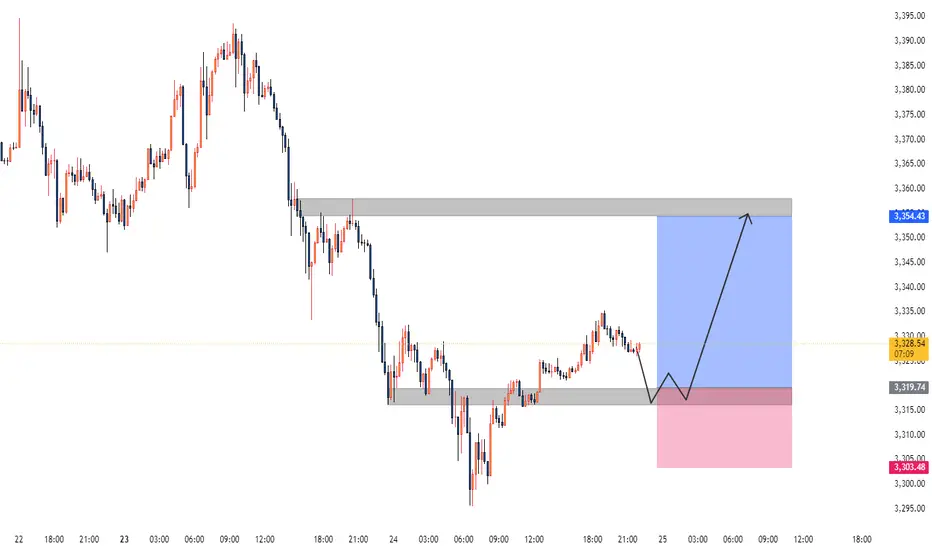
Gold XAUUSD Analysis 25.06.2025The Gold shows with a recent upward trend following a period of consolidation and a dip. Key observations:
The price previously fluctuated between a support level around 3,310-3,319 and a resistance near 3,354.
The current price is consolidating near the recent high, suggesting potential for further upward movement or a pullback.
Signal:
Buy signal is present in the range of 3,316-3,319, aligning with the support level, offering a good entry point for a potential upward move.
$DXY Repeating 2016 Post-Election I have highlighted the 2016 to 2020 Presidential Elections time period and then pasted that timeframe onto the 2024 election and found that the pattern is going along very similarly to Trump 1.0.
If we assume that the future unfolds the same as last time, which is low probability, of course, then the future will unfold as shown in the yellow bars going into the future, as shown.
Initially in 2016 post election there was a 7% rally in the U.S. Dollar Index and then a 15% retreat for the following year. So far in 2025 we have seen the same rally and a similar decline, but only faster this time.
It would appear as thought the bulk majority of the declines in the TVC:DXY are over at this time with perhaps 4% further downside over the balance of the year.
The Dollar Index has been useful for predicting changes in the earnings estimates for the S&P500 in the USA due to the high percentage of earnings coming back to the US for quarterly reporting. I have posted a few charts in the past which have been helpful at determining the risk in the stock market.
The behavior of the global central banks has certainly had its impact on monetary aggregates and inflation. The policy response since the Covid Pandemic has been for maximum liquidity and maximum Government spending to keep the global economy afloat. The post-Covid response is now coming to a head along with new policy directives to cut wasteful Government spending and to reduce inflation (caused the Gov't spending).
Global investors have flocked to the US for access to high technology stocks and have driven up the value of US assets to extreme levels compared to other markets. This adjustment phase where investors remove money from overvalued, or highly valued, US assets back to other markets has created a wave of selling in the US Dollar and US listed equities.
What does the future hold? We never know but we sure can learn from what happened in the past by looking at charts just like this one to see what may happen. Looks like a bounce in the TVC:DXY from here, followed by a new low and then a rebound into the next few years.
All the best,
Tim
April 22, 2025 1:16PM EST TVC:DXY 98.78 last

GOLD - SHORT TO $2,800 (VIDEO ANALYSIS)Confluences👇
⭕️Wave 3 Peaked at Psychological Number of $2,500 (LQ Point).
⭕️Minor Wave 1 & 2 of Major Wave 4 Complete. But Wave 3 Pending.
⭕️Thin Liquidity In The Markets.
⭕️Gold Overbought/DXY Oversold.
✅HUGE 4,700 PIPS (14% ROI) POTENTIAL PROFIT✅

Dollar Index Analysis: Wedge + Powell Outlook – June 25, 2025📉 Technical Outlook: Bearish Rising Wedge + Liquidity Sweep Setup
TVC:DXY The Dollar Index (DXY) is currently trading within a rising wedge pattern, typically a bearish structure. We're anticipating a fake breakdown, potential sweep of the key demand zone, followed by a reversal move targeting key highs.
🔍 Key Technical Zones
📥 Demand Zone (Buy Area):
🔵 97.50 – 97.20 = Institutional accumulation + unfilled orders
🚫 Invalidation Level (Stop-Loss) :
❌ 96.70 = Clean break below confirms full bearish continuation
🎯 Target Projections (Upside Levels) :
TP1: 99.00
TP2: 100.00
TP3: 101.04 (HTF swing high liquidity cleanout)
🧠 Summary Setup :
Downtrend
Rising wedge formation
Sweep of 97.20 possible
Watch for fakeout & reversal play toward 101.04
🏛️ Fundamental Analysis – Powell’s Testimony Insights
Fed Chair Powell highlighted the following during his recent testimony:
🔄 “We’re not there yet on inflation” — Core services remain sticky
🛑 No immediate rate cuts — Growth is slowing but not crashing
🕰 Rate cuts likely postponed to Q4 2025
🔐 “Real rates are restrictive enough” = No more hikes expected
💡 Implication for DXY :
✅ Short-term bullish bias as higher U.S. yields remain attractive if rate cuts are delayed.
🌍 Macro Context Snapshot (as of June 25, 2025)
🇺🇸 US Disinflation: CPI & PCE easing, but not collapsing
🇪🇺 ECB Cut in June: Euro may weaken further
🇯🇵 BOJ Policy Unclear: USD/JPY likely volatile
🌐 Global Risk Appetite High: Volatility may return with geopolitical events
🔥 Watch This: Trade Tariff Narrative Heating Up
🚨 New U.S. Tariff Signals on Chinese tech and EU autos are resurfacing. This could:
Push inflation risk higher
Delay Fed’s easing timeline
Add support to USD short term as markets price in geopolitical tension and uncertainty
📌 Trading Strategy Recap :
Monitor wedge support near 97.20
Look for fakeout/sweep and bullish reversal
Target 99–101 zone on rebound
Stay alert to Powell/Fed rhetoric + tariff news
If you find this analysis helpful, Like, Comment, and Follow for more DXY, gold, and macro trades!

Overlap resistance ahead?The US Dollar Index (DXY) is rising towards the pivot, which is an overlap resistance and could reverse to the 1st support that lines up with the 127.2% Fibonacci extension.
Pivot: 98.50
1st Support: 97.21
1st Resistance: 99.30
Risk Warning:
Trading Forex and CFDs carries a high level of risk to your capital and you should only trade with money you can afford to lose. Trading Forex and CFDs may not be suitable for all investors, so please ensure that you fully understand the risks involved and seek independent advice if necessary.
Disclaimer:
The above opinions given constitute general market commentary, and do not constitute the opinion or advice of IC Markets or any form of personal or investment advice.
Any opinions, news, research, analyses, prices, other information, or links to third-party sites contained on this website are provided on an "as-is" basis, are intended only to be informative, is not an advice nor a recommendation, nor research, or a record of our trading prices, or an offer of, or solicitation for a transaction in any financial instrument and thus should not be treated as such. The information provided does not involve any specific investment objectives, financial situation and needs of any specific person who may receive it. Please be aware, that past performance is not a reliable indicator of future performance and/or results. Past Performance or Forward-looking scenarios based upon the reasonable beliefs of the third-party provider are not a guarantee of future performance. Actual results may differ materially from those anticipated in forward-looking or past performance statements. IC Markets makes no representation or warranty and assumes no liability as to the accuracy or completeness of the information provided, nor any loss arising from any investment based on a recommendation, forecast or any information supplied by any third-party.

Patience has to be the Major Play in waiting on these Set ups! Was waiting for the sweep on gold to happen and they didnt do it till the very end of the day yesterday. Looking for the bullish action to continue. If we can get a breakout tonight then i will look for possible levels of support.

GOLD - WAVE 5 BULLISH TO $3,734 (UPDATE)Here’s an updated analysis, as ‘Minor Wave 2’ is still forming & pulling back deeper into the $3,285 zone.
We’ll be keeping an eye around this zone for a slow down in bearish momentum & if we get it, we’ll enter a buy trade. If momentum doesn’t slow down, we will let it go towards $3,245 & invalidate bullish structure. That way we know to look for sell’s📉
TP1: $3,374
TP2: $4,300

GOLD - WAVE 5 BULLISH TO $3,734 (VIDEO UPDATE)Here’s an updated video analysis, as ‘Minor Wave 2’ is still forming & pulling back deeper into the $3,285 zone which I mentioned for you all last week.
We’ll be keeping an eye around this zone for a slow down in bearish momentum & if we get it, we’ll enter a buy trade. If momentum doesn’t slow down, we will let it go towards $3,245 & invalidate bullish structure. That way we know to look for sell’s 📉
TP1: $3,374
TP2: $4,300

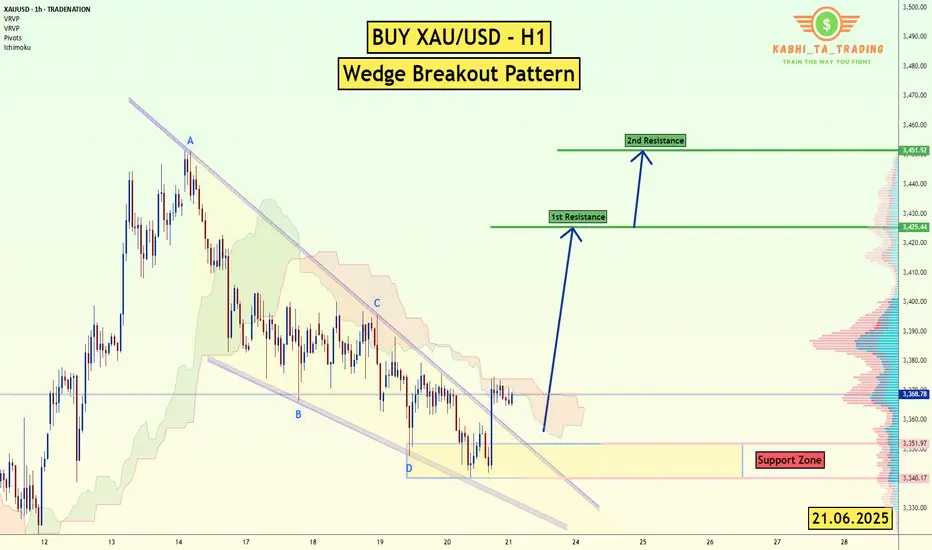
XAU/USD (Gold) - H1 - Wedge Breakout (21.06.2025)The XAU/USD pair on the H1 timeframe presents a Potential Buying Opportunity due to a recent Formation of a Wedge Breakout Pattern. This suggests a shift in momentum towards the upside and a higher likelihood of further advances in the coming Days.
Possible Long Trade:
Entry: Consider Entering A Long Position around Trendline Of The Pattern.
Target Levels:
1st Resistance – 3425
2nd Resistance – 3451
🎁 Please hit the like button and
🎁 Leave a comment to support for My Post !
Your likes and comments are incredibly motivating and will encourage me to share more analysis with you.
Best Regards, KABHI_TA_TRADING
Thank you.
Disclosure: I am part of Trade Nation's Influencer program and receive a monthly fee for using their TradingView charts in my analysis.