Gold Finally Swept the Lows!!!!Waited for this all damn day and it didnt happen till just before the day closed. Now looking for the action to continue. If they give signs before the killzone then its a go going into London session.
DXY

USDCHF OUTLOOK - SWING SETUPExpecting a bullish dollar in the next few months, which in turn will be bullish for USDCHF.
Note: ****I forgot to publish/share the trade setup after annotation.
"May fortune attend thee, and thy trade prosper." .......L2Earned

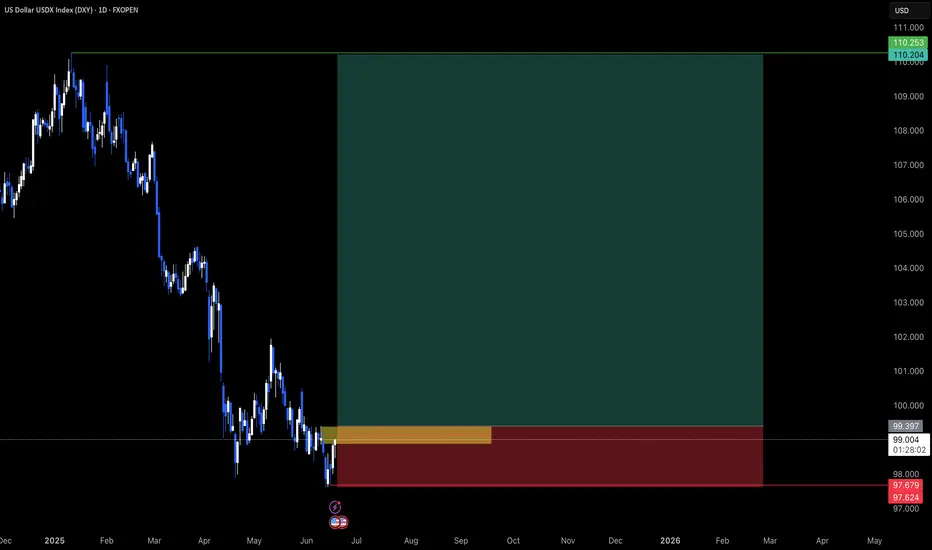
DXY OUTLOOK - SWING SETUPThe dollar has been on a six-month decline, but I anticipate a recovery. This is primarily due to the current economic climate, geopolitical landscape, and the dollar's traditional role as a safe-haven currency during periods of significant uncertainty
"May fortune attend thee, and thy trade prosper." .......L2Earned
$USINTR -Fed Keeps Rates Uncut (June/2025)ECONOMICS:USINTR
June/2025
source: Federal Reserve
- The Federal Reserve left the federal funds rate unchanged at 4.25%–4.50% for a fourth consecutive meeting in June 2025, in line with expectations, as policymakers take a cautious stance to fully evaluate the economic impact of President Trump’s policies, particularly those related to tariffs, immigration, and taxation. However, officials are still pricing in two rate cuts this year.

EURUSD - Getting Over-Bought?Hello TradingView Family / Fellow Traders. This is Richard, also known as theSignalyst.
📈EURUSD has been overall bullish trading within the rising channels marked in red and blue. However, it is currently retesting the upper bound of the channels.
Moreover, the orange zone is a major daily high.
🏹 Thus, the highlighted red circle is a strong area to look for sell setups as it is the intersection of the upper blue/red trendlines and daily high.
📚 As per my trading style:
As #EURUSD approaches the red circle zone, I will be looking for bearish reversal setups (like a double top pattern, trendline break , and so on...)
📚 Always follow your trading plan regarding entry, risk management, and trade management.
Good luck!
All Strategies Are Good; If Managed Properly!
~Rich
Disclosure: I am part of Trade Nation's Influencer program and receive a monthly fee for using their TradingView charts in my analysis.

Bullish bounce?US Dollar Index (DXY) is reacting off the pivot and could rise to the 1st resistance.
Pivot: 98.48
1st Support: 98.09
1st Resistance: 99.25
Risk Warning:
Trading Forex and CFDs carries a high level of risk to your capital and you should only trade with money you can afford to lose. Trading Forex and CFDs may not be suitable for all investors, so please ensure that you fully understand the risks involved and seek independent advice if necessary.
Disclaimer:
The above opinions given constitute general market commentary, and do not constitute the opinion or advice of IC Markets or any form of personal or investment advice.
Any opinions, news, research, analyses, prices, other information, or links to third-party sites contained on this website are provided on an "as-is" basis, are intended only to be informative, is not an advice nor a recommendation, nor research, or a record of our trading prices, or an offer of, or solicitation for a transaction in any financial instrument and thus should not be treated as such. The information provided does not involve any specific investment objectives, financial situation and needs of any specific person who may receive it. Please be aware, that past performance is not a reliable indicator of future performance and/or results. Past Performance or Forward-looking scenarios based upon the reasonable beliefs of the third-party provider are not a guarantee of future performance. Actual results may differ materially from those anticipated in forward-looking or past performance statements. IC Markets makes no representation or warranty and assumes no liability as to the accuracy or completeness of the information provided, nor any loss arising from any investment based on a recommendation, forecast or any information supplied by any third-party.

DXY: Bulls Are Winning! Long!
My dear friends,
Today we will analyse DXY together☺️
The recent price action suggests a shift in mid-term momentum. A break above the current local range around 98. 059 will confirm the new direction upwards with the target being the next key level of 98.148 and a reconvened placement of a stop-loss beyond the range.
❤️Sending you lots of Love and Hugs❤️

EURUSD H2 Best Levels to BUY/SELL and Market Update🏆 EURUSD Market Update m20 short-term trade
📊 Technical Outlook
🔸Short-term: BEARS 1275
🔸1500/1540 short sell rips/rallies
🔸Mid-Term outlook: BULLS 1750
🔸bulls buy low 1250/1275 reload
🔸bulls exit at 1750 swing trade
🔸Price Target Bears: 1250/1275
🔸Price Target Bulls: 1750
🌍 Macro & Political Drivers
U.S. tax & spending concerns: The Congressional Budget Office now projects President Trump's tax‑and‑spending bill will raise deficits by about $2.8 trillion over the next decade. This massive debt addition is pressuring the U.S. dollar, as rising Treasury issuance and weaker fiscal confidence weigh on demand.
Geopolitical tensions: Escalation in the Israel–Iran conflict is pushing investors toward the safe-haven U.S. dollar. The DXY jumped to around 98.80 as President Trump’s remarks on Iran sent the EUR/USD down to approximately 1.1484.
EU developments: ECB officials, including Christine Lagarde, are doubling down on strengthening Europe’s financial infrastructure to elevate the euro as a viable alternative to the dollar — calling this a “global euro moment.”
Key resistance is around 1.1550–1.1575; downside support zones near 1.1450 and broader range 1.1360–1.1420 remain intact, though current levels suggest consolidation above the lower range. Strength from safe-haven flows could stall upward momentum.
📊 ECB Policy & Inflation Signals
The ECB cut rates by 25 bp last week to 2.0%, reinforcing the message that inflation remains subdued (1.9% in May) and prompting a data-driven, meeting-by-meeting decision approach.
ECB speakers stress “agile pragmatism” given global uncertainties, citing the euro’s ~10% rally year-to-date but cautioning amid rising oil prices and geopolitical risks.
⚡ What to Watch Next
Catalyst Outlook
U.S. yields & bond auctions More issuance tied to tax plans could steepen the curve and support the USD.
Middle East headlines Escalation may continue to offer dollar safe-haven benefits, pressuring EUR/USD.
EU economic data Inflation softness (e.g., France) could weaken ECB’s stance, re-pressuring the euro.
Technical levels Watch 1.1450 support—holds for possible rebound; resistance 1.1550–1.1575 for upside pressure.
✅ Summary
Current: EUR/USD around 1.1484, with bearish tilt amid risk aversion.
Bull case: Ongoing U.S. fiscal weakness, delayed tariffs, and ECB support for euro could cap downside.
Bear case: Safe-haven demand from geopolitical tensions, Fed‑ECB divergence, and technical breakdown through 1.1450 could push toward 1.1360.

Skeptic | DXY Crash Alert: Epic Bearish Triggers Unleashed!heyy, traders, what’s good? It’s Skeptic ! 😎 Let’s dive into a full-on breakdown of DXY—the Dollar Index is making waves, and I’m hyped to unpack it. The 98.801 level looks busted with a pullback in play, and I’m expecting more action. Stick with me to the end as we rip through Daily and 4-Hour timeframes to catch the vibe and nail those triggers! 🚖
Daily Timeframe: The Big Picture
So, US inflation data came in softer than expected recently, but DXY still dumped. You might be like, “Wait, shouldn’t lower inflation juice up the dollar?” Nah, here’s the deal: markets move on expectations, not just news. When something grows in the markets, it’s ‘cause traders are betting it’ll keep growing—and vice versa. For DXY, traders are sniffing out a US economic slowdown and expecting the Federal Reserve to cut rates soon, which could spark higher inflation later. That’s the double-whammy driving DXY’s drop, despite the tame inflation numbers. This is the biggest secret in markets—nobody talks about it, but it’s what I learned in econ class and see every day: markets run on expectations. 📚
Major Trend: Per Dow Theory, we’re in a bearish trend as long as we’re below 98.801 .
Game Plan: While under this level, hunt longs on USD pairs like EUR/USD. If we break above 98.801, chill and let the market reform before jumping in.
4-Hour Timeframe: Long & Short Triggers
Now, let’s get to the 4-hour chart for the real action—our long and short triggers:
Short Trigger: A break below support at 98.017 could keep the bearish vibe rolling. RSI hitting oversold would be a dope confirmation. 😤
Long Trigger: Since the major trend is bearish, longs are against the flow, so keep risk tight and take profits quick. The trigger is a break above 98.801, but the main long trigger is smashing through 99.244. So, 99.244 is your go-to for longs. 💪
Pro Tip: Shorts align with the trend, so they’re safer, but longs need extra caution—small positions, tight stops, and don’t get greedy!
Final Vibe Check
That’s the DXY lowdown, fam! Markets are tricky, but if you stick to reasoning over hype, you’ll stay ahead. No FOMO, no hype, just reason —that’s how we roll at Skeptic Lab. Wanna dive deeper into risk management or another pair? Let me know! 🙌
💬 Let’s Talk!
If this analysis got you pumped, smash that boost—it means a ton! 😊 Got a pair or setup you want me to tackle next? Drop it in the comments. Thanks for vibing with me—keep trading sharp! ✌️

DXY June 18 2025We believe that Trump's tariffs and the downward trend in U.S. interest rates will continue to put pressure on the dollar, leading to further depreciation.
Monthly Target: 95.445-101.977

Bearish reversal?US Dollar Index (DXY) has reacted off the pivot and could drop to the 1st support.
Pivot: 98.89
1st Support: 98.29
1st Resistance: 99.60
Risk Warning:
Trading Forex and CFDs carries a high level of risk to your capital and you should only trade with money you can afford to lose. Trading Forex and CFDs may not be suitable for all investors, so please ensure that you fully understand the risks involved and seek independent advice if necessary.
Disclaimer:
The above opinions given constitute general market commentary, and do not constitute the opinion or advice of IC Markets or any form of personal or investment advice.
Any opinions, news, research, analyses, prices, other information, or links to third-party sites contained on this website are provided on an "as-is" basis, are intended only to be informative, is not an advice nor a recommendation, nor research, or a record of our trading prices, or an offer of, or solicitation for a transaction in any financial instrument and thus should not be treated as such. The information provided does not involve any specific investment objectives, financial situation and needs of any specific person who may receive it. Please be aware, that past performance is not a reliable indicator of future performance and/or results. Past Performance or Forward-looking scenarios based upon the reasonable beliefs of the third-party provider are not a guarantee of future performance. Actual results may differ materially from those anticipated in forward-looking or past performance statements. IC Markets makes no representation or warranty and assumes no liability as to the accuracy or completeness of the information provided, nor any loss arising from any investment based on a recommendation, forecast or any information supplied by any third-party.

Missiles in the Middle East, Headwinds on Nasdaq: NAS100 onHey There;
The trend line on the NAS100 has been broken to the downside. My target level after this breakout is 21,299.47. If the price moves towards this level, I think it will reach my target in line with fundamental analysis due to the broken trend line and Iran-Israel war tensions.
I meticulously prepare these analyses for you, and I sincerely appreciate your support through likes. Every like from you is my biggest motivation to continue sharing my analyses.
I’m truly grateful for each of you—love to all my followers💙💙💙

when price consolidates, its just setting upLooking for a bigger moving going into mid week. Tues spent the entire day consolidating. Now im thinking we getting ready for a bigger move. Just trying to be patient and wait for it. Price should give us some kinda sign on what it would like to do as we coming into the Asian Killzone.

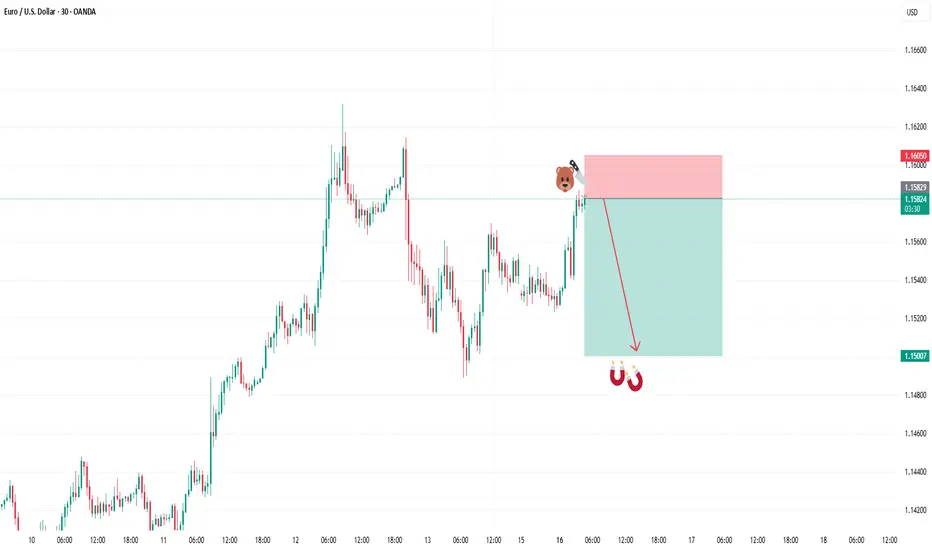
SELL EURUSDIn todays session we are monitoring EURUSD for selling opportunity. Our entry is at 1.15814 and stops are above 1.16050. Our target is 1.15000. Use proper risk management and stay safe fam.
BUY USDCADIn todays session we are anticipating a bullish dollar. Our entry for buys on USDCAD are at 1.35728 our targets are 1.36484 and stops below 1.35535. Use proper risk management. Stay safe

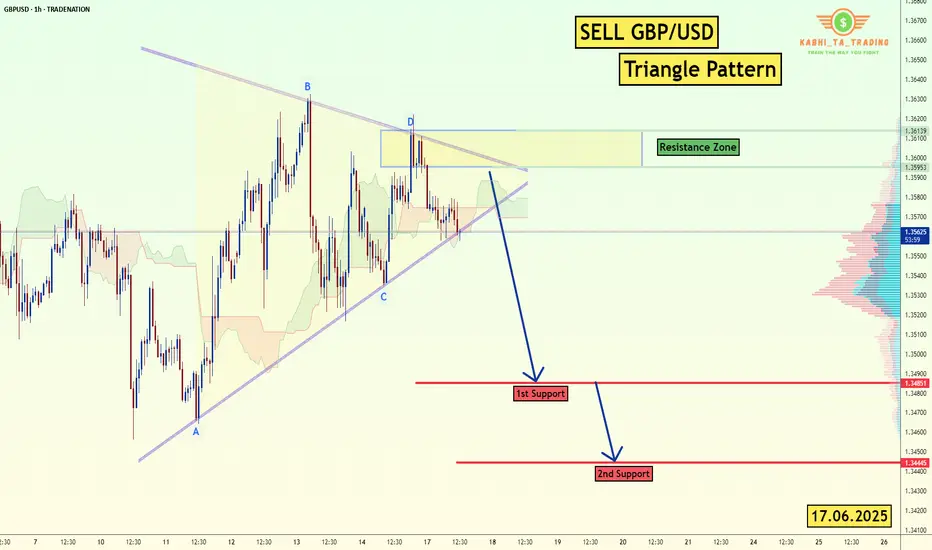
GBP/USD - H1-Triangle Breakout (17.06.2025)The GBP/USD Pair on the H1 timeframe presents a Potential Selling Opportunity due to a recent Formation of a Triangle Breakout Pattern. This suggests a shift in momentum towards the downside in the coming hours.
Possible Short Trade:
Entry: Consider Entering A Short Position around Trendline Of The Pattern.
Target Levels:
1st Support – 1.3485
2nd Support – 1.3444
🎁 Please hit the like button and
🎁 Leave a comment to support for My Post !
Your likes and comments are incredibly motivating and will encourage me to share more analysis with you.
Best Regards, KABHI_TA_TRADING
Thank you.
Disclosure: I am part of Trade Nation's Influencer program and receive a monthly fee for using their TradingView charts in my analysis.
GOLD - WAVE 5 BULLISH TO $3,622 (UPDATE)Gold is currently going through a strong 'accumulation' phase for buyers, hence why we're seeing these choppy price actions, trying to liquidate buyers. It won't surprise me if we see dips lower, but overall we remain bullish as long as Gold is ABOVE THE WAVE 2 LOW. Breaking below this low, will invalidate bullish structure.
Wave 2 Invalidation Level - $3,245❌

DXY: US dollar To Drop Further Around 95?The US dollar has been steadily declining since the new president was elected in the USA. This decline has been accompanied by the ongoing trade wars. Numerous economic indicators have supported this trend, and we anticipate further depreciation in the coming days or weeks. Before trading, it’s essential to conduct your own analysis and gain a comprehensive understanding of the market.
We wish you the best of success in trading. Good luck and trade safely.
Like and comment for more, and as always, happy trading!
Team Setupsfx_

$DXY Dollar stays weak but is it bottommed?Have not many ANY trades based on the US Dollar. Have not been convinced in either way, yet.
TVC:DXY has been weaker lately but not by much. Well, at least compared to its previous low.
However, LONGER TERM we see it's biz as usual.
It is currently fairly oversold on the weekly chart & could be primed to change direction.

USDJPYHello Traders! 👋
What are your thoughts on USDJPY?
On the USD/JPY chart, price is currently moving within a symmetrical triangle pattern and is approaching the upper trendline and a key resistance zone.
We expect that upon testing this resistance level, price will likely fail to break above it and enter a bearish phase, potentially falling at least to the specified support level.
For higher-confidence sell entries, it’s recommended to wait for a confirmed downside break of the lower trendline of the triangle, which would validate a bearish continuation.
Will this resistance hold and trigger a drop, or will bulls take control? Share your thoughts below! 🤔👇
Don’t forget to like and share your thoughts in the comments! ❤️

Gold XAUUSD Move 16 June 2025Market Structure:
The market isin a clear uptrend, forming higher highs and higher lows until a recent break of the ascending trendline, signaling a short-term structural weakness.
Current price is in a retracement phase, heading towards previous demand zones.
🔹 Zone 1 (3408–3414):
Confluence of:
Broken trendline retest (former support).
Minor order block / demand zone.
Overlapping price reaction area.
Risk: This zone may act as a liquidity inducement before price sweeps deeper into Zone 2.
Entry trigger: Bullish engulfing or LTF market structure shift on 1m/5m.
🔹 Zone 2 (3380–3384):
Stronger demand zone:
Aligned with previous accumulation base.
Larger imbalance (FVG-type area) and bullish impulsive origin.
More convincing for high-RR entries.
Higher probability: If Zone 1 fails or only wicks price, Zone 2 may provide the main entry opportunity.
Entry trigger: Shift in LTF structure with volume spike or breaker flip.
✅ Trade Signal Suggestions
🟦 Setup 1: Buy from Zone 1
Entry: 3410 (upon bullish confirmation)
SL: 3400 (below structure low)
TP: 3434 (prior high)
RR: ~2.4R
Note: Only take if price forms bullish structure (MSS or BOS) on lower timeframe.
🟦 Setup 2: Buy from Zone 2
Entry: 3380/3384 (upon confirmation)
SL: 3372 (below demand zone)
TP: 3411 or 3434 (scalp to intraday swing)
RR: ~1:3 or better
Note: Wait for clean rejection or reversal candle from this zone.
⚠️ Risk Management
Risk 0.5–1% per trade.
Use entry confirmation such as:
Bullish engulfing
Fair value gap reaction
Break of internal structure

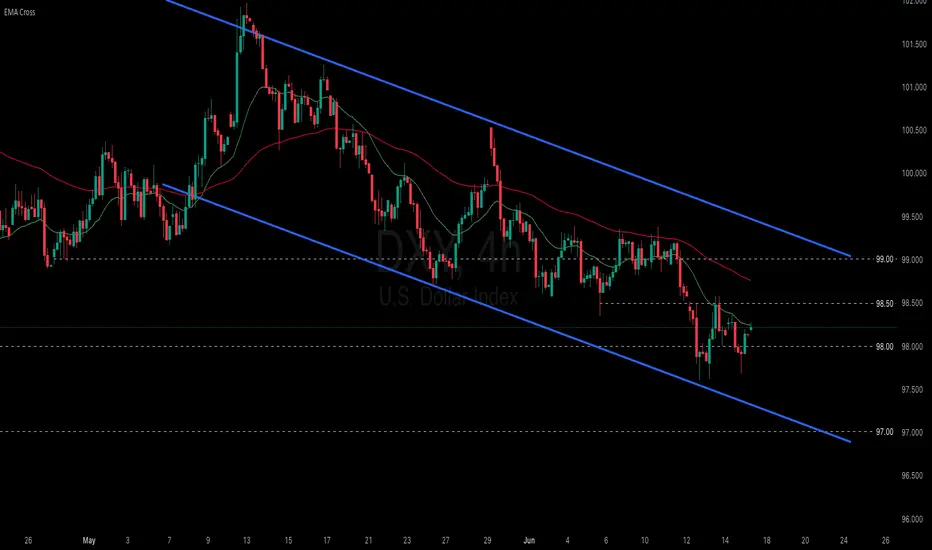
Tariff uncertainty keeps weighing on the dollar.
Geopolitical risks in the Middle East have eased slightly amid signs of potential negotiations, prompting markets to shift their focus back to the upcoming FOMC and tariffs. Following talks with Canadian Prime Minister Carney, President Trump stated that a trade deal with Canada could be reached within weeks, and also confirmed that a trade agreement with the UK has been signed.
Meanwhile, markets are almost certain that the Fed will keep rates unchanged at the upcoming FOMC, with the probability priced at 99.8%. Wells Fargo expects the inflation outlook to rise due to the delayed impact of higher tariffs, projecting that the year-end median federal funds rate will climb by 25bps to 4.125%.
DXY is consolidating within the 97.50–98.50 range, remaining below both EMAs, which suggests a potential continuation of bearish momentum. If DXY breaks below the support at 98.00, the index may retreat to 97.50. Conversely, if DXY breaches above the resistance at 98.50 and the descending trendline, the index could gain upward momentum toward 99.00.
Gold is giving up a Set up! Been waiting for this set up. But trying to remain disciplined on this one. I Need to see a sweep of lows at this point in order to be interested in the buy. Once we see that its on. Until then we sit on hands and wait.
