Tariff uncertainty keeps weighing on the dollar.
Geopolitical risks in the Middle East have eased slightly amid signs of potential negotiations, prompting markets to shift their focus back to the upcoming FOMC and tariffs. Following talks with Canadian Prime Minister Carney, President Trump stated that a trade deal with Canada could be reached within weeks, and also confirmed that a trade agreement with the UK has been signed.
Meanwhile, markets are almost certain that the Fed will keep rates unchanged at the upcoming FOMC, with the probability priced at 99.8%. Wells Fargo expects the inflation outlook to rise due to the delayed impact of higher tariffs, projecting that the year-end median federal funds rate will climb by 25bps to 4.125%.
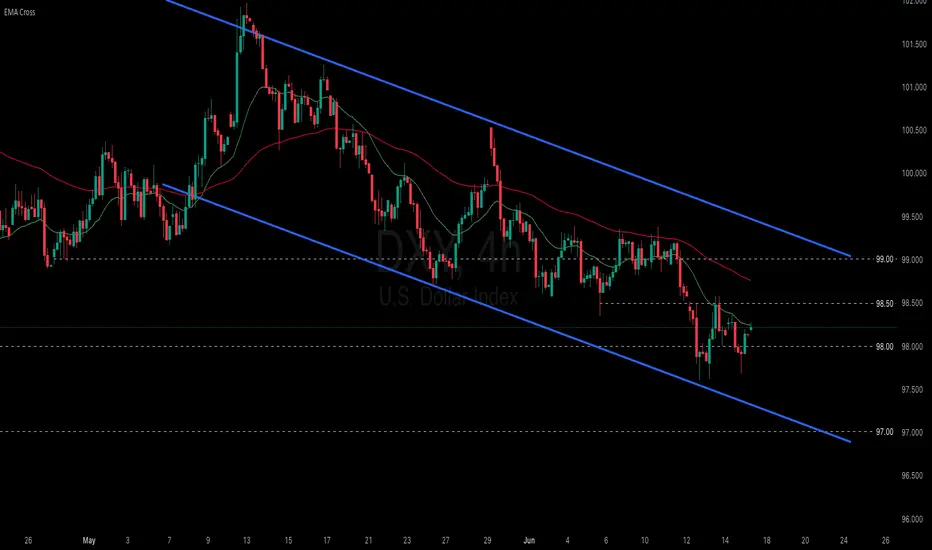
DXY is consolidating within the 97.50–98.50 range, remaining below both EMAs, which suggests a potential continuation of bearish momentum. If DXY breaks below the support at 98.00, the index may retreat to 97.50. Conversely, if DXY breaches above the resistance at 98.50 and the descending trendline, the index could gain upward momentum toward 99.00.
DXY
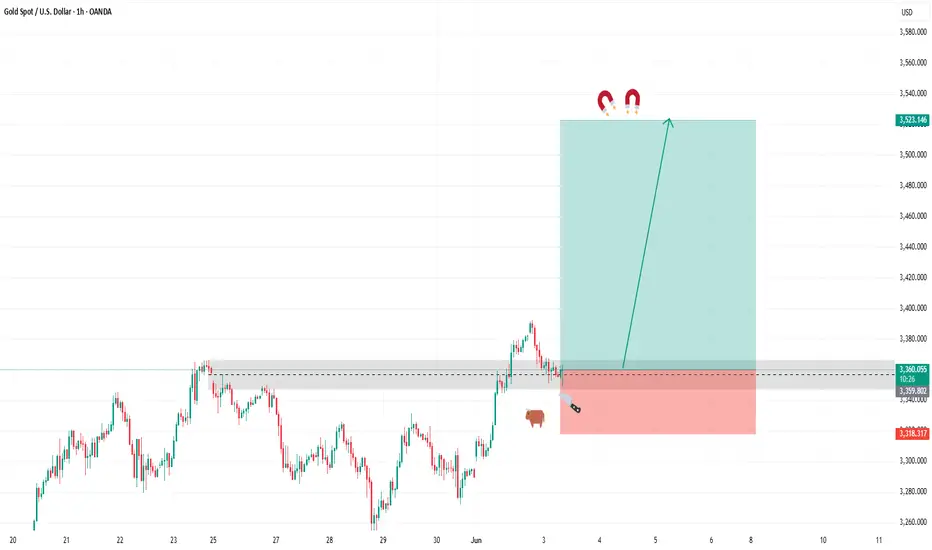
Gold is giving up a Set up! Been waiting for this set up. But trying to remain disciplined on this one. I Need to see a sweep of lows at this point in order to be interested in the buy. Once we see that its on. Until then we sit on hands and wait.

Bullish bounce?USD Dollar Index (DXY) has bounced off the pivot and could rise to the 1st resistance.
Pivot: 97.81
1st Support: 97.19
1st Resistance: 98.69
Risk Warning:
Trading Forex and CFDs carries a high level of risk to your capital and you should only trade with money you can afford to lose. Trading Forex and CFDs may not be suitable for all investors, so please ensure that you fully understand the risks involved and seek independent advice if necessary.
Disclaimer:
The above opinions given constitute general market commentary, and do not constitute the opinion or advice of IC Markets or any form of personal or investment advice.
Any opinions, news, research, analyses, prices, other information, or links to third-party sites contained on this website are provided on an "as-is" basis, are intended only to be informative, is not an advice nor a recommendation, nor research, or a record of our trading prices, or an offer of, or solicitation for a transaction in any financial instrument and thus should not be treated as such. The information provided does not involve any specific investment objectives, financial situation and needs of any specific person who may receive it. Please be aware, that past performance is not a reliable indicator of future performance and/or results. Past Performance or Forward-looking scenarios based upon the reasonable beliefs of the third-party provider are not a guarantee of future performance. Actual results may differ materially from those anticipated in forward-looking or past performance statements. IC Markets makes no representation or warranty and assumes no liability as to the accuracy or completeness of the information provided, nor any loss arising from any investment based on a recommendation, forecast or any information supplied by any third-party.

NZDUSD → Correction and liquidity capture ahead of growthFX:NZDUSD , following a sharp decline during the Pacific-Asian session, is testing the support of the upward trend and the liquidity zone...
The dollar is correcting amid escalating tensions in the Middle East. This is a temporary move, and the market may return to its main trend. The currency pair is forming a false breakdown of support
Against the backdrop of an uptrend and a weak dollar, the currency pair is testing support at 0.6000. The reaction is weak at the moment, but there is a chance for growth if the price consolidates above 0.6020. I do not rule out a retest of the liquidity zone at 0.5989 before growth
Support levels: 0.6000, 0.5989
Resistance levels: 0.6068
The inability to continue falling and the formation of a local reversal structure relative to 0.6000 (price consolidation above 0.6020) may support the market. I do not rule out that the market may decline to the liquidity zone of 0.5989 before rising.
Best regards, R. Linda!

$DXY weakness and EM markets: $NIFTY more upside? The recent weakness in TVC:DXY is well documented. We have analyzed it here in detail in our blogs. This weakness is giving wings to all kinds of risk assets including Ems. One of our favorite EM in this space has been India and NSE:NIFTY index for quiet some time. It is the only EM which is close to beating S&P 500 over the last 5-year period. We have been recently bullish at NSE:NIFTY and published new targets on June 6. Please check the post in the link here.
NSE:NIFTY : New highs incoming; 27500 can be cycle highs for NSE:NIFTY by RabishankarBiswal — TradingView
The road to the medium-term target of 27500 on NSE:NIFTY has to do with the weakness of $DXY. As we see, lower lows and lower highs in the Dollar index TVC:DXY provides the required boost to risky assets like Stocks, Crypto and EMs. Even if we have some recent choppiness in the market the upward momentum will continue. By the end of July, we might see TVC:DXY at 96 up 2.5% and NSE:NIFTY @ 26000 up 5%.
Verdict : Pair Trade : Short TVC:DXY to 96 and Long NSE:NIFTY to 26000.

Short Idea on DXYBased on :
- Investors surprised by the cpi new and seeking safety in bonds (ZB1!) making dollar go down
- break out of an important support level
- 2 supply zones

XAUUSD - Is the gold bullish trend over?!Gold is trading in its ascending channel on the four-hour timeframe, above the EMA200 and EMA50. We should wait for consolidation or not above the drawn trend line to determine the future path of gold, which can be entered after its failure in the formed line, and on the other hand, if gold corrects towards the demand zone, it can be purchased in the short term with appropriate risk-reward.
Over the past week, the gold market moved within a narrow, calm range and showed little reaction to encouraging inflation data—until geopolitical developments once again shifted the landscape. Heightened tensions in the Middle East brought safe-haven demand back to the forefront of traders’ minds.
Following initial reports of regional unrest, gold quickly climbed from $3,324 to a weekly high of $3,377. Although the price saw a brief correction down to around $3,345, it resumed its upward momentum and opened Thursday’s trading session just one dollar below the symbolic $3,400 mark.
Rich Checkan, President and CEO of Asset Strategies International, commented on these recent geopolitical developments, stating: “The market’s direction is clear: it’s upward. With tensions rising following Israel’s attack on Iran, there’s no doubt gold will continue its climb next week.”
Darin Newsom, senior analyst at Barchart.com, also pointed to rising risks both domestically and globally: “Gold is on an upward path. Domestic unrest in the U.S., escalating conflict in the Middle East, broad selling of the U.S. dollar by other countries, and expectations that the Federal Reserve will hold rates steady—all support gold’s rise.”
Meanwhile, Daniel Pavilonis, senior broker at RJO Futures, analyzed the simultaneous reactions of gold and oil amid the recent Middle East tensions, looking for clues on their future direction. He explained: “Oil’s behavior can serve as an indicator for gold, as both are seen as inflation hedges and are sensitive to bond yields.”
Surprised that gold hasn’t yet reclaimed its April highs, Pavilonis emphasized: “If tensions escalate further, we could see additional gains. But if Iran moves toward negotiations or a truce, gold could remain elevated but range-bound, similar to the past two months. Breaking previous highs would require a stronger catalyst and a more significant worsening of the crisis.” He noted that while geopolitical tensions are currently the primary driver of gold’s strength, such rallies are typically short-lived.
Pavilonis added: “We saw a similar pattern last April—gold and oil spiked sharply but quickly corrected. Back then, trade war concerns with China persisted, inflation rates had fallen noticeably, and the initial supportive factors for gold gradually faded. Now, once again, a fresh geopolitical shock has emerged that may temporarily drive gold higher.”
After a week where market attention focused mainly on U.S. inflation data, investors’ focus in the coming days will shift to central bank policy decisions and potential signals regarding the future path of interest rates.
The trading week begins Monday with the release of the Empire State Manufacturing Index, offering an early view of industrial activity in New York. That same day, the Bank of Japan will announce its latest interest rate decision, potentially setting a new tone for Asian markets and the yen’s value.
On Tuesday, U.S. May retail sales data will be published—a key indicator of consumer strength. Signs of weakness could bolster market expectations for a rate cut.
Wednesday will be the pivotal day, as the Federal Reserve reveals its rate decision. While markets have fully priced in a pause in tightening, attention will focus on Jerome Powell’s remarks for any hints of rate cuts in the coming months. Also on Wednesday, May housing starts data and weekly jobless claims will be released.
With U.S. markets closed Thursday for Juneteenth, the spotlight will shift to monetary policy decisions from the Swiss National Bank and the Bank of England, both of which could impact currency market volatility. The week wraps up Friday with the Philadelphia Fed Manufacturing Index, a leading gauge closely watched by traders to assess the health of the manufacturing sector in the U.S. Northeast.

DXY ||| • Sell Completed Below Orange Line📉 Pair: GBP/USD
⏱ Timeframe: 4H
🔶 Orange Line = Major S/R Zone
📌 Confirmed Break + Retest
🎯 Profit Locked | Risk Managed
Strategy: Elliott Wave + Parallel Channel + SMC (Break of Structure)
🔶 Status:
Completed Wave 5 inside falling wedge
Sell executed after orange support break
Anticipating accumulation phase > BOS > bullish reversal
📍Key Zones:
Demand zone near 97.455
Resistance near 98.426
🎯 Next Steps: Looking for bullish structure post BOS + Wave 2 pullback.
🔁 Watch for:
Accumulation near lower trendline
Structure shift > Breakout of wedge
Long confirmations in late July – early August
🟢 Plan the trade, trade the plan.

SHOT ON EUR/USDEUR/USD Has given us a nice double top at a major resistance level.
Since then it has broken the neckline of that double bottom, creating a new low, engineering liquidity, sweeping it and now getting ready to tap into supply before it should fall.
The Dxy is also getting ready to rise from a demand level so this should also aid in pushing EU down.
Looking to catch over 200 pips.

USDCHF → Retesting resistance will lead to a declineFX:USDCHF , having failed to reach its global target after breaking through support, is turning back to retest the zone of interest at 0.8157. A fall in the dollar could trigger a decline in prices...
After breaking through support and falling to 0.8055, a correction is forming towards the zone of interest and liquidity at 0.8157. After reaching the local target, the price may return to the global target (liquidity zone) at 0.8042.
The dollar returned to its downward phase at the opening of the session, to which the forex market reacted accordingly. Most likely, bearish pressure may also affect the USDCHF currency pair, which continues to follow the downward trend.
Resistance levels: 0.8157
Support levels: 0.8055, 0.8042
A retest of resistance amid high volatility could form a false breakout (liquidity capture) before the decline continues within the downtrend.
Best regards, R. Linda!

Could the DXY reverse from here?The price is reacting off the pivot and could rise to the 1st resistance which is an overlap resistance.
Pivot: 97.71
1st Support: 94.66
1st Resistance: 101.87
Risk Warning:
Trading Forex and CFDs carries a high level of risk to your capital and you should only trade with money you can afford to lose. Trading Forex and CFDs may not be suitable for all investors, so please ensure that you fully understand the risks involved and seek independent advice if necessary.
Disclaimer:
The above opinions given constitute general market commentary, and do not constitute the opinion or advice of IC Markets or any form of personal or investment advice.
Any opinions, news, research, analyses, prices, other information, or links to third-party sites contained on this website are provided on an "as-is" basis, are intended only to be informative, is not an advice nor a recommendation, nor research, or a record of our trading prices, or an offer of, or solicitation for a transaction in any financial instrument and thus should not be treated as such. The information provided does not involve any specific investment objectives, financial situation and needs of any specific person who may receive it. Please be aware, that past performance is not a reliable indicator of future performance and/or results. Past Performance or Forward-looking scenarios based upon the reasonable beliefs of the third-party provider are not a guarantee of future performance. Actual results may differ materially from those anticipated in forward-looking or past performance statements. IC Markets makes no representation or warranty and assumes no liability as to the accuracy or completeness of the information provided, nor any loss arising from any investment based on a recommendation, forecast or any information supplied by any third-party.

DXYWe are expecting DXY to give us bullishness in this week first.
Disclosure: We are part of Trade Nation's Influencer program and receive a monthly fee for using their TradingView charts in our analysis.

Global Activities are looking to Push Gold bullishWaiting to see a full on break out before confirming its going to be bullish for the week but it sure does look like that's what its going to be for the next few days. Just be patient and wait for price to confirm.

BULLISH GOLDIn todays session we are adding more buys to our initial bias on bullish gold heading for new highs. Our entry is at 3360.84 tp new highs of 3523.15 and stop for this one is 3318. Adjust your positions according to your risk management. Use proper money management. Best of luck
BTC update!!Good day traders, here is another update on BTC and I have adjusted my narrative but my overall bias is still remaining bearish…

Natural Gas | Oil | Dollar | Silver | Gold Price Forecast.Natural Gas | Oil | Dollar | Silver | Gold Price Forecast.
COMEX:SI1! COMEX:GC1! NYMEX:CL1! AMEX:UNG

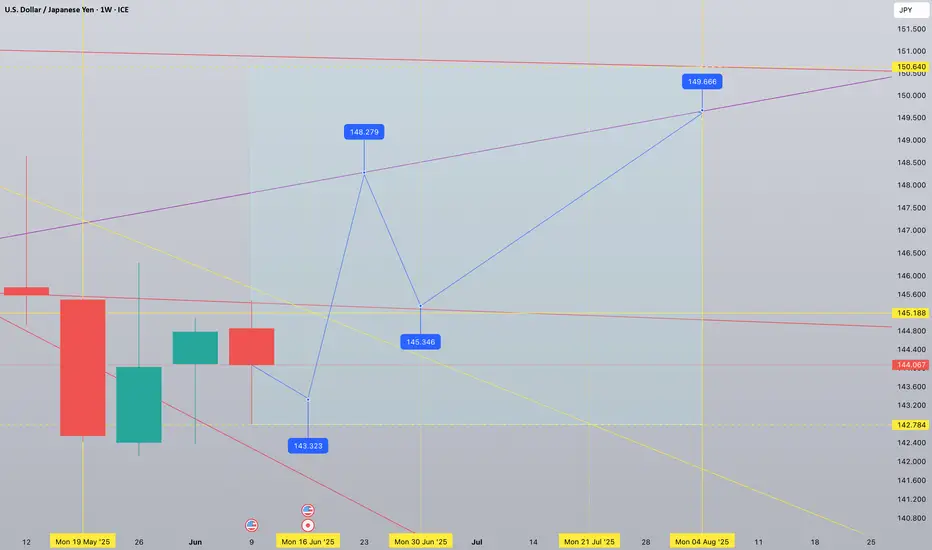
USDJPY 1W forecast until September 2025A huge inverted Head&Shoulders has been started. Volatility chop-chop. Left shoulder is ready and the price is heading up to the base at 145.188
In the middle of June we will see a fast fall to print Head bottoming at 138.75
Before printing Right shoulder the price has to visit the base again in the beginning of August 2025
What will happen in September? I will keep posting and updating (if I see necessity) 1W chart here. For 1D weekly updates check 'Also on' in my Profile.

USDJPY 1W tf forecast until August 2025 Current midterm bias is bullish. 150,64 and 142,78 are extreme levels to be respected by the price action. One more week of red week of sideways movement will actually form a reversal pattern followed by a strong upward spike. A powerful breakout to 148,27 is to be retested at 145,34 - healthy retest. July will show an organic growth topping at 149.66 in the beginning of August 2025
DXY: Local Bullish Bias! Long!
My dear friends,
Today we will analyse DXY together☺️
The market is at an inflection zone and price has now reached an area around 97.757 where previous reversals or breakouts have occurred.And a price reaction that we are seeing on multiple timeframes here could signal the next move up so we can enter on confirmation, and target the next key level of 97.970.Stop-loss is recommended beyond the inflection zone.
❤️Sending you lots of Love and Hugs❤️

DOLLAR INDEX (DXY): Bearish Again?!
Dollar Index leaves clear bearish clues after a test
of a significant intraday/daily supply area.
I think that the market will continue falling at reach at least 98.04 level.
❤️Please, support my work with like, thank you!❤️

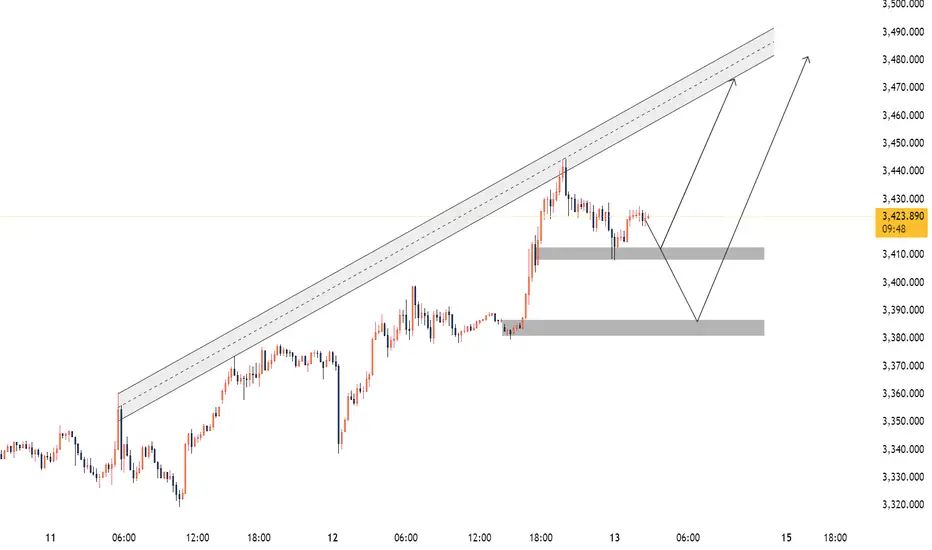
Gold/XAUUSD Possible Move 13 June 2025 The market continues to exhibit strong bullish momentum within a well-respected ascending channel. After an impulsive breakout to the upside, price is now retracing in a healthy corrective move, offering high-probability buying opportunities at two well-defined demand zones.
🔍 Technical Structure:
Price is trending inside an ascending parallel channel, with clear respect for both the median and outer trendlines.
A significant bullish impulse pushed price above previous local highs, suggesting institutional interest and continuation potential.
Currently, price is retracing and approaching two key demand areas that align with bullish continuation setups.
🎯 Key Buy Zones:
✅ Zone 1: 3,408 – 3,412
Minor mitigating demand zone, likely to act as support if the market retraces slightly.
Ideal for aggressive long entries if price shows confirmation (e.g., bullish engulfing, LTF structure shift).
✅ Zone 2: 3,380 – 3,385
Deeper unmitigated demand zone, aligned with a potential liquidity sweep and strong institutional support.
Considered a high-probability entry area for larger impulse moves.
🌍 Fundamental Context:
Recent geopolitical tensions in the Middle East, can lead to sharp intraday moves, with 100+ pip 5-minute candles not being out of the question.
Given this backdrop, demand zones become critical areas for smart money entries as traders seek to align technical levels with macro drivers.
📈 Trade Signal:
Bias: 🔵 Bullish
Buy Zone 1: 3,408 – 3,412
SL: Below 3,395
TP: 3425, 3440, trail till 3,470
R:R: ~1:3
Buy Zone 2: 3,380 – 3,385
SL: Below 3,368
R:R: ~1:4
🧠 Final Note:
Watch for price reaction at both zones. Use LTF confirmation before entry and respect your risk management. With news-driven volatility in play, quick movements are expected, offering excellent trade opportunities for prepared traders.
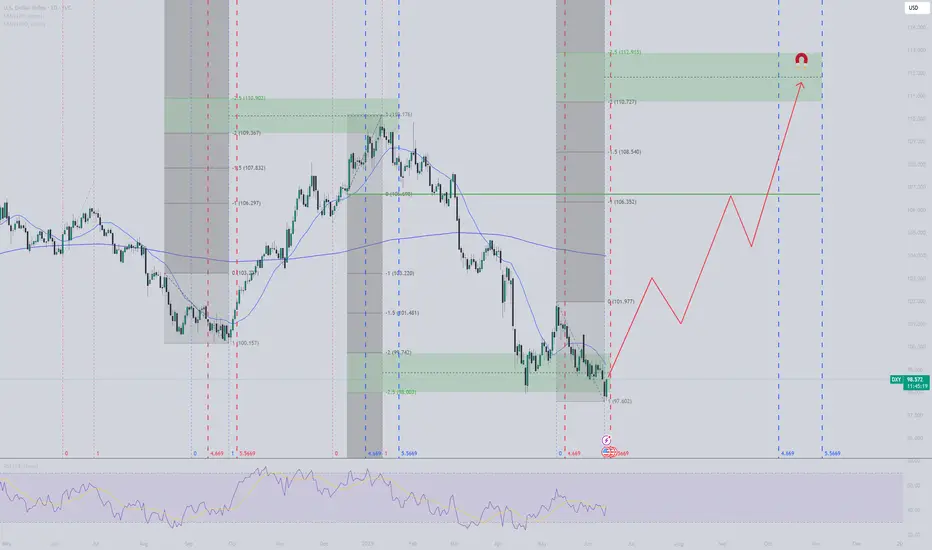
DXY ready for takeoffDXY seems to have reached the bottom for now, as planned within the marked red timezone. I expect a bullish run until October (blue timezone) with target around 111-113 USD, which corresponds to 2-2.5 stdv from this last manipulation leg lower. All areas marked in chart.
Safe-Haven Demand Boosts Gold as Middle East Tensions EscalateHey Traders,
In today’s trading session, we are monitoring XAUUSD for a buying opportunity around the 3,380 zone. Gold is currently trading in an uptrend and is experiencing a correction phase as it pulls back toward this key support and resistance area.
On the fundamental side, reports indicate that Israel struck Iran overnight — fueling a classic geopolitical risk-off sentiment. This escalation is driving strength in safe-haven assets while putting pressure on riskier markets. Gold typically benefits from this kind of uncertainty, adding further weight to the technical setup we’re seeing today.
Trade safe,
Joe
