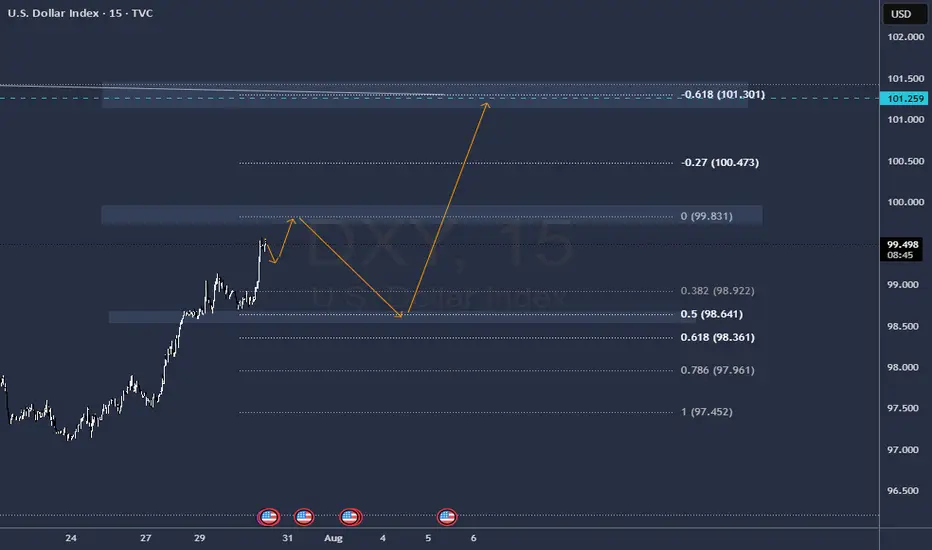
Dollar Index (DXY): Will It Rise More?!
Dollar Index is on its way to 100.4 resistance.
A breakout of a major supply cluster on a daily after FED meeting
yesterday indicates a strong bullish pressure.
I think that growth will continue soon.
❤️Please, support my work with like, thank you!❤️
DXY

DXY USDOLLAR CRASH Incoming!Long-term fundamentals are bearish
Long-term sentiment = bearish
Long-term technicals = bearish
Trump wants a weaker dollar + FED injecting endless amounts of cash into the markets
driving stocks/ gold up, and the dollar down, losing purchasing power.
My plan is to look for shorts on the 1hr-4hr timeframe with lower timeframe confirmation.
Once price starts turning over, day-traders can join in.
Agree or disagree?

U.S. Dollar Index (DXY) – Pro Analysis | 1H Chart |1. Strong Bullish Momentum
DXY broke out sharply above the 99.41 resistance, showing clear strength from bulls with minimal pullbacks during the rally.
2. Short-Term Rejection at Supply
Price was rejected from the 99.978 zone — a key supply area. This indicates the presence of active sellers near the psychological 100 level.
3. Retesting Breakout Structure
Currently hovering just above 99.669, the DXY is retesting the previous breakout level. This could act as short-term support if bullish momentum resumes.
4. Next Key Zones
Resistance: 99.978 → 100.534
Support: 99.411 → 98.92
Break below 99.411 may invalidate the breakout.
5. Outlook
Bias remains bullish above 99.41. However, failure to reclaim 99.978 soon may signal temporary exhaustion or consolidation before next leg up.

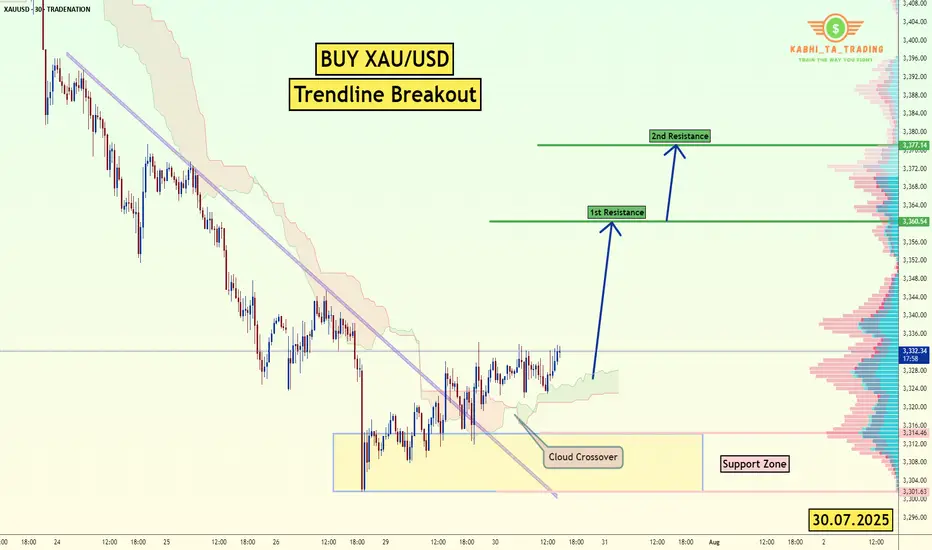
XAU/USD Trendline Breakout (30.07.2025)The XAU/USD pair on the M30 timeframe presents a Potential Buying Opportunity due to a recent Formation of a Trendline Breakout Pattern. This suggests a shift in momentum towards the upside and a higher likelihood of further advances in the coming hours.
Possible Long Trade:
Entry: Consider Entering A Long Position around Trendline Of The Pattern.
Target Levels:
1st Resistance – 3360
2nd Resistance – 3377
🎁 Please hit the like button and
🎁 Leave a comment to support for My Post !
Your likes and comments are incredibly motivating and will encourage me to share more analysis with you.
Best Regards, KABHI_TA_TRADING
Thank you.
Disclosure: I am part of Trade Nation's Influencer program and receive a monthly fee for using their TradingView charts in my analysis.
WE GOT THE SWEEP ON GOLD!!!!THIS is the move I was waiting for! we got the full sweep on levels. looking for price to flip back to bullish pressure from here. Now we just wait for the entry to show as we move into the Asian Killzone.

USD Dollar Index (DXY): Pushing Higher As Forecast!Welcome back to the Weekly Forex Forecast for the week of July 30 - Aug1
In this video, we will analyze the following FX market:
USD Index
In my last USD video, the forecast was for higher prices. Check the related links below to see that video forecast. It played out exactly as analyzed. The +FVG was used to push for higher prices. The FOMC decision to keep the rate unchanged only pushed it further along.
Enjoy!
May profits be upon you.
Leave any questions or comments in the comment section.
I appreciate any feedback from my viewers!
Like and/or subscribe if you want more accurate analysis.
Thank you so much!
Disclaimer:
I do not provide personal investment advice and I am not a qualified licensed investment advisor.
All information found here, including any ideas, opinions, views, predictions, forecasts, commentaries, suggestions, expressed or implied herein, are for informational, entertainment or educational purposes only and should not be construed as personal investment advice. While the information provided is believed to be accurate, it may include errors or inaccuracies.
I will not and cannot be held liable for any actions you take as a result of anything you read here.
Conduct your own due diligence, or consult a licensed financial advisor or broker before making any and all investment decisions. Any investments, trades, speculations, or decisions made on the basis of any information found on this channel, expressed or implied herein, are committed at your own risk, financial or otherwise.

DXY attempting an inverse H&S breakoutSeeing a big green candle today on dxy after confirming the neckline of the inverse head and shoulders pattern as support on the previous daily candle.
DXY with interest rates With interest rates remaining steady, the U.S. Dollar is currently moving in a bullish direction.
As shown in the chart, it seems likely that price will break the previous high and form a bullish Quasimodo (QM) pattern. The price may then reach the 50% Fibonacci level.
After that, we should wait and observe the market's reaction.
If price gets rejected from the 103 zone — especially if accompanied by a rate cut or bearish price action — we could see a sharp decline toward the 95 area.
This 95 zone also aligns with a key weekly Fibonacci support level on the Dollar Index.
As long as the Federal Reserve maintains its hawkish stance, the U.S. Dollar may continue its upward momentum. However, the 103–104 zone — which aligns with the 50% Fibonacci retracement and a significant supply area — could serve as a strong resistance.
If price gets rejected from this area and we simultaneously see signs of a rate cut or weakening U.S. economic data, a trend reversal and corrective phase could begin. In that case, lower targets around 95 or even 93 could become likely in the medium term.
good luck

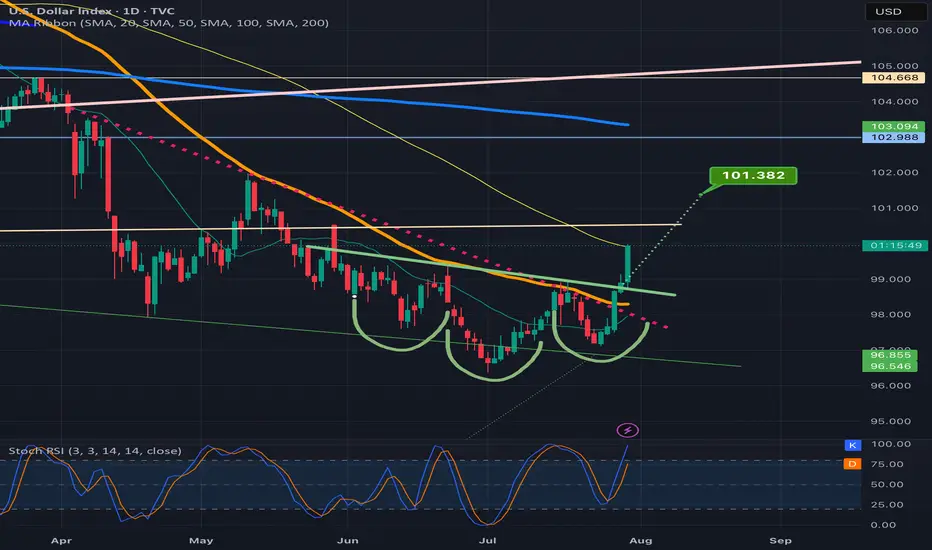
DXY Bulls Ready — Can Powell Spark the Rally?📊 DXY Pre-FOMC Outlook
In my previous analysis released on Monday, I expected the Dollar Index to fill the gap around the 98.60 zone and range below the key red line at 99.429.
Now, with less than 8 hours left until the highly anticipated FOMC rate decision, it’s time to take a closer look at tonight’s event and what it could mean for the markets.
From a purely technical perspective — setting the news aside — the Dollar Index looks ready to break through the crucial 100 level and kick off a strong bullish rally.
However, recent political pressure from Trump urging rate cuts, along with visible tension between him and Fed Chair Jerome Powell, has created uncertainty. If it weren’t for these conflicting signals, I would’ve confidently expected a clean breakout above 100.
As much as I enjoy trading news-driven events, I’ll likely stay out of the market tonight and observe from the sidelines. The setup is tempting, but the dual narratives make it risky.
That said — if you ask for my final take — I believe the stage is fully set for a bullish dollar and a corresponding drop in gold, EUR, GBP, and other major assets.
Let’s see how it plays out. 👀💥

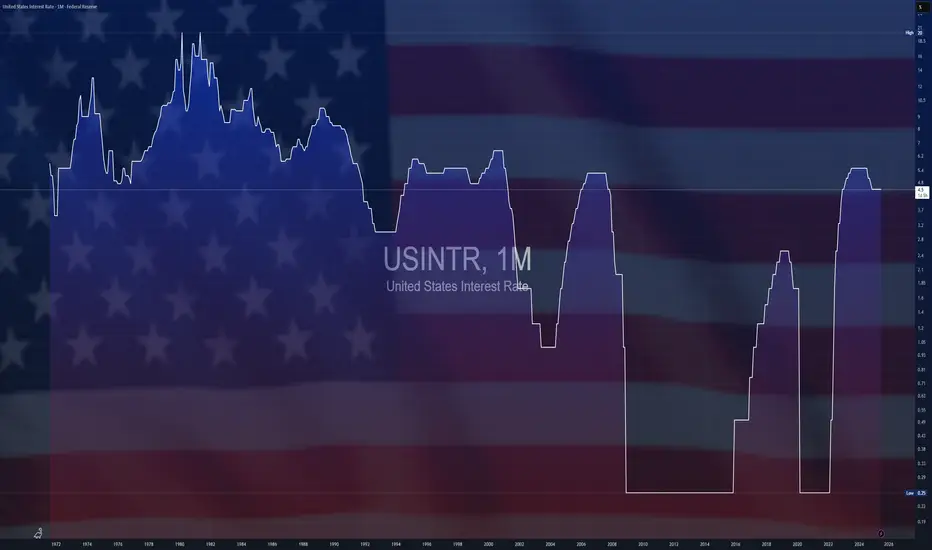
$USINTR -Feds Leaves Rates Steady (July/2025)ECONOMICS:USINTR
July/2025
source: Federal Reserve
- The Federal Reserve held rates steady at 4.25%–4.50% for a fifth straight meeting, defying President Trump’s demands for cuts even after positive GDP growth .
Still, two governors dissented in favor of a cut—the first such dual dissent since 1993.
Policymakers observed that, fluctuations in net exports continue to influence the data, and recent indicators point to a moderation in economic activity during the first half of the year.
The unemployment rate remains low, while Inflation somewhat elevated.
DXY still in downward channel. Rejection here = BTC rally The DXY is still in a downward sloping channel and trying to break back above the previous 2-year cycle low, but I think will reject here and kick off the next leg of the BTC rally.
Ideally we get a big DXY drop and ultimately break below the 95% level and on down into 'Bitcoin Super Rally Zone'🚀

Gold Alert: Key Levels for Potential Sell Setup!Good morning, my friends 🌞
Here’s today’s gold analysis. I'm expecting a decline in gold prices, specifically from the 3,383–3,420 level.
Once a correction starts around that zone, my target will be 3,310. Gold has been riding a strong uptrend, and if we reach those levels, I’ll be expecting a pullback and opening a sell position accordingly.
Please set your stop loss based on your personal margin preferences.
Your likes and support are my biggest motivation for continuing to share these analyses. Thank you to everyone showing appreciation 🙏

Just a bounce off or a real trend reversal?DXY sits on a major support zone. Price often delivers a reflex bounce at strong levels before continuing the prevailing trend, so a quick pop isn’t proof of a new bull run. DXY is closely linked to US real yields (10y TIPS): if real yields roll over as the Fed eases, USD strength likely fades; if real yields stay firm, a durable reversal is more plausible.
This post is for informational/educational purposes only and is not investment advice or a solicitation to buy/sell any security. Past performance is not indicative of future results. I may hold positions related to the instruments mentioned.
EURUSDHello Traders! 👋
What are your thoughts on EURUSD?
EUR/USD kicked off the week with a sharp drop of nearly 200 pips, driven by renewed concerns over U.S. tariff policies. This strong bearish momentum signals intensified selling pressure across the board.
The pair is now approaching a support zone, which has previously triggered bullish reactions.
However, given the current strong bearish sentiment, there is a real risk this support may not hold.
Our bias remains bearish overall.
If the pair finds temporary support at this level, a short-term corrective bounce is possible.
But ultimately, we expect a continuation of the downtrend toward lower support levels after the correction completes.
Can this support zone stop the bleeding, or is more downside coming? Let us know your thoughts! 👇
Don’t forget to like and share your thoughts in the comments! ❤️

DXY: Bulls Are Winning! Long!
My dear friends,
Today we will analyse DXY together☺️
The in-trend continuation seems likely as the current long-term trend appears to be strong, and price is holding above a key level of 98.471 So a bullish continuation seems plausible, targeting the next high. We should enter on confirmation, and place a stop-loss beyond the recent swing level.
❤️Sending you lots of Love and Hugs❤️

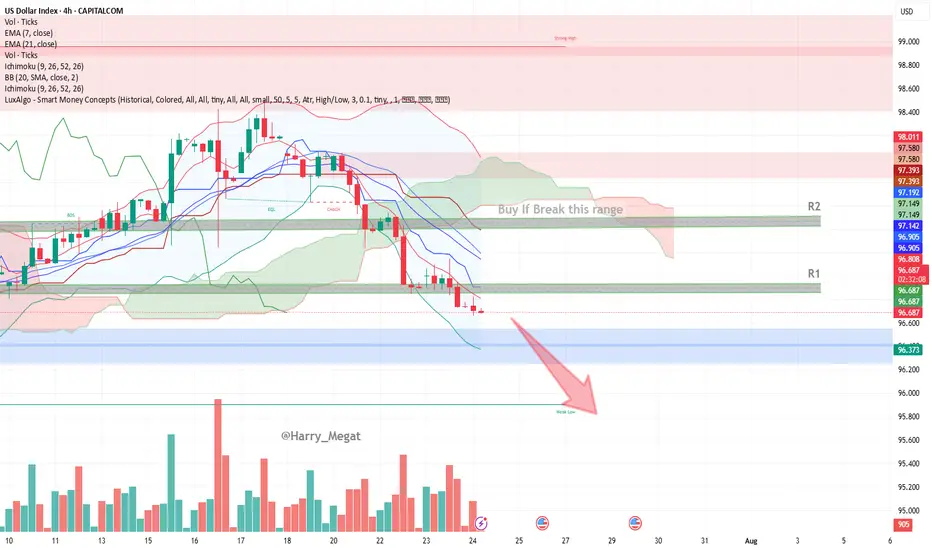
US Dollar Index (DXY) – 4H Chart AnalysisUS Dollar Index (DXY) – 4H Chart Analysis
**Current Trend:** Bearish
Price trades below EMAs, Ichimoku Cloud, and within a bearish channel.
#**Bearish Scenario (Favorable)**
* **Conditions:**
* Price remains below EMA 7 & 21
* Stays under Ichimoku Cloud and 96.812 resistance (R1)
* Lower lows forming, bearish momentum increasing
* **Confirmation:**
Break below **96.37 (blue zone)**
* **Target:**
* TP1: 96.00
* TP2: 95.60 (next weak support)
**Bullish Scenario (Reversal)**
* **Conditions:**
* Price must break above **96.81 (EMA 7 + resistance)**
* Break above **R1 → 96.90**, and then above **R2 → 97.14–97.19**
* Bullish candles close above the Ichimoku cloud
* **Confirmation:**
Break and retest of **97.20**
* **Target:**
* TP1: 97.39
* TP2: 97.58 (key structure)
* TP3: 98.00 (major resistance)
**Bias:** Bearish unless DXY breaks above **97.20** with strong volume and bullish structure.
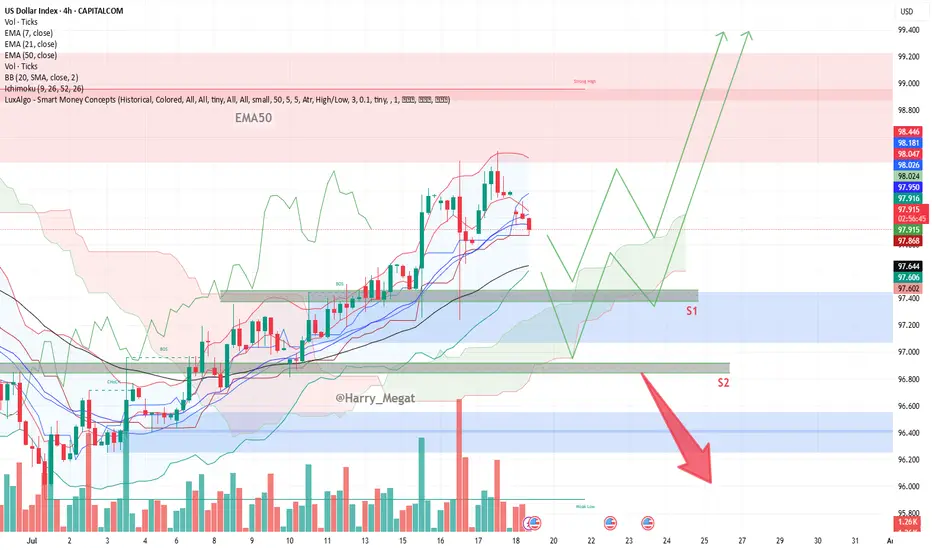
DXY Chart Outlook: Trend, Support, and Price Objectives**DXY Chart Outlook: Trend, Support, and Price Objectives (Reworded Analysis)**
**Trend Overview**
* The DXY chart reflects a **clear upward trajectory**, characterized by a sequence of **ascending highs and higher lows** — a classic sign of bullish momentum.
* Currently, the price is **retracing toward the 50-day EMA**, which appears to be holding as **dynamic support**.
* Two important **horizontal support zones** are marked:
* **Support 1 (S1):** \~97.400 (aligned with EMA-50)
* **Support 2 (S2):** \~96.800 (a deeper correction level)
**Projected Price Zones**
* **Near-Term Objective:** **98.800 to 99.000**
* A rebound from the EMA or S1 could send price higher toward this zone, continuing the current bullish structure.
* **Mid-Term Target:** **99.200 to 99.400**
* If the price successfully clears the 99.000 resistance, further bullish continuation could aim for this intermediate target range.
* **Extended Target:** **100.000+**
* A sustained breakout beyond 99.400 could open the path toward **psychological resistance at 100.000**, possibly higher on strong momentum.
**Support Zones to Watch**
* **S1 (97.400):** This level coincides with the 50-day EMA and represents a **first line of defense**.
* **S2 (96.800):** Should the price fall below S1, this secondary level could provide **stronger support** and potential bounce opportunity.
**Risk Management**
* Consider placing a **protective stop** just below S2 — around **96.500** — to safeguard against a potential trend reversal or deeper correction.
**Summary**
* The DXY remains **technically bullish**, with potential upside targets at **98.800**, **99.400**, and eventually **100.000+**.
* Traders can monitor **S1 and S2** for potential entries or trend confirmation.
* A **breakdown below 96.500** would invalidate the bullish setup and warrant caution.
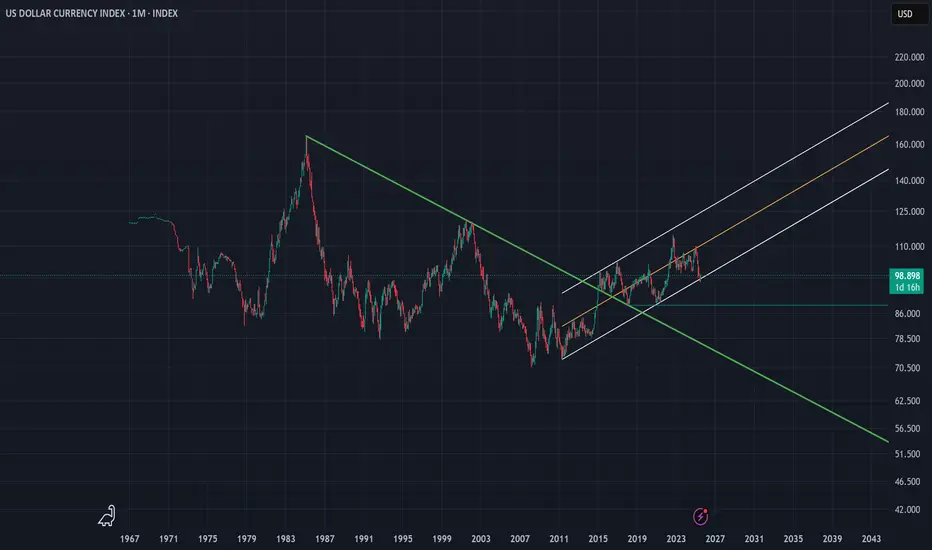
DXY | Timeframe: 1MWith the breakout of the downtrend line drawn since 1985 and its breach in late 2014, the DXY index officially entered a relatively stable upward trend and is currently oscillating within a parallel channel. Although, on the monthly timeframe, it has recently touched the lower boundary of the channel, we can expect at least a rise toward the channel’s midline. However, if the lower support of the channel is broken, a static support around the approximate rate of 88 can be considered a notable support level. Should this support also fail, the long-term downtrend dating back to 1985 would be regarded as the most important support for the DXY index. Meanwhile, moving averages such as the MA50, MA100, and other longer-period moving averages serve as dynamic supports along the way.
It is also worth mentioning that currently reaching the 120 level is considered an ideal target for the DXY index, and ultimately, it is by breaking this resistance zone that the index can reach its “Utopia”.
---------
I will try to continuously update this analysis of the TOTAL symbol according to market changes and developments. Also, I welcome reading your critiques and comments, so don’t forget to leave a comment!
DXY Rebound Pulls EURUSD Below 1.16Following the DXY’s significant rebound off a 17-year trendline, the EURUSD has broken below a trendline that connected all consecutive lows of 2025. This opens the door to further bearish risks, with key support levels now in sight.
If the pair closes cleanly below 1.15, 1.1440 and 1.1380, downside extensions could reach 1.12 and 1.11, respectively.
On the upside, a close back above the 2025 trendline and the 1.18 mark could reinstate bullish momentum, potentially lifting the pair toward the 2021 highs between 1.20 and 1.23.
Written by Razan Hilal, CMT

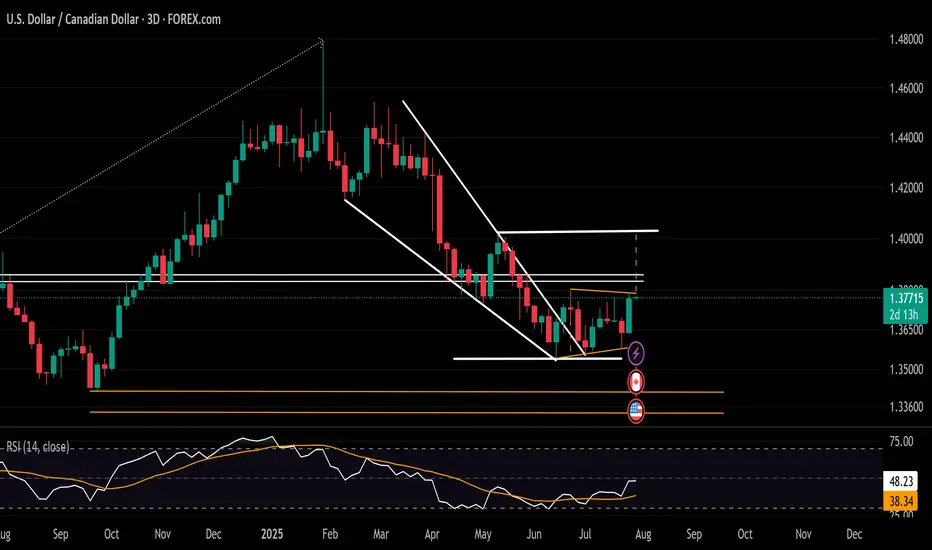
USDCAD Rebound Steadies Ahead of BOC and FOMC MeetingsAligned with the DXY holding above the 96 support and approaching the 100-resistance, the USDCAD is maintaining a rebound above the 1.3540 level.
It has maintained a hold beyond the boundaries of a contracting downtrend across 2025 and is aiming for the 1.38 resistance to confirm a steeper bullish breakout.
A sustained move above 1.38, which connects lower highs from June and July, while the RSI holds below the 50 neutral line, could extend gains toward the 1.40 level.
From the downside, should the breakout above 1.38 fail, the pair may remain trapped within the consolidation range extending from June, with initial support seen at 1.3580.
Written by Razan Hilal, CMT
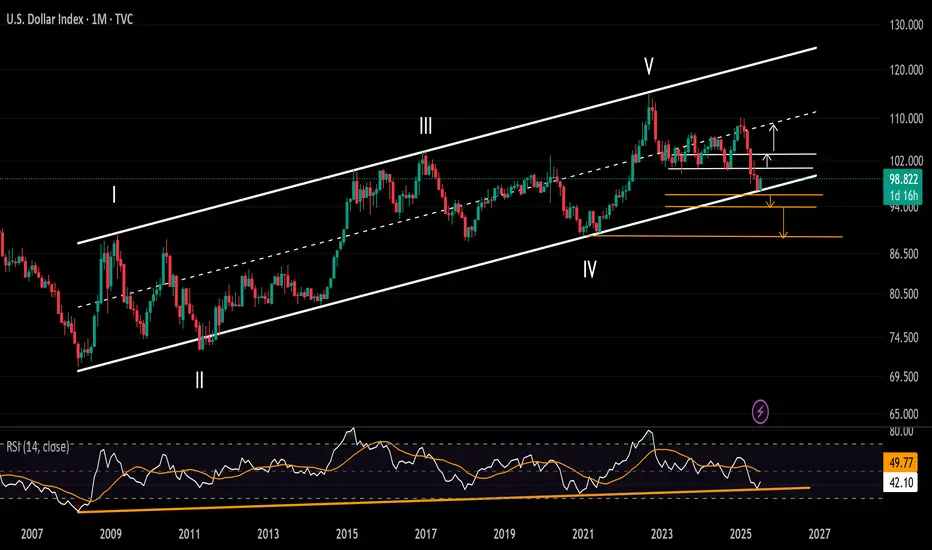
DXY Surge Pressures Currency Market in Volatile Market WeekThe US Dollar Index (DXY) has held its rebound off historical support zones on both the price chart and the RSI indicator throughout July. The monthly RSI is bouncing off a support line extending between the troughs of 2008 and 2020. Meanwhile, price action is rebounding from a support trendline that connects the lows of 2008, 2014, and 2021, within the 96–94 zone.
Bearish Scenario: A solid close below this support zone may confirm a long-term bearish signal, potentially pushing the index toward the 94 and 90 levels.
Bullish Scenario: A confident move above 100 and 103 could signal a reversal in the currency market, potentially leading the DXY back toward the mid-range of the long-standing channel between 105 and 107, originating from the 2008 lows.
Written by Razan Hilal, CMT
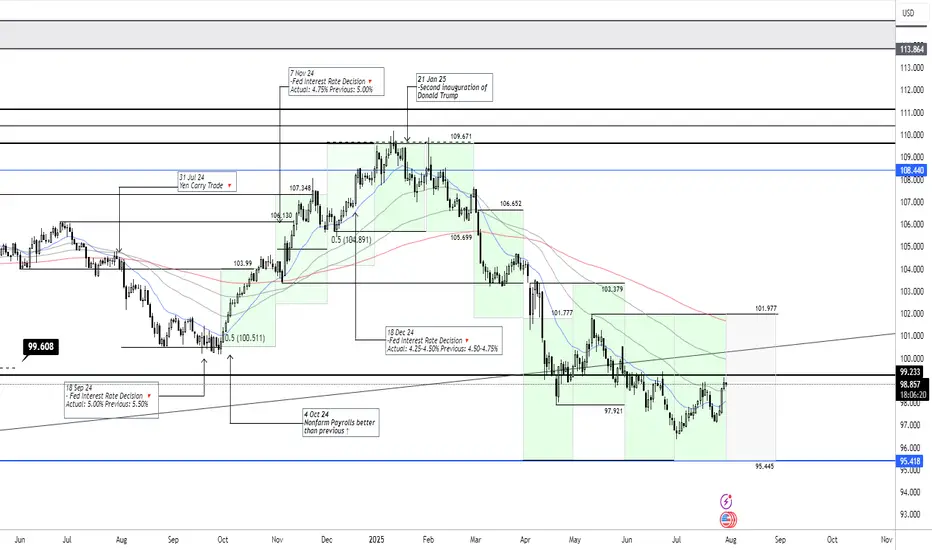
DXY July 30 2025The US dollar remains within the projected trading band, and we expect it to continue fluctuating within this range over the coming month.
Monthly Target: 95.445-101.977