EURUSDHello everyone.
I'm here to share a new EURUSD signal and also explain the reasoning behind this trade.
Normally, this strategy is designed for mid- to higher-timeframe trading. However, I noticed a signal from this strategy aligning perfectly with my own system on the 15M chart, which made the setup appear twice as strong.
That said, there's one caveat: the delta value is currently positive, which adds a bit of risk to this trade. Please take that into consideration.
🔍 Criteria:
✔️ Timeframe: 15M
✔️ Risk-to-Reward Ratio: 1:2
✔️ Trade Direction: Sell
✔️ Entry Price: 1.13636
✔️ Take Profit: 1.13473
✔️ Stop Loss: 1.13717
🔔 Disclaimer: This is not financial advice. It's a trade I’m taking based on my own system, shared purely for educational purposes.
📌 If you're also interested in systematic and data-driven trading strategies:
💡 Don’t forget to follow the page and subscribe to stay updated on future analyses
DXY

Price currently Bullish...But will it continue for the week?This is bullish price action i was expecting. Im just now waiting for a solid area for entry. Just have to wait for the killzones and things to line up inside of the killzone. cause outside of the killzones its nothing but chop and impulsive action that can throw you off.

GOLD - WAVE 4 CORRECTION TO $2,800 (UPDATE)Gold has climbed higher into our 0.365% zone, which I highlighted on yesterday's analysis. We will keep a close eye out to see if price action offers any rejection around this zone, for sellers to kick in. However, the closer it gets to the ATH, the higher chance of it creating a new ATH.

AUDUSD READY TO LAUNCH: HTF Bias + OB + FVG + PRIME SETUPBias:
We’re operating within a clear bullish higher time frame bias, confirmed by previous swing structure and continuous displacement to the upside. Price has consistently made higher highs and higher lows on the 4H and Daily chart.
Entry Zone:
✅ 4H Fair Value Gap (FVG) — a clean imbalance from prior bullish displacement. Price has now retraced into this inefficiency, a key area where smart money typically looks to re-accumulate.
✅ 1H Order Block (OB) — precisely overlapping the 4H FVG, strengthening the setup. This is the last bearish candle before the bullish move that created a market structure shift, now acting as a support zone.
This dual confluence—FVG + OB at a retracement level—marks a premium setup.

EURUSD EURUSD presents another buy opportunity, and I've just activated the trade.
I wanted to share it with you as well. This trade has three different Take Profit levels, which are:
1.13455 / 1.13563 / 1.13786
However, I personally plan to close the trade at 1.13455 in order to stick to my game plan.
This will be the last trade of the day for me.
🔍 Criteria:
✔️ Timeframe: 15M
✔️ Risk-to-Reward Ratio: 1:1.50 / 1:2.50 / 1:4.50
✔️ Trade Direction: Buy
✔️ Entry Price: 1.13290
✔️ Take Profit: 1.13455
✔️ Stop Loss: 1.13180
🔔 Disclaimer: This is not financial advice. It's a trade I’m taking based on my own system, shared purely for educational purposes.
📌 If you're also interested in systematic and data-driven trading strategies:
💡 Don’t forget to follow the page and subscribe to stay updated on future analyses.

GOLD H8 Update: Bulls will target 3600 USD🏆 Gold Market Mid-Term Update
📊 Technical Outlook Update
🏆 Bull Market Overview
▪️pullback looks complete now
▪️3000/3200/3400/3600 USD key S/R
▪️Reversal at 3200 USD
▪️Resistance near 3400 USD
▪️Bulls maintain strategic advantage
▪️Target for BULLS 3600 USD
▪️short-term dips are possible
▪️focus on buying dips
⭐️Recommended strategy
▪️BUY/HOLD accumulate dips
▪️TP BULLS 3600 USD
🏦Fed Outlook: Mixed data fuels speculation on policy shift. Analysts see gold’s pullback as a new buying opportunity.
🌏Asian Demand: China and India remain key forces in price direction, alternating as major buyers.
📦Tariff Watch: Ongoing U.S.-China trade tension continues to weigh on risk sentiment, keeping gold in play.
🛑Geopolitics: No major updates on Iran-U.S. talks, India-Pakistan, or Russia-Ukraine ceasefire yet. These remain key risk triggers.

EURUSDHello everyone!
I'd like to share an ideal **Buy opportunity** on the **EURUSD** pair with you. The trade is currently **active** on my side.
🔍 **Criteria:**
✔️ Timeframe: 15M
✔️ Risk-to-Reward Ratio: 1:1.17
✔️ Trade Direction: Buy
✔️ Entry Price: 1.13204
✔️ Take Profit: 1.13335
✔️ Stop Loss: 1.13092
🔔 **Disclaimer:** This is not financial advice. It's a trade I’m taking based on my own system, shared purely for educational purposes.
📌 If you're also interested in systematic and data-driven trading strategies:
💡 Don’t forget to follow the page and subscribe to stay updated on future analyses.

USD/CAD - Wedge Breakout (06.05.2025)The USD/CAD pair on the M30 timeframe presents a Potential Buying Opportunity due to a recent Formation of a Wedge Breakout Pattern. This suggests a shift in momentum towards the upside and a higher likelihood of further advances in the coming hours.
Possible Long Trade:
Entry: Consider Entering A Long Position around Trendline Of The Pattern.
Target Levels:
1st Resistance – 1.3893
2nd Resistance – 1.3928
🎁 Please hit the like button and
🎁 Leave a comment to support for My Post !
Your likes and comments are incredibly motivating and will encourage me to share more analysis with you.
Best Regards, KABHI_TA_TRADING
Thank you.

Bullish Breakout for Gold???Waiting to see what they want to do. Price was bullish all day yesterday and Im trying to see if they want to give a pullback before continuing with the action. I know its best to just wait for the killzone to get the best entry.

GOLD H1 / 3285 USD & 3155 USD key BUY/SELL Levels🏆 Gold Market Mid-Term Update
📊 Technical Outlook Update
🏆 Market Overview
▪️correction in progress
▪️3285 USD overhead resistance
▪️Multiple waves of selling in progress
▪️Rejection at 3500 USD key S/R
▪️3155 USD logical next target short-term
▪️flagging on lower timeframe
▪️waves of profit taking pulling prices down
▪️3285 USD a good level to SHORT
▪️3145/3155 USD will be targeted by BEARS
▪️BULLS wait to BUY/HOLD low later
▪️Once the pullback/correction is over
📊 Gold Market Summary – May 5, 2025
🟡 Current Price: $3,266.20 (+0.82%)
📉 Weekly Close: $3,247.40 (flat for the week after sharp swings)
🇺🇸 US Jobs Data: 177K jobs added in April, earnings growth slowed to 0.2%. Market now watching Fed for rate cut signals.
🏦Fed Outlook: Mixed data fuels speculation on policy shift. Analysts see gold’s pullback as a new buying opportunity.
🌏Asian Demand: China and India remain key forces in price direction, alternating as major buyers.
📦Tariff Watch: Ongoing U.S.-China trade tension continues to weigh on risk sentiment, keeping gold in play.
🛑Geopolitics: No major updates on Iran-U.S. talks, India-Pakistan, or Russia-Ukraine ceasefire yet. These remain key risk triggers.
📈 Market Sentiment: Despite volatility, investor outlook stays bullish. Analysts eye mid-term targets above $4,000 if conditions align.

GOLD - WAVE 4 CORRECTION TO $2,800 (UPDATE)Gold starting the week with some bullish momentum. We've seen a 'BOS' to the downside, which is now being followed by a retest of a supply zone. This zone can either be around $3,317 (0.618% Fib) or higher around $3,400 zone (0.365% Fib).
Don't forget we're in a 'Wave 4 Correction' of the Elliott Wave Theory strategy. Wave 4 always has choppy price action to trap in late buyers & early sellers.

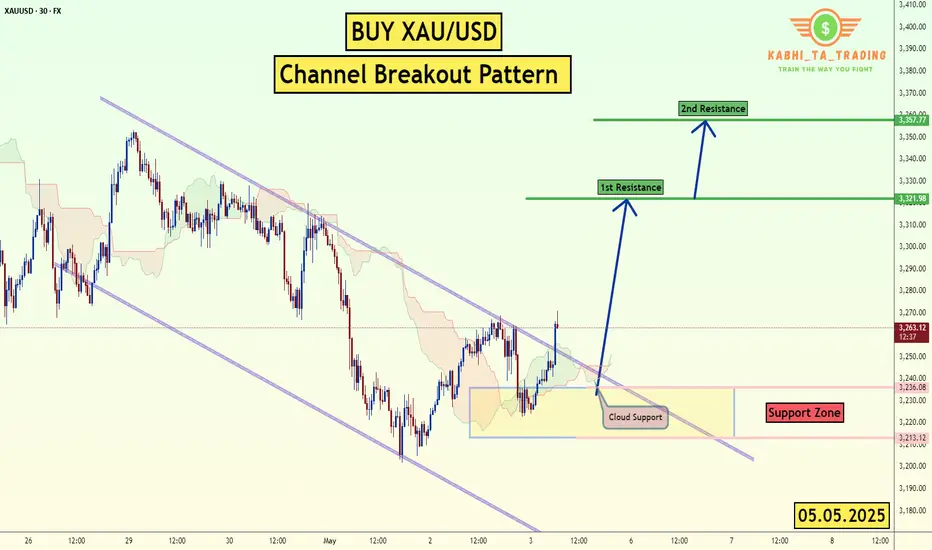
XAU/USD - Channel Breakout (05.05.2025)The XAU/USD pair on the M30 timeframe presents a Potential Buying Opportunity due to a recent Formation of a Channel Breakout Pattern. This suggests a shift in momentum towards the upside and a higher likelihood of further advances in the coming hours.
Possible Long Trade:
Entry: Consider Entering A Long Position around Trendline Of The Pattern.
Target Levels:
1st Resistance – 3321
2nd Resistance – 3357
🎁 Please hit the like button and
🎁 Leave a comment to support for My Post !
Your likes and comments are incredibly motivating and will encourage me to share more analysis with you.
Best Regards, KABHI_TA_TRADING
Thank you.
XAUUSD - Gold Trend Before FOMC!Gold is trading above its EMA200 and EMA50 on the 4-hour timeframe and is trading on its uptrend line. A continued upward move in gold will put it in the supply zone, where it is possible to look for short positions. A downward correction in gold will also open up long positions.
Gold traders endured another turbulent week, marked by the second consecutive decline in prices—once again underscoring the market’s acute sensitivity to economic news and developments.
Adrian Day, CEO of Adrian Day Asset Management, offered a cautiously humorous take on the situation by likening it to the Peggy Lee song that asks, “Is that all there is?” He pointed out that gold has pulled back by over 7% from its recent high in less than two weeks.Although this correction is notable, it hasn’t been deep enough to flush out all short-term traders or weak-handed investors from the market.
Day added that rising fears of a U.S. recession—which typically exert early downward pressure on gold—alongside the possibility of easing U.S.-China trade tensions, may limit investment demand for gold in the short term. Concluding his comments, he maintained a cautious stance, saying that further downside remains likely and that his outlook for the coming week is bearish.
Meanwhile, U.S. President Donald Trump, in a new interview with NBC, addressed several key economic and political issues. He stated that if necessary, the deadline for selling TikTok would be extended, and some tariffs on Chinese goods might become permanent. Nevertheless, he indicated that he is also considering reducing certain tariffs in the future.
Trump emphasized that small businesses do not require additional assistance and that the Federal Reserve should cut interest rates. He confirmed that Jerome Powell will remain Fed Chair through the end of his term in 2026. He also mentioned potential successors for his own position, naming Vance and Rubio as possibilities.
After a week dominated by employment data, the upcoming week will be entirely focused on monetary policy. The centerpiece will be the May FOMC meeting, the Fed’s rate decision, and Jerome Powell’s press conference on Wednesday. While markets broadly expect the Fed to hold rates steady, Powell’s official remarks and answers to press questions—especially following his sharp tone earlier in April—will be under close scrutiny.
It is widely expected that the Federal Reserve will leave its key interest rate unchanged on Wednesday, as policymakers assess how President Trump’s tariffs gradually impact various sectors of the economy. Markets are currently pricing in a potential rate cut starting in July. The Fed’s dual mandate is to maintain low inflation and high employment, and it may face a dilemma if tariffs negatively affect both indicators, as many economists now warn.
Immediately following the Fed meeting, senior policymakers including Barr, Kugler, Waller, and Cook will travel to Iceland to attend the Reykjavik Economic Conference. On Friday, they will participate in panels discussing artificial intelligence, labor market trends, and monetary research—topics that could offer insights into the Fed’s long-term policy direction.
Simultaneously, traders are also awaiting two key reports: the ISM Services Index for May, due today, and weekly jobless claims figures set for release on Thursday. Together, these reports will help complete the picture of the U.S. economy as critical monetary policy decisions approach.

GBPUSD The second trade of the day comes from the GBPUSD pair.
Even though I'm not a big fan of this pair, I believe it's worth taking advantage of the signal.
However, for this pair, I recommend slightly reducing your lot size and overall risk.
🔍 Criteria:
✔️ Timeframe: 15M
✔️ Risk-to-Reward Ratio: 1:3
✔️ Trade Direction: Buy
✔️ Entry Price: 1.32793
✔️ Take Profit: 1.33054
✔️ Stop Loss: 1.32706
🔔 Disclaimer: This is not financial advice. It's a trade I’m taking based on my own system, shared purely for educational purposes.
📌 If you're also interested in systematic and data-driven trading strategies:
💡 Don’t forget to follow the page and subscribe to stay updated on future analyses.

Oil on high time frame
"Regarding WTI oil, the price trend on high time frames is bearish, especially on the daily chart. After completing its pullback on the 4-hour chart, there are indications of further downside potential.
The market's volatility may be influenced by geopolitical tensions and political factors between Iran and the USA, as well as tariff issues. Despite these fluctuations, candle formations suggest the potential for prices to drop towards the $58 zone."
If you require more assistance or have any specific questions, feel free to ask!

Whats the direction for the Week? We should wait to see...Looking for price to go Bullish...But i need to allow Monday to play out first to give us a solid direction. They could go bullish early or they could pull back to give a lower entry first.

Bearish reversal?US Dollar Index (DXY) is rising towards the pivot and could reverse to the 1st support.
Pivot: 100.51
1st Support: 97.85
1st Resistance: 101.83
Risk Warning:
Trading Forex and CFDs carries a high level of risk to your capital and you should only trade with money you can afford to lose. Trading Forex and CFDs may not be suitable for all investors, so please ensure that you fully understand the risks involved and seek independent advice if necessary.
Disclaimer:
The above opinions given constitute general market commentary, and do not constitute the opinion or advice of IC Markets or any form of personal or investment advice.
Any opinions, news, research, analyses, prices, other information, or links to third-party sites contained on this website are provided on an "as-is" basis, are intended only to be informative, is not an advice nor a recommendation, nor research, or a record of our trading prices, or an offer of, or solicitation for a transaction in any financial instrument and thus should not be treated as such. The information provided does not involve any specific investment objectives, financial situation and needs of any specific person who may receive it. Please be aware, that past performance is not a reliable indicator of future performance and/or results. Past Performance or Forward-looking scenarios based upon the reasonable beliefs of the third-party provider are not a guarantee of future performance. Actual results may differ materially from those anticipated in forward-looking or past performance statements. IC Markets makes no representation or warranty and assumes no liability as to the accuracy or completeness of the information provided, nor any loss arising from any investment based on a recommendation, forecast or any information supplied by any third-party.

EURUSD Bulls Reloading — Big Week Ahead? FOMCEURUSD has been riding the uptrend for a while now, but we’ve finally hit a bit of a pause. Recently, the pair posted one of its biggest up-days since 2009 — a huge bullish signal — and momentum carried it even higher! 🔥
Now, price has pulled back slightly from the highs, with last week showing a modest dip as the dollar regained some strength. I do expect we could see a little more pullback in the short term… but overall, my bias remains bullish. I believe the uptrend is still intact, and we could see EURUSD push higher again this week! 📈
What’s your view? Are you buying the dip or expecting a deeper correction?
Drop your thoughts below — and if you found this analysis useful, a boost or follow is always appreciated! 🙌

GOLD - Is this the end of the Bull Run?Gold has once again followed my previous analysis — turning bearish right at key levels! 🚩 After an incredible bull run where price kept making new highs, signs are now pointing to a possible top. We could be entering a short-term bearish phase here, with potential for a deeper correction if momentum builds.
Right now, I’m holding a bearish bias. I’ll be watching for solid sell setups, especially around those well-defined resistance zones. There’s also an unfilled gap below that could attract price action — keep an eye on that level (chart shows the zone clearly 🔎).
I’ll be looking for confirmation through structure breaks and clean retests before entering shorts.
What’s your take — are we seeing a reversal brewing, or is this just a dip before the next leg up? Drop your thoughts below!
If this analysis helps, a boost or follow would mean a lot — and keeps you in the loop for the next moves! 🚀

Natural Gas | Oil | Dollar | Silver | Gold Price ForecastPrice action, multi time frame, trend analysis on
NYMEX:NG1! PEPPERSTONE:NATGAS AMEX:UNG | Oil | Dollar | Silver | Gold Price Forecast

DXY Will Go Up! Buy!
Here is our detailed technical review for DXY.
Time Frame: 5h
Current Trend: Bullish
Sentiment: Oversold (based on 7-period RSI)
Forecast: Bullish
The market is approaching a significant support area 100.036.
The underlined horizontal cluster clearly indicates a highly probable bullish movement with target 100.899 level.
P.S
The term oversold refers to a condition where an asset has traded lower in price and has the potential for a price bounce.
Overbought refers to market scenarios where the instrument is traded considerably higher than its fair value. Overvaluation is caused by market sentiments when there is positive news.
Disclosure: I am part of Trade Nation's Influencer program and receive a monthly fee for using their TradingView charts in my analysis.
Like and subscribe and comment my ideas if you enjoy them!

DXY (US Dollar Index) – Bullish Setup📊 DXY (US Dollar Index) – Bullish Setup from FVG & Trendline Confluence
Price tapped into a well-defined Fair Value Gap (FVG UP) aligning with bullish trendline support. I'm anticipating a small retracement toward the 99.88–99.81 area before continuation upward.
📍 Entry Zone: 99.88 – 99.81 (FVG + Trendline)
🛑 Stop Loss: 99.71
🎯 Target (TP): 100.32
📐 RR: Approx. 1:3
Confluences:
Bullish market structure
FVG filled & respected
Ascending trendline support
Liquidity taken below previous lows
🔔 Watching for bullish reaction after the minor pullback for confirmation.

US INDEX (DXY) TIME TO BUY !!!HELLO TRADERS
As i can see this chart created a harmonic pattren and it crystal clear showing the levels till it hold above our design Stop Loss Trade War Talks and NFP results with slowing down the inflation shows us that $ will recover from this zone if not break SL make a proper research befor taking any trade we appriciate your cooments and support us Stay Tuned for more updates ...
