DXY Forecast: More Bearish OrderflowThis week, I anticipate further downside movement on the DXY, with price potentially reaching a key area of interest—a bullish order block. While the reaction at this level remains uncertain, my current bias remains bearish unless a break of structure to the upside signals a continuation of the bullish trend.
DXY

USDJPY Bearish Forecast, More Bearish Order FlowAfter the recent change of character from Monday, UJ continued lower and broke the H1 structure. As we all know, whenever you get a break of structure, expect a pullback. On the H4 there is a nice bearish OB which serves as a nice point of interest for price to rally back towards, be mindful this OB is big so we don't know what to expect once price reaches it.
For now this is how I see the dollar heading towards.

USDCHF: More Bearish Order FlowSimilar to USDJPY , USDCHF has exhibited a change of character, initiating a bearish order flow for the week. Price has reached a key point of interest where a potential continuation to the downside could occur. The DXY is reflecting similar behaviour, supporting the bearish outlook.
An entry position has been established, and now it is a matter of monitoring the trade and allowing the market to develop accordingly.

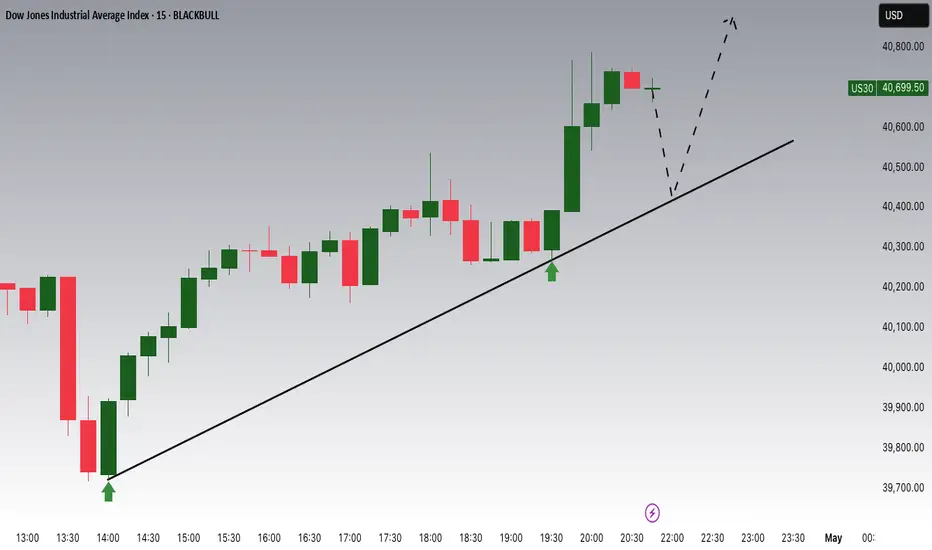
Dow Jones Potential UpsidesHey Traders, in today's trading session we are monitoring US30 for a buying opportunity around 40400 zone, Dow Jones is trading in an uptrend and currently is in a correction phase in which it is approaching the trend at 40400 support and resistance area.
Trade safe, Joe.
EURUSD m15 SellEURUSD is once again giving a sell signal. It's advisable to set the trade with a 1:1.50 Risk-Reward Ratio. You may consider closing your position at this level.
🔔 I post detailed trade ideas and daily market analysis like this every day on my TradingView profile.
👉 Follow me to get notified and read the full breakdowns.

IMP update for all Forex Traders Expect the Dollar Index (DXY) to appreciate in the near future. However, a further decline into the green highlighted region is possible before this upward movement. The green zone represents a potential key reversal area. Monitor the following currency pairs for trading opportunities if the DXY begins to climb:
BUY - USDCAD, USDCHF, USDSGD;
SELL - EURUSD, GBPUSD

AUDCHF m15 SellLet the final trade of the day come from AUDCHF.
I expect the pair to decline first to 0.52545 and then towards 0.52419 / SL 0,52861.
Adjust your risk accordingly and activate the trade.
Wishing everyone a profitable day!
📊 Don’t forget — I share these trade ideas daily on my TradingView profile. Follow me there for full analysis and daily setups.
🔔 I post detailed trade ideas and daily market analysis like this every day on my TradingView profile.
👉 Follow me to get notified and read the full breakdowns.

EURAUD H2 compression BUY/HOLD +150/300 pips🏆 EURAUD Market Update
📊 Technical Outlook
🔸Short-term: BEARS 7650/7700
🔸Mid-term: BULLS 8050/8150
🔸Status: compression wedge
🔸getting ready for a PUMP
🔸noteworthy compression in April
🔸Price Target Bears: 7650/7700
🔸Price Target BULLS: 8050/8150
📊 Forex & Gold Market Highlights – April 30, 2025
💶 EUR/USD Nears 1.1400
- Trading around 1.1390 amid softer U.S. economic data
- Investors await German economic indicators and U.S. PCE report
- April shows a 5.1% gain, the largest monthly increase since November 2022
💷 GBP/USD Hovers Near 1.3400
- Sterling trades at approximately 1.3379 after testing YTD highs
- U.S. JOLTS and Consumer Confidence data missed forecasts, fueling Fed rate cut speculation
🥇 Gold Retreats Below $3,310
- Spot gold at $3,302.58 per ounce, down 0.4%
- Decline follows easing trade tensions and a stronger U.S. dollar
- Investors focus on upcoming U.S. PCE data and non-farm payrolls report
📌 Market Outlook:
- EUR/USD: Potential to test 1.15 if German data supports euro strength
- GBP/USD: Eyes on U.S. economic data for direction; support around 1.3300
- Gold: Volatility expected; watch for U.S. economic indicators influencing Fed policy expectations

Chart Overview (EUR/USD — 4H)Pair: EUR/USD
Timeframe: 4 Hour
Current Price: 1.13596
Key Concept Highlighted:
“This is where money is made — in the retrace, not the rally.”
(Focus is on catching retracements, not chasing rallies)
---
Technical Breakdown
1. Wave Count (Elliott Wave context assumed)
The chart labels wave iii as complete.
A corrective move is underway (likely forming wave iv).
The next anticipated move is wave v rally to the upside — target zone shown near 1.22000–1.20000.
2. Key Zones
Immediate Support/Buy Zone: Small rectangle near the current price (likely minor demand zone).
Major Buy Zone: 1.10500–1.11500 (approximate)
→ Strong demand area backed by confluence of:
Previous wave structure support
Trendline retest
Cluster of economic event icons (suggesting high volatility catalysts)
3. Bias
Waiting for price to either:
Bounce from the immediate small support (early aggressive long), or
Dip deeper into the major buy zone for safer long entries.
---

EURUSD m15 SellThere’s another Sell opportunity on EURUSD.
I've set the RRR to 1:1.50, with a TP level at 1.13694.
I opened three short positions at: 1.13795 / 1.13802 / 1.13834.
EURUSD is one of the four pairs I trade the most and trust the most.
🔔 If you want to catch setups like this daily, make sure to follow me.Hello everyone. There's a
🔔 I post detailed trade ideas and daily market analysis like this every day on my TradingView profile.

NZDCHF m15 BuyHello everyone.
There's a perfect buy opportunity on NZDCHF right now.
You can even set your RRR to 1:4, but those who prefer a shorter target can close at RRR 1:2.
I expect the pair to reach the 0.49225 level during the day.
Wishing everyone profitable trades!
🔔 I post detailed trade ideas and daily market analysis like this every day on my TradingView profile.
👉 Follow me to get notified and read the full breakdowns.

30.04.25 Morning ForecastPairs on Watch -
GBP / AUD
AUD / JPY
GBP / JPY
EUR / USD
A short overview of the instruments I am looking at for today, multi-timeframe analysis down to what I will be looking at for an entry. Enjoy!

DXY Technical Analysis – Bearish BiasDXY Technical Analysis – Bearish Bias
Market Structure: The price attempted a recovery but failed to break above a strong supply/resistance zone around 99.30–99.40.
Price Action: A rounded bottom (U-shape) move formed, but instead of continuation, the price rejected the resistance and started to fall.

SHORT ON GBP/USDGBP/USD Has bearish divergence on the 4hr timeframe.
This is a bearish reversal indication. Price is also over brought on GU.
The Dollar (dxy) Looks like it will start to rise from its demand area.
I will be selling GU looking to catch over 300-400 pips to the previous swing low /demand zone.

DXY: Will Go Up! Long!
My dear friends,
Today we will analyse DXY together☺️
The market is at an inflection zone and price has now reached an area around 98.933 where previous reversals or breakouts have occurred.And a price reaction that we are seeing on multiple timeframes here could signal the next move up so we can enter on confirmation, and target the next key level of 99.097.Stop-loss is recommended beyond the inflection zone.
❤️Sending you lots of Love and Hugs❤️

DXY Will Go Higher! Buy!
Please, check our technical outlook for DXY.
Time Frame: 9h
Current Trend: Bullish
Sentiment: Oversold (based on 7-period RSI)
Forecast: Bullish
The market is approaching a key horizontal level 99.288.
Considering the today's price action, probabilities will be high to see a movement to 100.788.
P.S
We determine oversold/overbought condition with RSI indicator.
When it drops below 30 - the market is considered to be oversold.
When it bounces above 70 - the market is considered to be overbought.
Disclosure: I am part of Trade Nation's Influencer program and receive a monthly fee for using their TradingView charts in my analysis.
Like and subscribe and comment my ideas if you enjoy them!

Gold (XAUUSD) Take Profit📉 Gold (XAUUSD) Trade Update
A few hours ago, I shared a short setup on gold — it has successfully hit the target and closed with a solid profit.
Looking ahead, there's still room for further downside. In the medium term, gold could decline towards the $3020 level.
🔔 I post detailed trade ideas and daily market analysis like this every day on my TradingView profile.
👉 Follow me to get notified and read the full breakdowns.

Is EURUSD getting ready for another 600 pips bull run?🏆 EURUSD Market Update
📊 Technical Outlook
🔸Short-term: mixed/range
🔸Mid-term: BULLS 2000
🔸Status: accumulation in range
🔸previously x2 waves +600 pips
🔸clearly strong uptrend in progress
🔸Price Target Bears: range
🔸Price Target BULLS: 2000
🔸strategy: accumulate in range
🔸TP1 +200 TP2 +400 pips
🔸SL 60 pips / below accum range
📈 EUR/USD Bullish Drivers
🏦 ECB staying cautious on rate cuts while Fed signals easing
📉 Weak U.S. job and manufacturing data pressuring the dollar
🌍 U.S. trade policy uncertainty pushing investors toward euro
📊 Technicals show strong support, RSI confirms bullish momentum
🔮 Outlook
⏳ Short-term: Targeting 1.1500 if U.S. data stays soft
📆 Medium-term: 1.20 possible on policy divergence and EU fiscal boost

The Monthly Transition for GoldLooking for price to retrace and take out lows before it proceeds to be bullish. Waiting for Killzones.

USD/JPY 1H Chart AnalysisStructure: Bullish, with higher highs (H1) and higher lows consistently forming.
Key Zone: A demand zone around 143.00 – 143.20. Price could pull back here for liquidity before continuing higher.
Current Price: Consolidating near 143.70 after a strong impulse.
Bias: Bullish, as long as price holds above 143.00. Watching for a possible dip into demand before resuming the uptrend toward 144.20 highs.

USDCHF | 15M | Needs to break for uptrendHey there my friend;
I’ve prepared my analysis of USD/CHF for you. For USD/CHF to move into an upward trend, it needs to break out of the parallel channel. Once it breaks out of the parallel channel, I’ll share the target levels with you.
Dear friends, your likes are always my biggest source of motivation for me to share analysis. For this reason, I would like to ask each and every one of my followers; please do not miss your likes.
I sincerely thank everyone who supports me with their likes.

GBPNZD | 4H | SWING TRADEHey there my dear friends;
SIGNAL ALERT
BUY GBPNZD / 2,23220
🟢TP1: 2,23952
🟢TP2: 2,24909
🟢TP3: 2,27946
🔴SL: 2,20905
Enter low lot because it is high risk 🔽
RR / 2,00
Dear friends, your likes are always my biggest source of motivation for me to share analysis. For this reason, I would like to ask each and every one of my followers; please do not miss your likes.
I sincerely thank everyone who supports me with their likes.

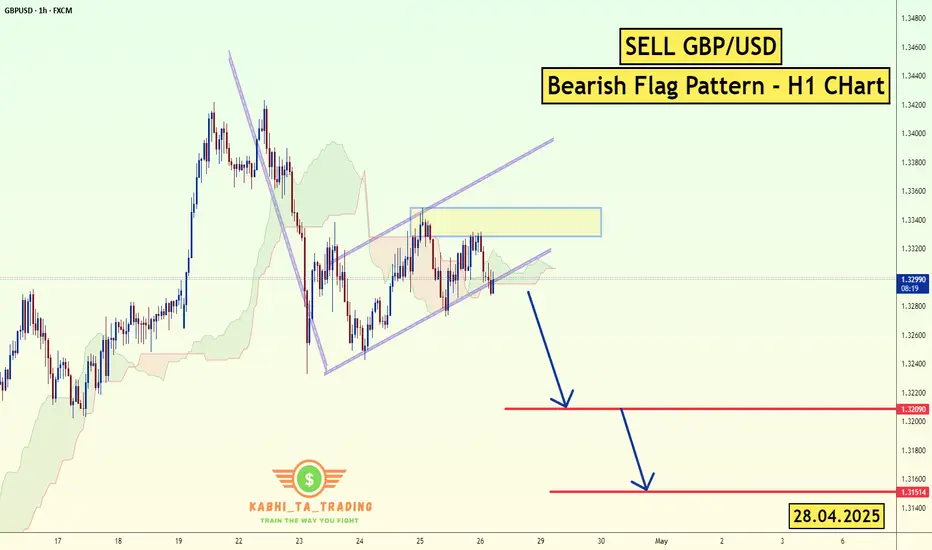
GBP/USD - H1 - Bearish Flag (28.04.2025)FX:GBPUSD The GBP/USD Pair on the H1 timeframe presents a Potential Selling Opportunity due to a recent Formation of a Bearish Flag Pattern. This suggests a shift in momentum towards the downside in the coming hours.
Possible Short Trade:
Entry: Consider Entering A Short Position around Trendline Of The Pattern.
Target Levels:
1st Support – 1.3209
2nd Support – 1.3151
🎁 Please hit the like button and
🎁 Leave a comment to support for My Post !
Your likes and comments are incredibly motivating and will encourage me to share more analysis with you.
Best Regards, KABHI_TA_TRADING
Thank you.
Fundamental Update :
on Monday as the trade tensions between the U.S. and China provided some relief to investors, while a stronger dollar further weighed on prices.
The U.S. dollar TVC:DXY rose 0.2% against a basket of currencies, making bullion more expensive for overseas buyers. TVC:DJI SP:SPX NASDAQ:IXIC also rising .