NAS100 - Stock Market Waiting for a New Stimulus?!The index is trading above the EMA200 and EMA50 on the four-hour timeframe and is trading in its ascending channel. If the index continues to move upwards towards the specified supply zone, one can look for further Nasdaq short positions with a risk-reward ratio.
Last week, financial markets experienced a brief sigh of relief as U.S. President Donald Trump appeared to ease tensions by signaling a limited retreat in the tariff war with China, sparking hopes for reduced friction. However, this optimism quickly faded once it became clear that Trump’s retreat was neither substantial nor impactful.
From Beijing’s perspective, the trade war has transcended economic concerns, becoming an issue of national pride and sovereignty. As a result, China, the world’s second-largest economy, is not retreating as easily as Trump anticipated. This stance has evolved into a significant challenge for the White House. U.S. officials indicated that tariffs of 145% could be reduced within two to three weeks if an agreement is reached.
Nonetheless, according to Chinese authorities, negotiations have yet to even begin, raising doubts about Trump’s negotiation tactics. Additionally, other concessions, such as reducing tariffs on American automakers, remain uncertain, and Trump has even threatened to raise tariffs on Canadian car imports.
This environment not only fails to clarify U.S. trade policy but also deepens uncertainty for domestic businesses. Although the White House claims it is monitoring markets closely and Trump is eager to strike deals with key partners, these assurances have not alleviated concerns about the future of the U.S. economy.
In the upcoming week, critical economic data could either intensify or ease current worries. On Tuesday, the Consumer Confidence Index for April and the JOLTS job openings data for March will be released. The highlight, however, will be the preliminary estimate of GDP growth, scheduled for Wednesday.
The Atlanta Fed’s GDPNow model forecasts a 2.2% annualized contraction in the U.S. economy for Q1 2025. Meanwhile, a Reuters survey of economists projects a modest 0.4% growth rate, a significant slowdown from Q4’s 2.4% growth.
Accompanying these reports, the ADP private-sector employment data and the Personal Consumption Expenditures (PCE) index will be published. The core PCE for March is expected to show a monthly increase of 0.1% and an annual rise of 2.5%, down from 2.8% previously. Personal spending is anticipated to maintain its 0.4% monthly growth, reflecting resilient household expenditures.
Additionally, on Wednesday, the Chicago PMI and pending home sales figures will be released. Thursday will bring the Challenger layoffs data for April, but market focus will be on the ISM manufacturing PMI, expected to drop from 49 to 47.9.
The week’s main event will be Friday’s release of the Nonfarm Payrolls (NFP) report. Forecasts suggest job growth will slow from 228,000 in March to 130,000 in April, while the unemployment rate is expected to remain at 4.2%. Wages are projected to rise by 0.3%.If NFP and PCE data come in weaker than expected, market expectations for a 25-basis-point rate cut by the Fed in June could intensify, although the likelihood of a cut in May will remain low. Such data would likely be bearish for the U.S. dollar but could support equity markets if recession fears do not dominate sentiment.
Some Federal Reserve officials have suggested that if economic conditions deteriorate significantly, rate cuts could start as early as June. Currently, the Fed has maintained high rates to combat inflation but may lower them to support growth and prevent a sharp rise in unemployment if necessary.
Trump’s trade wars pose a dual risk of increasing inflation while hurting employment, complicating the Fed’s monetary policy strategy. Presently, the Fed is in a “wait-and-see” mode, but several officials indicated last week that cuts could begin if economic data worsens.
Beth Hammack, President of the Cleveland Federal Reserve Bank, told CNBC on Thursday that the Fed might lower rates starting in June if signs of economic weakening due to Trump’s sporadic tariffs appear.
Christopher Waller, a Fed Board member, stated on Bloomberg TV that he could foresee rate cuts if the labor market collapses but does not expect such a scenario before July.
On Thursday, Waller remarked, “It would not be surprising to see an increase in layoffs and a higher unemployment rate, especially if major tariffs return. I would expect faster rate cuts once signs of severe labor market deterioration emerge.”
These comments highlight the Fed’s current dilemma as it awaits clearer evidence of significant economic fallout from Trump’s trade wars.
The Federal Reserve’s mandate is to maintain low inflation and unemployment levels. Its primary tool, the federal funds rate, influences borrowing costs across the economy. The Fed can stimulate growth by lowering rates or curb inflation by raising them.
Economists warn that Trump’s tariffs present the risk of simultaneously driving up inflation while damaging employment, forcing the Fed to prioritize which challenge to address first.
DXY

Bitcoin: Will Bitcoin reach $100,000?!Bitcoin is above the EMA50 and EMA200 on the four-hour timeframe and is in its ascending channel. The continuation of Bitcoin's upward movement towards the supply zone will provide us with its next selling position with an appropriate reward to risk. In case of Bitcoin's downward movement towards the specified demand zone, we can look for its next buying positions.
It should be noted that there is a possibility of heavy fluctuations and shadows due to the movement of whales in the market and compliance with capital management in the cryptocurrency market will be more important. If the downward trend continues, we can buy in the demand range.
During the recent trading week, from April 21 to April 25, U.S. spot Bitcoin ETFs recorded over $3 billion in capital inflows. This figure marks the second-largest weekly inflow in the history of these ETFs, following the $3.4 billion inflow recorded in November 2024.
Thanks to this momentum, Bitcoin managed to climb above the $95,000 mark for the first time since February. Data reveals a notable increase in market participants’ optimism, with bullish posts on social media reaching their highest level since the night of Trump’s election victory on November 5, 2024.
More than 7,000 Bitcoins, worth over $500 million, were withdrawn from the Coinbase exchange. This trend could signal institutional accumulation and reflect a strongly bullish sentiment in the market.
During the 2018 trade tariff war, Bitcoin experienced a sharp 84.5% collapse, plunging from around $19,400 in December 2017 to approximately $3,000 by December 2018. This price decline coincided with intensifying global trade tensions.
However, Bitcoin’s price later rebounded following the Federal Reserve’s interest rate cuts and an improvement in liquidity conditions. The attached price chart clearly illustrates Bitcoin’s steep decline between December 2017 and December 2018.
According to data released in March 2025, major global corporations have significantly strengthened their presence in the digital asset market. At the top of the list stands MicroStrategy, holding over 500,000 BTC — far surpassing other companies.
Following MicroStrategy, companies such as Marathon, Galaxy Digital, Tesla, Coinbase Global, Hut 8 Mining, Riot Platforms, Block, CleanSpark, and Metaplanet respectively hold the largest Bitcoin reserves. This group of key players from technology, mining, and financial services sectors view Bitcoin as a critical part of their long-term strategies.Moreover, between April 7 and April 13, MicroStrategy purchased 3,459 Bitcoins at an average price of $82,618 per coin, totaling $285.8 million.

Heading into pullback resistance?US Dollar Index (DXY) is rising towards the pivot which is a pullback resistance and could reverse to the 1st support which acts as a pullback support.
Pivot: 100.27
1st Support: 98.32
1st Resistance: 101.77
Risk Warning:
Trading Forex and CFDs carries a high level of risk to your capital and you should only trade with money you can afford to lose. Trading Forex and CFDs may not be suitable for all investors, so please ensure that you fully understand the risks involved and seek independent advice if necessary.
Disclaimer:
The above opinions given constitute general market commentary, and do not constitute the opinion or advice of IC Markets or any form of personal or investment advice.
Any opinions, news, research, analyses, prices, other information, or links to third-party sites contained on this website are provided on an "as-is" basis, are intended only to be informative, is not an advice nor a recommendation, nor research, or a record of our trading prices, or an offer of, or solicitation for a transaction in any financial instrument and thus should not be treated as such. The information provided does not involve any specific investment objectives, financial situation and needs of any specific person who may receive it. Please be aware, that past performance is not a reliable indicator of future performance and/or results. Past Performance or Forward-looking scenarios based upon the reasonable beliefs of the third-party provider are not a guarantee of future performance. Actual results may differ materially from those anticipated in forward-looking or past performance statements. IC Markets makes no representation or warranty and assumes no liability as to the accuracy or completeness of the information provided, nor any loss arising from any investment based on a recommendation, forecast or any information supplied by any third-party.

GOLD / XAUUSD | 15M | PENDING SELL ORDERHey there my dear friends;
SIGNAL ALERT
PENDING SELL ORDER - GOLD / XAUUSD > 3334,0
🟢TP1: 3328,0
🟢TP2: 3314,0
🟢TP3: 3296,0
🔴SL:3358,0
RR / 1,70
Dear friends, your likes are always my biggest source of motivation for me to share analysis. For this reason, I would like to ask each and every one of my followers; please do not miss your likes.
I sincerely thank everyone who supports me with their likes.

Price Action + Fundamentals Point to Dollar StrengthThe current market environment presents compelling evidence for a bullish move in the US Dollar Index (DXY). While some patience is required, the setup is increasingly favorable for the dollar to appreciate in the coming weeks and months.
Key Factors Supporting a Bullish Move:
Monthly Close Above 100.160:
A critical technical level to monitor is the monthly close above 100.160. If achieved, it would signal a strong bullish breakout, setting the stage for a continuation higher. Given current price action and market dynamics, this scenario looks highly probable. However, if the price fails to close above 100.160 and instead breaks below it, we could potentially start looking for short opportunities.
Bond Market Strength (30Y, 10Y, 5Y):
This past week, we witnessed notable strength across the US bond market. Yields declined as prices rose, typically a positive signal for the dollar as it reflects capital inflows into US assets.
COT Report Insights:
The Commitment of Traders (COT) report reveals a critical shift: commercial traders, often considered the "smart money," are beginning to accumulate long positions in the dollar. This change in positioning historically precedes significant bullish moves.
Seasonal Patterns:
Seasonality also favors the dollar during this period. Historically, the dollar tends to strengthen in the mid-year months, aligning perfectly with the current technical and fundamental landscape.
Targets:
Initial Target: 106.120
Given the accumulation signs and supportive macro backdrop, a move towards 106.120 seems very realistic.

DXY Printing a Bullish Triangle??The DXY on the 1 Hr Chart is forming a potential continuation pattern, the Bullish Triangle!
Currently Price is testing the 99.6 - 99.8 Resistance Area and battling with the 200 EMA and 34 EMA Band. The reaction to this conjunction could be pivotal in who overcomes: Buyers or Sellers.
Now during the formation of the potential pattern, Price on the RSI has stayed relatively Above the 50 mark being Bullish Territory suggesting Buyers could win the Bull-Bear battle.
Until Price breaks either the Resistance Area or the Rising Support, we will not have a definitive direction in which USD will strengthen or weaken.
*Wait For The Break*
-If Price breaks the Resistance Area, USD will strength possibly heading to the 100.8 - 101 Area
-If Price breaks the Rising Support, USD will weaken possibly heading to the 98.5 - 98.3 Area
Fundamentally, it is said China and USA are possibly getting closer to potentially ending the Reciprocal Tariff War going on with both sides willing to negotiate.
With the USA being the #1 Consumer of Goods globally, other economies can not afford us to not buy their things so I continue to see the Tariff War more as a Strong-Arm for the USA to be able to negotiate better terms!
USD News:
JOLTS - Tuesday, Apr. 29th
GDP - Wednesday, Apr. 30th
Unemployment Claims / ISM Manu. PMI - Thursday, May 1st
Non-Farm Employment Change / Avg Hourly Earnings / Unemployment Rate - Friday, May 2nd
For all things Currency,
Keep it Current,
With Novi_Fibonacci

EURUSDHello Traders! 👋
What are your thoughts on EURUSD?
EURUSD has pulled back after reaching the top of the ascending channel and encountering a resistance zone.
We expect the correction to continue at least toward the identified support level.
After completing the correction, a new bullish wave is expected to begin, potentially pushing the price toward higher levels.
Will EURUSD resume its uptrend after the pullback? Share your thoughts below!
Don’t forget to like and share your thoughts in the comments! ❤️

"GBP/USD Wave 5 Completion | ABC Correction in ProgressFive-wave impulsive structure is complete.
Price rejected strongly in the red supply zone.
Correction phase (ABC) now unfolding.
Key Levels:
Wave A Support Zone: 1.3285
Wave C Target Zone: 1.2880
Expect a corrective pullback before potential bullish continuation.
Stay patient — corrections offer new opportunities!
#GBPUSD #ElliottWave #ForexAnalysis #TechnicalAnalysis

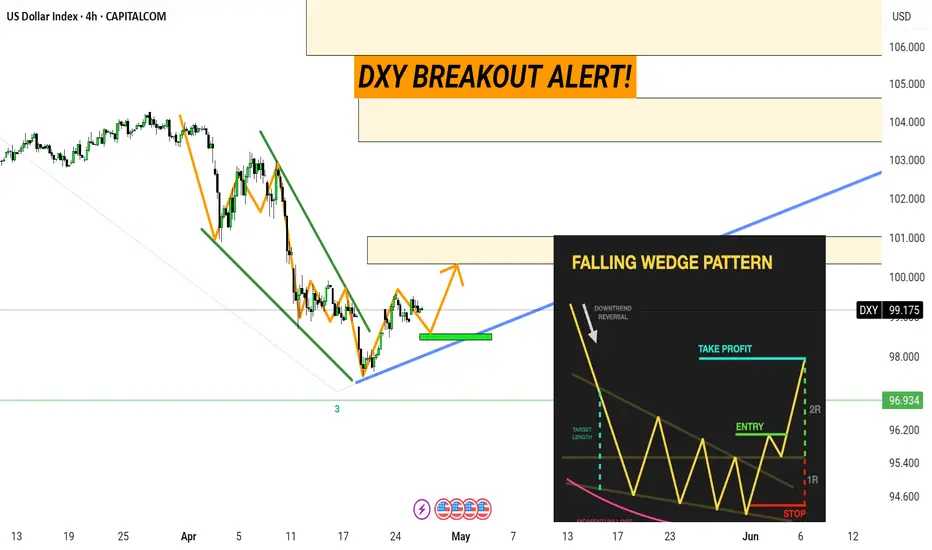
DXY BREAKOUT IN PLAY — Smart Money is Moving!After a clean falling wedge formation, DXY is showing early signs of bullish momentum.
Price action respects the trendline support + bullish orderblock (green zone) beautifully!
Next targets: 101.000 — 103.000 zone.
Watch for pullback entries before continuation.
This is textbook falling wedge breakout behavior — stay sharp!
Levels Marked:
Support: 99.00 zone
Target Zones: 101.000 & 103.000
Breaker structure: Confirmed bullish
Save this setup & be prepared!
Forex Grid Trading Overview: Practical Guide for 2025Forex Grid Trading Strategy: Detailed Overview & Low-Risk EUR/USD Application
1️⃣ What Is Grid Trading?
A grid trading strategy places a series of **buy** and **sell** orders at fixed intervals (“grid levels”) above and below a base price, without forecasting market direction. As price oscillates, it triggers orders across the grid, locking in small profits on each swing.
- **No Directional Bias** – Profits on both up- and down-moves
- **Automated Entry/Exit** – Ideal for Expert Advisors (EAs) on MT4/MT5
- **Scalable** – Grid size and lot sizing can be tailored to account size and volatility
2️⃣ How It Works – Core Components
1. **Grid Levels**
- Define a **base price** (e.g. current EUR/USD mid)
- Set **intervals** (e.g. every 20 pips) above/below the base
2. **Orders**
- **Buy Limit** orders at 20, 40, 60 pips below base
- **Sell Limit** orders at 20, 40, 60 pips above base
3. **Take Profit (TP) for Each Order**
- TP typically equals the grid interval (e.g. 20 pips) so each triggered order nets a small profit
- No hard Stop Loss per order—risk is managed via overall exposure
4. **Cumulative P&L**
- Winning trades roll profits into the floating drawdown of unfilled orders
- As price oscillates, the grid “locks in” incremental gains
3️⃣ Pros & Cons
| Pros | Cons |
|---------------------------------------|------------------------------------------|
| ✅ Profits in ranging markets | ❌ Can incur large drawdowns in strong trends |
| ✅ Automated, systematic execution | ❌ Requires significant margin for multiple open trades |
| ✅ Scalable to any time-frame | ❌ Floating negative exposure if grid one-sided |
---
✅Low-Risk Best Practices
1. **Grid Spacing & Width**
- Wider grid intervals (e.g. 30–50 pips) reduce order density and margin use
- Use **ATR** (Average True Range) to adapt spacing to EUR/USD volatility
2. **Lot Sizing & Equity Risk**
- Risk ≤ 1–2% equity per full grid cycle
- Use **fixed fractional** sizing: each order size = (Equity × 1%) / (max number of open grid orders)
3. **Drawdown Control**
- **Maximum Open Orders** cap (e.g. 5 orders per side)
- **Equity Stop-Out**: if floating drawdown exceeds e.g. 10% of equity, close all orders
4. **Trend Filters**
- Use a **200-period SMA** or **ADX** filter: only enable sell grid if price < SMA (downtrend) or ADX < 25 (low momentum)
- Disables grid in strong one-way trends
5. **Grid Shifting / Re-Base**
- After a net grid profit, **shift** the base price to current mid to reset exposure
- Prevents runaway open trades far from current price
5️⃣ Step-by-Step: Applying to EUR/USD
1. **Choose Time-Frame**
- **H4 or H1** recommended: balances signal frequency and margin needs
2. **Define Grid Parameters**
- **Base Price:** current EUR/USD mid (e.g. 1.0980)
- **Interval:** 30 pips (≈ recent ATR on H4)
- **Levels:** 3 buys at 1.0950 / 1.0920 / 1.0890; 3 sells at 1.1010 / 1.1040 / 1.1070
3. **Set Order Size**
- Account equity $10 000, risk 1% = $100 per full grid
- Max open orders 6 → each order $100/6 ≈ $16.7 → ≈ 0.02 lots
4. **Configure TP & No SL**
- Each order TP = 30 pips (equals interval)
- No per-order SL; overall drawdown managed by equity stop
5. **Implement Filters**
- Only open **sell** grid if H4 close < 200-SMA; only open **buy** grid if H4 close > 200-SMA
- Pause grid if ADX > 30 (strong trend) or market events (e.g. NFP, ECB rate decision)
6. **Deploy & Monitor**
- Run on MT4 with an EA or semi-automated Expert Advisor
- Monitor margin usage; adjust grid or disable before major news
6️⃣ Example P&L Mechanics
| Trigger Price | Order Type | Entry | TP Target | Profit (pips) |
|---------------|------------|---------|-----------|---------------|
| 1.0950 | Buy Limit | 1.0950 | 1.0980 | 30 |
| 1.0980 | Sell Limit | 1.0980 | 1.1010 | 30 |
- If price moves down to 1.0950: buy executes, TP at 1.0980 nets +30 pips
- If price then climbs above base, sells trigger at 1.1010 nets +30 pips
2️⃣ Introducing Progressive & Regressive Scaling
🔼 2.1 Progressive Scaling
“Let winners run”—increase exposure after success
Concept: After each profitable grid cycle, step up your lot size by a fixed increment.
Why: Capitalizes on momentum and winning streaks.
How to apply:
Base Lot: 0.02 lots per order (1% equity risk).
After grid closes net-positive, next cycle = 0.03 lots.
Continue stepping up (0.04, 0.05 …) until a drawdown or equity-stop is hit.
Reset back to base lot after a losing cycle or whenever floating drawdown > 5%.
Caps & Safeguards:
Max Lot Cap: Never exceed 0.10 lots (or 2% equity risk).
Equity Stop: If floating drawdown > 10%, close cycle & reset.
🔽 2.2 Regressive Scaling
“Protect the downside”—reduce exposure after losses
Concept: After a losing grid cycle, step down your lot size to conserve capital.
Why: Limits damage during rough periods and preserves margin.
How to apply:
Base Lot: 0.02 lots per order.
If grid hits equity-stop or nets negative, next cycle = 0.015 lots.
Continue stepping down (0.01, 0.005) until you record a net-positive cycle.
Reset to base lot after recovery (e.g. two consecutive winning cycles).
Thresholds:
Don’t drop below 0.005 lots (to avoid over-shrinking).
After two winning cycles at reduced lot, return to base.
✅ Bottom Line
Forex grid trading on EUR/USD can generate steady gains in choppy markets—but demands **strict risk controls** (grid spacing, lot sizing, drawdown limits) and **trend filters** to avoid large losses in trending conditions. When properly applied, a low-risk grid on EUR/USD offers a robust, mostly hands-off strategy for capturing repetitive market swings.
4️⃣ Key Takeaways
Progressive Scaling lifts lot sizes on winning streaks, amplifying gains—but must be capped and reset on losses.
Regressive Scaling shrinks exposure after drawdowns, preserving capital until the strategy recovers.
Combine both with your grid’s risk parameters, trend filter, and a solid equity-stop to maintain a balanced, low-risk EUR/USD grid.
By layering scaling rules atop your grid, you adapt dynamically to market performance—maximizing winners and protecting against prolonged losing runs. Good luck! 🚀

GBPUSD - Big Move Setting Up - Elliott Wave AnalysisGBPUSD is currently unfolding a 5-wave impulsive move according to Elliott Wave Theory.
At the moment, we are in Wave 4, which typically corrects against the larger trend.
Key Points:
Wave 2 was a simple correction, so based on alternation, Wave 4 is expected to be more complex (likely an ABC structure).
Wave 4 often retraces to the 38.2% Fibonacci level — in this case, aligning perfectly with a long-term ascending trendline, providing additional confluence for a potential buy zone.
Trade Plan:
- Monitor the ABC correction for completion near the 38.2% retracement.
- Look for bullish confirmation (trendline break, bullish structure shifts, BOS, etc.).
- Entries will be considered after clear signs of bullish pressure.
- Stoploss: Below the lows formed during the Wave 4 correction.
Targets:
First Target: 1.3400 (450 pips)
Second Target: 1.3750 (800 pips)
Summary:
Patience is key during the Wave 4 correction. Once the setup confirms, this could offer a strong risk-reward opportunity within the overall bullish impulsive structure.
See our past GBPUSD setups below:
Swing 1:
Swing 2:
Swing 3:

DXY USD INDEX FORECAST Q2 W18 Y25DXY USD INDEX FORECAST Q2 W18 Y25
Professional Risk Managers👋
Welcome back to another FRGNT chart update📈
Diving into some Forex setups using predominantly higher time frame order blocks alongside confirmation breaks of structure.
✅ U.S. dollar index is a measure of the value of the dollar against a basket of six foreign currencies.
✅The currencies are the Euro, Swiss franc, Japanese yen, Canadian dollar, British pound, and Swedish krona.
💡Here are some trade confluences📝
✅ Break an d close below July 2023 key 100.00 levels.
✅ Foresee a pull back to, weekly imbalance, daily order block, daily 50ema, weekly order block and or weekly 50 ema.
✅ Awaiting to identify a significant break of structure bullish to use the DXY as confluence for our trading week 18 of Q2 toward key points of interest mentioned above.
✅ Forecasting continued bearish pressure long term.
✅Initially bullish outlook however upon price turn around. DXY to break 100.000 level again.
🔑 Remember, to participate in trading comes always with a degree of risk, therefore as professional risk managers it remains vital that we stick to our risk management plan as well as our trading strategies.
Pairs to look out for -
EURUSD
USDCHF
USDJPY
USDCAD
GBPUSD
📈The rest, we leave to the balance of probabilities.
💡Fail to plan. Plan to fail.
🏆It has always been that simple.
❤️Good luck with your trading journey, I shall see you at the very top.
🎯Trade consistent, FRGNT X

DXY TRADING SETUPDXY TRADING SETUP
Confirmation are in sight!
Get ready for a potential DROP!
Stay tuned for updates and confirmation signals!

DXY: Next Move Is Down! Short!
My dear friends,
Today we will analyse DXY together☺️
The price is near a wide key level
and the pair is approaching a significant decision level of 99.185 Therefore, a strong bearish reaction here could determine the next move down.We will watch for a confirmation candle, and then target the next key level of 99.910..Recommend Stop-loss is beyond the current level.
❤️Sending you lots of Love and Hugs❤️

Interpretation of 4.25 Gold Short-term Operation IdeasFrom the technical analysis of the hourly market, yesterday's low was at $3,306, and the rebound just now showed an obvious stop signal at this position. Based on this, the current short-term suppression level can refer to $3,315, and the higher level is $3,328. For short-term investors, you can consider waiting for the gold price to rebound to around $3,315 to arrange short orders and continue to be bearish on the gold price. The first thing to pay attention to below is the support of the low point just touched at $3,287. If this support level is lost, the next key support level will be $3,260, the first low point on the previous downward journey. If $3,260 is also effectively broken, the short-selling force will be further released, and the gold price may face a larger decline.

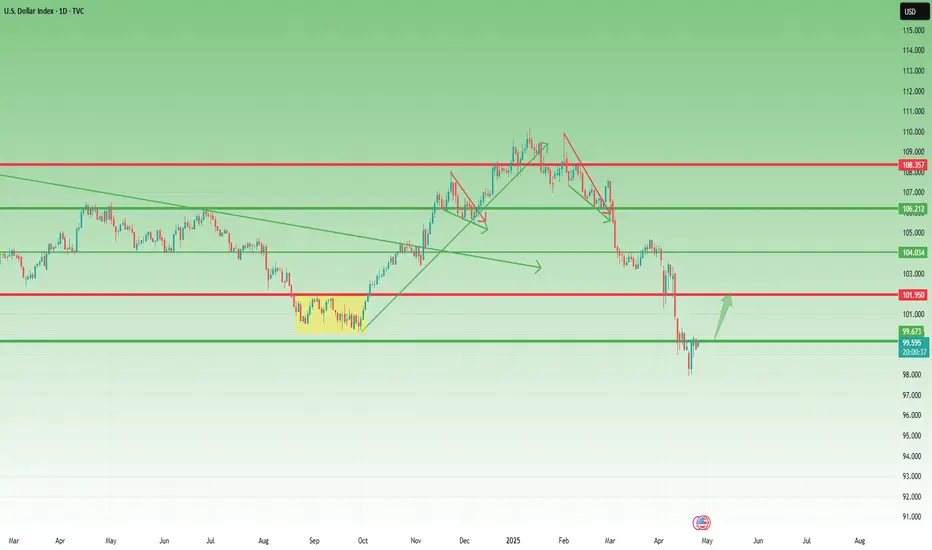
USD Index: A Possible Reversal in Sight?Since early February, right after Trump’s inauguration, the USD Index (DXY) has been under pressure, falling sharply by over 10%.
However, after hitting the 98.00 level, things seem to have stabilized. We're seeing the early signs of a relief rally.
🔍 Technical Perspective:
- This week’s candlestick pattern suggests a bullish reversal.
- The dip on Wednesday was quickly bought, showing buyer interest.
- A minor correction occurred yesterday, but dips are being well supported.
- Currently, the DXY trades around 99.60, just under the psychological level of 100.
🎯 Outlook:
As long as 98 remains intact, the bias shifts towards a potential rebound.
First target: 102 – a logical resistance zone and prior support.
This is not yet a confirmed trend reversal, but the price action is shifting. The key now is how the market reacts around the 100 level. A break above could trigger further bullish momentum.
Gold will continue to break out!Looking for the bullish price action to continue as we get ready to close the week and next week close the month. Watching for support as we move into the killzones. Excess has been created on the DOM and it should continue from here.

Dollar indexKey Insights:
Potential short-term bearish retracement incoming (Wave 5)
Long-term bull trend remains , Wave (4) zone occurs.
Ideal spot for smart traders to prepare setups using Elliott + supply/demand confluence.

USDJPY On The Verge Of A CollapseA simple trade setup with good risk/reward but with huge economic implications should this structure CRACK!
With all H&S patterns, the risk is that it head tests before breaking down.
We've seen this play out recently in NFLX
That is why it is important to wait for the CRACK! And not front-run the trade.

DXY Is Bullish! Buy!
Please, check our technical outlook for DXY.
Time Frame: 15m
Current Trend: Bullish
Sentiment: Oversold (based on 7-period RSI)
Forecast: Bullish
The price is testing a key support 99.109.
Current market trend & oversold RSI makes me think that buyers will push the price. I will anticipate a bullish movement at least to 99.404 level.
P.S
Overbought describes a period of time where there has been a significant and consistent upward move in price over a period of time without much pullback.
Disclosure: I am part of Trade Nation's Influencer program and receive a monthly fee for using their TradingView charts in my analysis.
Like and subscribe and comment my ideas if you enjoy them!

ALERT: EUR Broke Out of Long-term Downtrend Vs Currency Basket This is the aggregate EUR index against several currencies called EXY (like DXY)
Large downtrend from 2008 was breached this quarter to the upside.
The first trigger of trend weakness occurred in the summer of 2017
when EUR index crossed over mid-line and for the rest of time
the price has remained there.
In 2021, the price has shown a false break to the upside but failed to progress further.
That top is the nearest target for the price at 123, which will book +9% profit.
The next barrier is located at the top of 2014 of 140 with +24% gain.

XAUUSD - Will Gold Reverse?!Gold is trading between the EMA200 and EMA50 on the 15-minute timeframe and is on its uptrend line. A continued bullish move towards the supply zone will provide us with the next opportunity to sell it with a good risk-reward ratio. We expect a range of $10-$15.
Gold prices dropped by 4% on Wednesday, just a day after reaching an all-time high. The decline followed remarks by President Trump that helped ease Wall Street’s concerns about the ongoing trade war with China and tensions between the White House and the Federal Reserve.
Throughout this year, gold has seen a substantial rise due to investor fears over the economic consequences of tariffs. Additionally, the metal has benefited from capital fleeing U.S. assets amid political uncertainty under the Trump administration. On Tuesday, Trump reassured markets by stating that he had no intention of removing Jerome Powell as Fed Chair and expressed his expectation that tariffs on Chinese goods would soon be lowered.
Trump’s statements supporting Federal Reserve independence and hinting at easing trade tensions with China reignited risk appetite in financial markets, causing gold prices to tumble on Wednesday.Just a day earlier, prices had hit a record high above $3,500, as investors speculated that Trump might attempt to remove Powell. Trump had previously criticized Powell for not cutting interest rates and for warning that tariffs could lead to higher consumer prices.
Gold’s price surge this year has been especially notable following Trump’s decision to halt the implementation of sweeping new tariffs initially announced in early April. Gold, as a safe-haven asset not tied to any single national economy—unlike traditional alternatives such as the U.S. dollar or Treasuries, which are subject to U.S. government influence—has become increasingly attractive to investors wary of Trump’s policy decisions.
Meanwhile, the International Monetary Fund (IMF) has warned that continued tariff escalation in 2025 could push global public debt to 95.1% of GDP—an increase of 2.8 percentage points from previous forecasts. According to the IMF’s latest “Fiscal Monitor” report, if revenues and output fall significantly below expectations due to tariff-induced pressures, global debt could surpass 117% of GDP by 2027.
Investment bank JPMorgan has projected that gold prices could exceed $4,000 per ounce by mid-2026. This forecast is based on expectations of an economic recession, a prolonged trade war, and sustained demand from central banks. However, JPMorgan also cautioned that a sudden drop in central bank demand could threaten this bullish trend.
The IMF’s report further estimates that global public debt will climb to 99.6% of GDP by 2030, exceeding even the pandemic-era peak.
The IMF has forecasted global economic growth at around 2.8% for 2025. In this scenario, the U.S. budget deficit is projected to decrease from 7.3% of GDP in 2024 to 6.5% in 2025, and further down to 5.5% in 2026, largely due to increased tariff revenues and continued economic expansion.
These IMF projections for the U.S. deficit are based on policies announced up until April 2, 2025, and assume that the individual tax cuts enacted in 2017 will expire at the end of this year.

GBPUSD - Will the dollar go up?!The GBPUSD pair is above the EMA200 and EMA50 on the 4-hour timeframe and is moving in its ascending channel. If the pair corrects down towards the demand zone, it can be bought in the direction of its rise.
According to the latest Reuters survey of economists, U.S.-imposed trade tariffs have had a significant negative impact on the business environment in the United Kingdom. The assessment suggests that global trade tensions, combined with America’s protectionist policies, have undermined the confidence of British companies and investors in the country’s economic outlook. Market pricing reflects expectations that the Bank of England will cut interest rates by 0.84% over the course of this year.
The survey indicates that the UK’s GDP growth for 2025 is expected to average 0.9%, down from the previous estimate of 1%. Growth for 2026 is now projected at 1.2%, also lower than the 1.4% forecast made in March.
In terms of monetary policy, there is a strong consensus among economists that the Bank of England is on a gradual path toward easing interest rates. Projections suggest that the base rate will decline by 25 basis points each quarter throughout 2025, reaching 3.75% by year-end. Notably, all 67 economists participating in the poll expect the Bank of England to cut rates by 25 basis points at its May 8 meeting, bringing the rate down to 4.25%.
Meanwhile, the U.S.Federal Reserve, in its latest Beige Book release, reported that economic activity across the country has shown “little change.” The report detailed that only five districts experienced “modest growth,” three noted activity was “about flat,” and four reported “slight to moderate declines.” The Fed stated, “The outlook in several districts deteriorated notably due to heightened economic uncertainty, particularly stemming from tariffs.”
On employment, most districts experienced “little to slight” increases. One district noted a “modest increase,” four reported “slight gains,” another four observed no change, and three recorded “slight declines” in employment levels.
At the same time, prices continued to rise across the country. Six districts described price growth as “modest,” while the other six reported it as “moderate.” The Fed explained that most districts expected input costs to rise further due to tariffs.
UBS has issued a warning that Donald Trump’s calls for rate cuts may erode confidence in the Federal Reserve’s independence and fuel greater uncertainty in financial markets.
UBS analysts believe that reduced investment and consumption in the U.S. economy are primarily driven by increased economic uncertainty, rather than restrictive monetary policy. They emphasize that markets are highly sensitive to any perceived threats against the Fed’s autonomy, and in the current climate, it is this economic volatility—more than interest rate levels—that is harming the economy.
