USD/JPY. A simple, multi-year trend breakthroughThe Americans have become so utterly unpredictable, Dollar contunues its crash.
The main USDJPY graph indicates on a multi-year trend breakthrough.
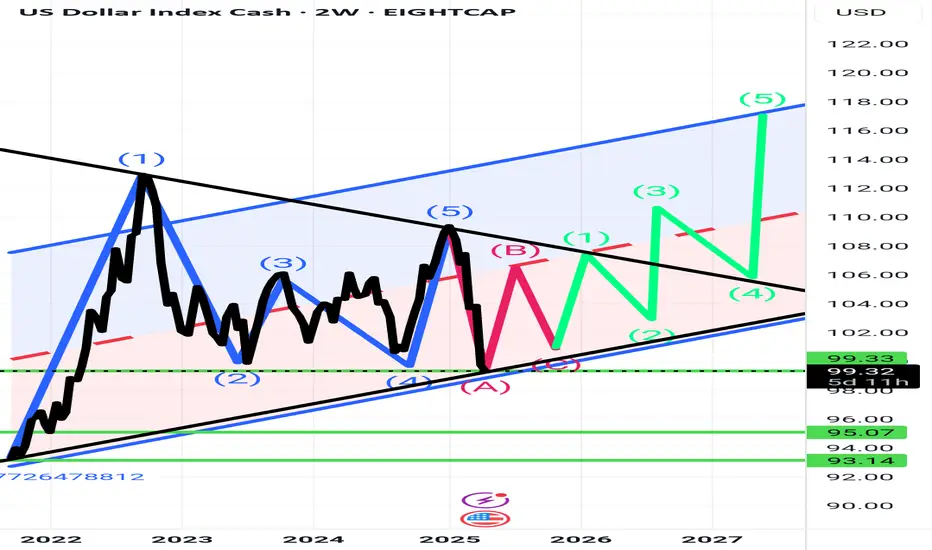
DXY

A Broader Market Review...As we have all seen within the last month or so, the U.S. equity markets have been getting the worst ass whooping since 2020. And as much as we'd like to forget that absolute disaster, it does bring to thought the idea of buying general market funds (such as AMEX:SPY , NASDAQ:QQQ , or AMEX:DIA ) to gain a nice entry into the next bull market, whenever that may be. However, not everything is all smooth sailing. The unfortunate part of this market downturn is that no amount of technical astrology fortune-telling analysis could have predicted the market's reaction to the tariffs being levied on foreign nations. So we need to put our big-boy pants on and look at the market as if it isn't some automatic wealth generating pattern that points north-east all day long.
Let's start with the tariffs. Firstly, we know there has been a 90 day pause on all conforming countries most notably leaving out China. It's not like that's anything special, just almost all our crap is made there. Unfortunately, we are observing what may be the greatest economic error of our lifetimes.
For those who are lost, foreign governments DO NOT pay for the tariffs in the way we are told. The U.S. Government levies the tariffs on the exporter (Chinese companies in this case), who then pass it on to the buyer of the goods (think Walmart, Target, Apple, etc.), who then pass those charges onto YOU... Enjoy!
So with an attempt at a full blown trade war, which the U.S. cannot win nor even has the industrial strength or infrastructure to compete, we can expect the markets to completely do a Bald Eagle courtship nosedive into new lows as observed a few weeks ago. But what will the Creature from Jekyll Island think of this?
Well miraculously, Fed chairman Jerome Powell claimed that the Fed will NOT allow the tariffs to exacerbate inflation into new highs. Get that, the Federal Reserve will not allow economic movements that raise prices on an importing nation ( that's the United States by the way), to raise prices anymore. While he's at it, how about we just get no inflation ever since it's just that simple?
And as if that wasn't enough, Donald Trump called for Jerome Powell to lower rates for some reason, saying that Powell was too late on his economic movement at the Fed. As it turns out, our plan for strengthening the economy is to.... weaken the dollar? Not sure why that's the case but at least we will be able to borrow more money at a cheaper price, as if the United States doesn't already have a debt problem. The Fed lowering rates would of course open the possibility of getting yet another wave of quantitative easing which will most likely be observed further down the road. Another round of QE, along with rate cuts, will of course send the equity markets to new highs on top of a weaker dollar.
Speaking of a weaker dollar, we should lastly talk about the TVC:DXY which measures the comparative strength of the U.S. Dollar to other currencies. As it turns out in this scenario, the dollar is getting weaker and weaker every day, meaning that people are running from U.S. Debt like it's the plague. If we were going to get a weaker dollar, at least could we have a higher market to offset our inevitable losses? I guess not...
Here is the TVC:DXY 1D looking back into late 2024.
Lastly for what to expect out of the market. If the trade situation will all the tariffs and this neo-cold war cool down, we might see some tariff pauses or lowering which will of course fire the market into new highs. However, if the situation doesn't cool, our debt yields rise, the market is going to go south faster than a Canadian in December. On a positive note, macroeconomic events move slowly, so it should be clear when a turnaround is coming...

Bearish drop?US Dollar Index (DXY) has reacted off the pivot and could drop to the 1st support.
Pivot: 100.22
1st Support: 97.47
1st Resistance: 101.83
Risk Warning:
Trading Forex and CFDs carries a high level of risk to your capital and you should only trade with money you can afford to lose. Trading Forex and CFDs may not be suitable for all investors, so please ensure that you fully understand the risks involved and seek independent advice if necessary.
Disclaimer:
The above opinions given constitute general market commentary, and do not constitute the opinion or advice of IC Markets or any form of personal or investment advice.
Any opinions, news, research, analyses, prices, other information, or links to third-party sites contained on this website are provided on an "as-is" basis, are intended only to be informative, is not an advice nor a recommendation, nor research, or a record of our trading prices, or an offer of, or solicitation for a transaction in any financial instrument and thus should not be treated as such. The information provided does not involve any specific investment objectives, financial situation and needs of any specific person who may receive it. Please be aware, that past performance is not a reliable indicator of future performance and/or results. Past Performance or Forward-looking scenarios based upon the reasonable beliefs of the third-party provider are not a guarantee of future performance. Actual results may differ materially from those anticipated in forward-looking or past performance statements. IC Markets makes no representation or warranty and assumes no liability as to the accuracy or completeness of the information provided, nor any loss arising from any investment based on a recommendation, forecast or any information supplied by any third-party.


Weekly FOREX Forecast: Buy EUR, GBP, AUD, NZD vs USDThis is the FOREX outlook for the week of April 21 - 25th.
In this video, we will analyze the following FX markets:
USD Index
EUR
GBP
AUD
NZD
CAD
CHF
JPY
Not a lot of movement last week, as price traded in a small range. May see more of the same this coming week, as there are no major news events planned. The USD is still weak, and there may be opportunities to buy against it in the EUR, GBP, AID, NZD, CAD, CHF, AND JPY.
Wait for good confirmation before taking valid buy setups!
Enjoy!
May profits be upon you.
Leave any questions or comments in the comment section.
I appreciate any feedback from my viewers!
Like and/or subscribe if you want more accurate analysis.
Thank you so much!
Disclaimer:
I do not provide personal investment advice and I am not a qualified licensed investment advisor.
All information found here, including any ideas, opinions, views, predictions, forecasts, commentaries, suggestions, expressed or implied herein, are for informational, entertainment or educational purposes only and should not be construed as personal investment advice. While the information provided is believed to be accurate, it may include errors or inaccuracies.
I will not and cannot be held liable for any actions you take as a result of anything you read here.
Conduct your own due diligence, or consult a licensed financial advisor or broker before making any and all investment decisions. Any investments, trades, speculations, or decisions made on the basis of any information found on this channel, expressed or implied herein, are committed at your own risk, financial or otherwise.

Dollar index (DXY) Analysis DXY Analysis – General Outlook
This week’s analysis is more of a general overview, and it closely aligns with my view on EUR/USD. While I don’t trade DXY directly, I use it heavily as a confluence tool, so marking out its likely direction is key for aligning trades across other USD-related pairs.
At the moment, I’m favouring Scenario A, where I expect DXY to move a bit lower, accumulate, and then react from the 2-day demand zone. If that happens, we could see a bullish move on DXY, which would naturally result in bearish pressure for other pairs like EU and GU.
However, if price decides to retrace upwards first, there’s a clean supply zone that still needs to be mitigated. If that zone holds, DXY could continue its bearish structure for longer—meaning more bullish momentum across other major pairs.

DXY SINGLING DANGER! UPTADE! Bad things happen when the dollar gets too strong....
Well, "the bad thing" now seems to be the dollar itself crashing lower.
What a difference 2 months can make!
Waging economic war against our allies, pulling military defense from allies, isolationism has not been working as expected. In fact, Trump has overplayed his cards, and his tactics are backfiring.
CAUTION is in order!!
Target not reached! Forced on me.
As mentioned back on January 18, 2025, when the dollar gets this strong, bad things happen.
As you can now all see, bad things did happen. Markets are crashing, and we are headed for an economic depression!
WARNING!

DXY SINGLING DANGER!Any Time The Dollar Gets In This Range Bad Things Happen!
With the exception of the 2008 GFC which confirmed we have entered Debt Deflation (Meaning the Gov will need to borrow more and more, faster and faster without any benefit to the real economy). A strong dollar is signaling something very bad is coming.
Gun to head I would guess something like an Asian Currency Crisis. Russian ruble & economic collapse is now a certainty! Russia has lost the war no matter what they are trying to do on the battlefield it is irrelevant as the economy is now suffering from Dutch Disease. (So Much for the BRICS fantasy!)
Most Americans believe a strong dollar is good. They are wrong. Here are a few things to know about a strong US Dollar.
1. A strong dollar weakens exports, costing American jobs as everything America made becomes more expensive to the rest of the world.
2. US Imports increase as everything internationally made becomes cheaper.
3. Acquiring USD as foreign reserves becomes much more difficult and expensive. As exporters to the US have to produce more for less $s.
4. US investment in international currency collapses, forcing inflation, rates higher making borrowing/investment in foreign economies weaker. Leading to a snowball effect.
5. Commodities are traded in USD. As such energy/food to many poor nations will become a problem as they are net importers with already limited access to NYSE:S it will be magnified.
6. Finally (I could go on but I won't you get the point) when everyone leans on one side of the boat it capsizes. Meaning when everyone is running to invest in the US & the dollar.
Techanically how high can the USD go?
-120 is likely. (hopefully not much more)
-Longer term if things get bad enough it can break all-time highs of 165 as we have this massive bottoming inverse HEAD & SHOULDERS in place. CARNAGE!
- What I hope will happen is that it hits previous recent highs of 115 and that will be it for the upside. HOWEVER!
We do have a rising structure that needs to be corrected. As such when it does correct there is a good possibility it tests previous lows.
For now, if you live in the US. enjoy dollar strength and think about how much worse inflation would have been if the $ was weakening. ))

$NIFTY in bullish momentum. More upside-expectedDuring the last few days, we have been discussing the weakness in the US Dollar and the TVC:DXY index and what it means for the commodities like Gold ( AMEX:GLD ) and Oil ( TVC:USOIL ). But we never discussed the positive effect it has on the emerging markets like $NIFTY. The index NSE:NIFTY which consists of top 50 stocks based on market cap in India is having a positive momentum divergence after touching the lower bound of the upward sloping Fib retracement levels. Here in this blog space on 17th March we posted that NSE:NIFTY looks oversold and we might be ready for a bounce. We favored going long NSE:NIFTY at 22000. Since then, the RSI bottomed and we up 8% form the lows of 22032.
If we still follow the Fib levels from the last blog, the charts are telling us that we might be headed to 25000 before having any meaning full pullback. The index internals look healthy with RSI hovering around 50 and not in overbought territory. And the tailwind to all this is still the US Dollar story. Here we are targeting 95 in the TVC:DXY on a short-term basis. This might push NSE:NIFTY to 25000 and beyond.
Verdict : NSE:NIFTY rally continues to 25000; TVC:DXY to 95.

DXYDollar needs more correction before downside.
Disclosure: We are part of Trade Nation's Influencer program and receive a monthly fee for using their TradingView charts in our analysis.

USDX in danger ! Usdx or Dxy or Us dollars index in dangrous position .. it needs to reverse soon.
Im not sure what is the impact of further decline but seriously it will be harmfull . !
I forcast the positive vision .. otherwise ....!!!!!!
DXY Analysis - MORE DOWNSIDEHere is my analysis on the DXY (US Dollar Index).
Basically, I'm expecting lower prices. Now i'm just waiting for more information on the daily and sub-daily chart to guide me in the right direction.
- R2F Trading

Natural Gas | Oil | Dollar | Silver | Gold Price ForecastNatural Gas | Oil | Dollar | Silver | Gold Price Forecast
NYMEX:CL1! COMEX:SI1! COMEX:GC1! AMEX:UNG

DXY The Fake Dance- One of the most important barometers for global currencies and markets in the world.
- Most of the time DXY is a well used machine to supress markets (forex, stocks, cryptos, etc..)
- When they don't start the printing machine, DXY keeps is strength.
- When they start to print DXY starts to dip and markets boom up.
- it's really basic and based on "BRRR Machine".
- i had a hard time to decrypt this fake peace of resilience.
- actually there's none visible divergences on the 1M or 3M Timeframes.
- So i decided to push my analysis to 6M Timeframe and noticed few things :
- You can notice that from 2008 ( Post crises ), DXY was in a perma bullish trend.
- So now check MACD and will notice this fake move on January 2021 ( in graph the red ? )
- MACD was about to cross down, columns smaller and smaller, then a Pump from nowhere lol.
- i rarely saw that in my trading life on a 6M Timeframe.
- So to understand more this trend, i used ADX (Average Directional Index)
- ADX is used to determine when the price is trending strongly.
- In many cases, it is the ultimate trend indicator.
- So if you look well ADX columns, you will notice that a strong divergence is on the way.
- First check the Yellow Doted Line in July 2022 when DXY reached 115ish and look the size of the green columns.
- Now check today (red doted Line), and look again the ADX green columns is higher, but DXY diped to 105ish.
- So like always, i can be wrong, but i bet on a fast DXY dip soon or later.
- it's possible to fake pumps, but it's harder to fake traders.
Happy Tr4Ding !

I've Cracked the BULLISH Code in Dollar IndexDollar Index is setup for longs based on COT and other fundamental underlying conditions.

DXY: Local Bullish Bias! Long!
My dear friends,
Today we will analyse DXY together☺️
The recent price action suggests a shift in mid-term momentum. A break above the current local range around 99.390 will confirm the new direction upwards with the target being the next key level of 99.627 and a reconvened placement of a stop-loss beyond the range.
❤️Sending you lots of Love and Hugs❤️

GOLD v DXY in breakout move --- HVF hunt volatility funnelAlways good to measure against the DXY not just the USD value
Not perfect of course as it is mainly the Euro and Yen but still insightful.
Been watching the relationship for a while
currently breaking out to the upside
HVF theory means this should be a violent expansion
Target 1 coming up.

DXY Is Bullish! Buy!
Take a look at our analysis for DXY.
Time Frame: 9h
Current Trend: Bullish
Sentiment: Oversold (based on 7-period RSI)
Forecast: Bullish
The market is on a crucial zone of demand 99.408.
The oversold market condition in a combination with key structure gives us a relatively strong bullish signal with goal 101.388 level.
P.S
Please, note that an oversold/overbought condition can last for a long time, and therefore being oversold/overbought doesn't mean a price rally will come soon, or at all.
Disclosure: I am part of Trade Nation's Influencer program and receive a monthly fee for using their TradingView charts in my analysis.
Like and subscribe and comment my ideas if you enjoy them!

EURUSD Holds Below 3-Year HighsAs the U.S. dollar lingers near 3-year lows, the euro is testing 3-year highs—holding critical resistance zone at 1.1520.
This level marks a pivotal point, further challenging the broader downtrend that has shaped the EUR/USD chart since 2008.
A confirmed breakout above 1.1520 could open the door to further upside toward 1.17 and 1.20, revisiting the highs last seen in 2021.
Should the euro fail to break higher and begin to retreat, key support levels to watch include 1.1270, 1.1140, 1.1000, and 1.0920.
A potential pullback may be amplified if overbought momentum begins to fade—particularly as the current 3-day RSI levels echo those last observed in 2020.
Written by Razan Hilal, CMT

Perfect trade setup: $GLD to 325; DXY to 95Gold has been in a raging bull market since 2023 with the index making new higher highs and higher lows as shown in the weekly candle stick chart. In contrast the Dollar index TVC:DXY is making new lows every single day shown in dark blue line chart. In this blog space we have been continuously talking about the weakness in the Dollar and the major support and resistance levels in TVC:DXY for more than 3 months. As the TVC:DXY is below the psychological level of 100 and most probably heading lower where 95 is the key support level, I think the time for commodities like Gold has arrived. SPY Gold Spot ETF AMEX:GLD has made an ATH of 302 which is above the key psychological level of 300.
In my opinion AMEX:GLD is not done going up. If we plot the Fib retracement levels for the previous bear market ending in 2022, we see that AMEX:GLD can effectively reach 325 level which is the 4.236 fib level. This will indicate another 7% upside, a similar amount of potential downside in the $DXY.
Verdict: Long AMEX:GLD , Short TVC:DXY until trend reversal.

USD Price Action Correlation with Bitcoin PriceIn the later stages of the liquidity cycle you have a devaluation of USD leading to bitcoin breaking out of its bullish trend into a parabolic trend.
-Last 2 cycles this predictive correlation leaded bitcoins breakout by 4 to 6 months.
-Current cycle DXY/Bitcoin charts look very similar to 2018
Taking this correlation into account, we could likely see the bullish trend on Bitcoin transform into a parabolic trend sometime between May and June. Meaning, we are in the final stages of a bottoming in Bitcoin at the time of this post, likely about to continue bullish momentum as we just went through significate market strain. Removing the possibilities of another Black Swan event, like a major geopolitical event but it is my belief that this was already priced in from the markets reaction just this month. This being said, there are no certainties. Things could always get worse. Time will tell, but given my aforementioned annalists, the buying opportunity at this current point is to great to ignore. Reward greatly outweighing the risk.

