Dollar Index (DXY): Possible Reversal | Inverse Head & ShouldersThe dollar has had a tough year, but that might be changing.
I’ve spotted a well-known reversal pattern: an Inverse Head & Shoulders.
This pattern features three dips, with the middle one—the "head"—being the deepest.
Now, the price has rebounded from the Right Shoulder and is heading higher.
It’s approaching the Neckline at $98.7, which needs to be broken for a bullish confirmation.
If that happens, the projected target is around $101.6, based on the depth of the pattern.
This lines up closely with the previous high of $102 from May. The target area is highlighted in the blue box.
However, if the price falls below the Right Shoulder’s low at $97.1, the pattern would be invalidated.
Anyone else see this pattern?
Could this be the bottom for the dollar?
DXY

New Week...New Bullishness on Gold???Sorry my post have not been showing up. I have mistakenly been posting them as private! lol. But new week on gold looking to see some good bullish action this week but it also is the end of the month and price could stall till we get some news to move it. I need more confirmation before taking any moves so we are watching for now.

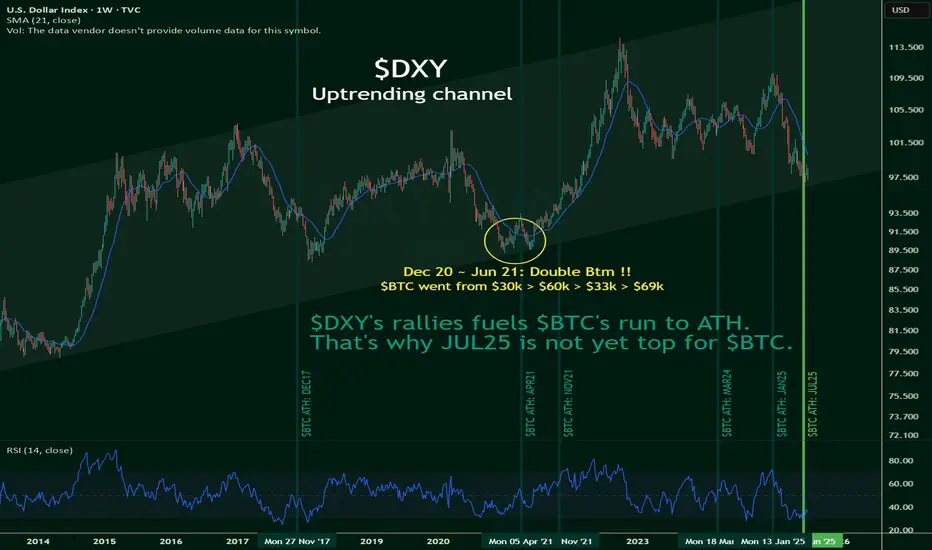
$BTC's run to ATH is fueled by $DXYNOT FINANCIAL ADVICE
I've yet to see this being mentioned anywhere on the internet, but TVC:DXY 's rally may just be CRYPTOCAP:BTC 's best friend.
This, despite the popular notion that when TSX:DXT goes up, CRYPTOCAP:BTC goes down, and vice-versa.
However, this novel idea puts a break to it.
TVC:DXY is hitting the bottoms of its uptrending channel, and it's likely to bounce back up towards the ceilings.
Which means a rally is likely, and this is kinda good for $BTC.
I'll remain bullish, until the numbers say otherwise.
Natural Gas | Oil | Dollar | Silver | Gold Price Forecast.Natural Gas | Oil | Dollar | Silver | Gold Price Forecast.
NYMEX:NG1! AMEX:UNG NYMEX:CL1! COMEX:GC1!

DXY forecast From weekly view the DXY is looking bearish at least till 95.123 key level the will see if we get a bullish power as the DXY is forming a reversal pattern. But of course many factors plays part in this economy, for example, global news like Tariffs and other factors.
So when DXY is trading on the 95.123 key level additional confluence will give us the right to put on trades, as the 95.123 key level is significant for what will take place next.
Take you all.......

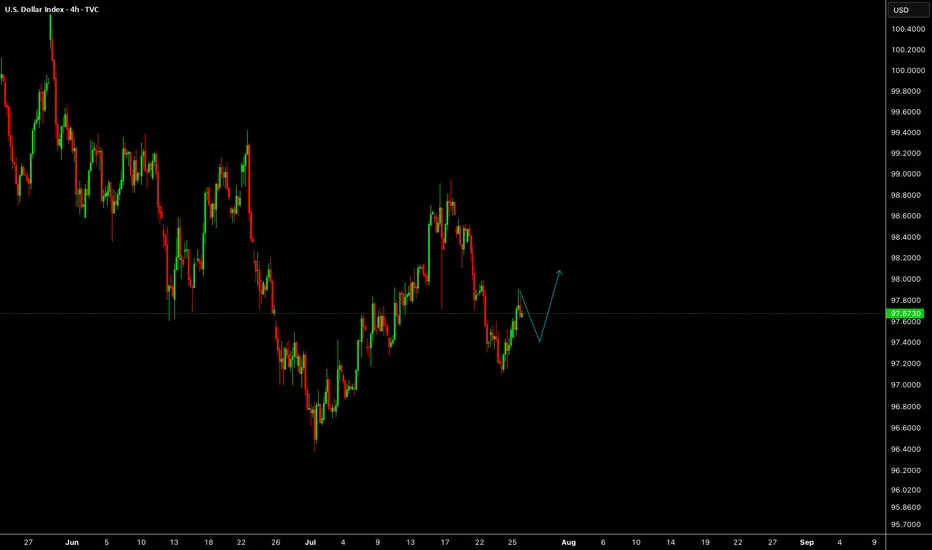
DXY 4Hour TF - July 27, 2025DXY 7/27/2025
DXY 4hour Bearish Idea
Monthly - Bearish
Weekly - Bearish
Dailly - Bearish
4hour - Bearish
**We analyze DXY as an indicator of USD strength on a week to week basis**
This week is looking like we can expect bearish momentum on USD but here are two scenarios breaking down the potential:
Bearish Continuation - USD pulled a strong bearish reversal all last week which pushed us below our major 98.000 support zone.
We are now testing that same 98.000 zone as resistance and are looking to see if it will hold. Ideally, we can confirm further bearish structure to gain confidence in a bearish USD for the week ahead.
Bullish Reversal- For us to consider DXY as bullish again we would need to see bullish structure above our 98.000 zone. This would include: A break back above 98.000 with an established HH and HL.

DXY weekly outlookDXY Weekly Outlook
This week, I’m watching to see if the dollar continues its bearish trend or breaks above the current supply zone. We've already seen a strong reaction from the 8hr supply, but price could still tap into the 1hr supply before making its next move.
If price drops from here, I’ll be looking at the 2hr demand zone below for a possible bullish reaction. If DXY pushes up from that zone, pairs like EU and GU could drop — which lines up with my overall short bias on those.
Gold may not always move in sync with the dollar, but DXY still gives a good idea of market sentiment.
Let’s see how it plays out and stay reactive.

I HATETO BETTING. LET SEE WHY DXY Goes to there in my scenarioon August scenario
* Trumph's 10% import Tariff (Decision imminient)
* Powell speaking at Jackson Hole (August 22-24)
* Safe Haven printing Money

DXYDXY needs some more correction, if the correction is completed before Feds decision then a drop can follow otherwise Feds will push it up and NFP will drop it again.
Disclosure: We are part of Trade Nation's Influencer program and receive a monthly fee for using their TradingView charts in our analysis.
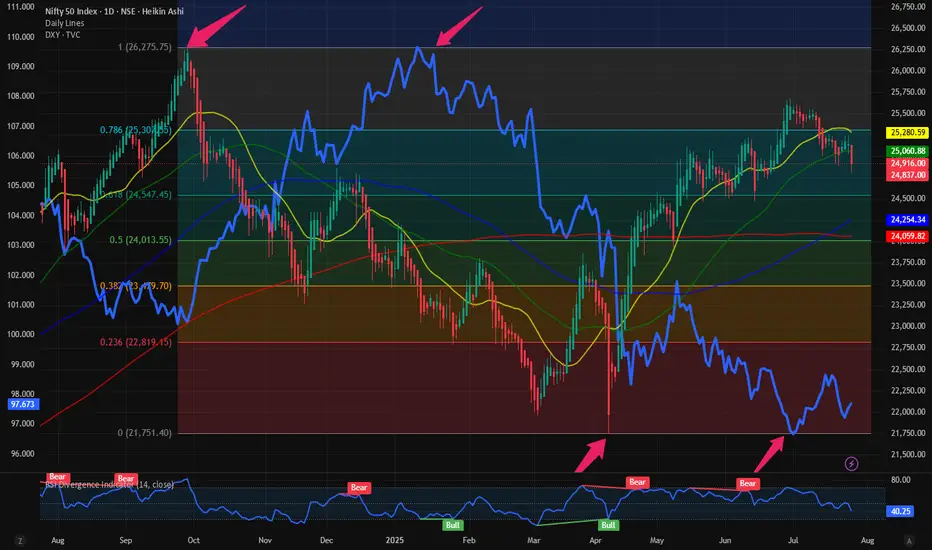
$NIFTY: Minor hiccup or downside expected. Answer: Watch $DXYRecently we have seen some weakness in NSE:NIFTY where it has failed to break out of the upward sloping Fib Retracement level. On June 16 we reflected upon the situation with $NIFTY. I was bullish on NSE:NIFTY due to the $DXY.
TVC:DXY weakness and EM markets: NSE:NIFTY more upside? for NSE:NIFTY by RabishankarBiswal — TradingView
My prediction was that the NSE:NIFTY can reach 26000 and TVC:DXY @ 96 by end of July. But the unravelling of the TVC:DXY short trade and recent strength in TVC:DXY has put pressure on our outlook.
Now we can go to the micro level and check what happening in the charts for both TVC:DXY and $NIFTY. In the daily chart below we overlayed TVC:DXY on top of the NSE:NIFTY candle stick chart. If we draw the Fib retracement level form the top to bottom of the NSE:NIFTY on the yearly chart we can see clear levels at play. It is also astounding to see how the Top and the bottom range of the Fib levels match to those from the $DXY. After making a new low of 97, TVC:DXY saw some short covering which took it back to 99. At the same time NSE:NIFTY put out a local top @ 25600 and then pulled back below to 0.786 Fib level currently below the psychological level of 25000. Hence our July end target of 26000 for NSE:NIFTY and 96 for TVC:DXY looks distant but not unrealistic. With 4 more trading days left in the month we might rally another 4.5% in NSE:NIFTY and drop 2% in TVC:DXY giving us a perfect leverage trade and meeting our July targets.
Verdict: NSE:NIFTY @ 26000 and TVC:DXY @ 96 as target remains intact. If not in July, we will achieve it in August.
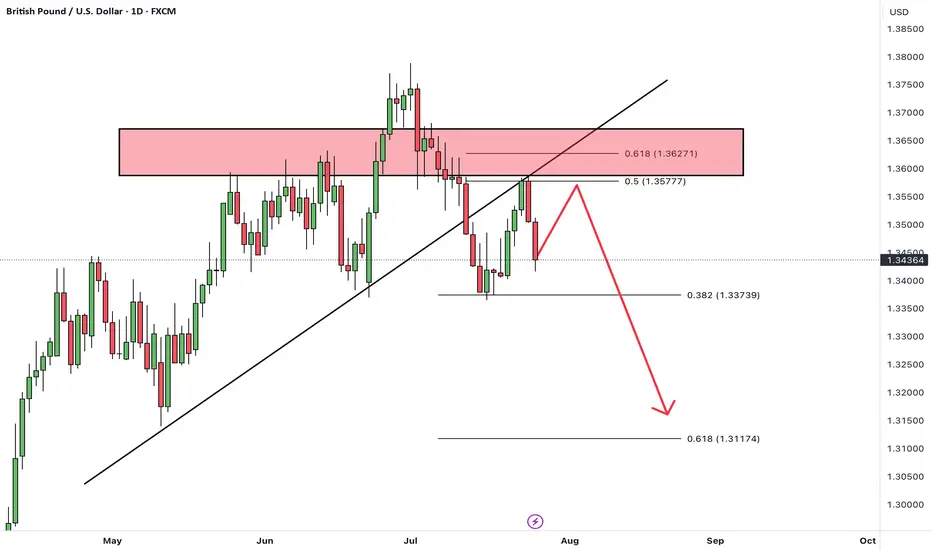
GBPUSDHello Traders! 👋
What are your thoughts on GBPUSD?
GBP/USD has broken below a trendline and has completed a retest (pullback) to the broken level.
The pair is now positioned for a potential downward move.
After some short-term consolidation, we expect price to drop at least toward the next identified support level.
As long as GBP/USD stays below the broken trendline, the bearish bias remains valid, and further downside is likely.
Don’t forget to like and share your thoughts in the comments! ❤️
XAUUSD FORECASTThis is what we currently see on
GOLD.
We have 3500.103 key level as our current high zone and 3122.168 key level as our low zone. And Gold is been attempting to break 3435.00 key level resulting in selling, but been creating lower highs failing to break the created lows. Currently we a trading above the 3337.070 key level which is a critical key level, as it will determine the next coming movement.
Update will be given

Dow Jones Potential UpsidesHey Traders, in the coming week we are monitoring US30 for a buying opportunity around 44,650 zone, Dow Jones is trading in an uptrend and currently is in a correction phase in which it is approaching the trend at 44,650 support and resistance area.
Trade safe, Joe.

AUD/USD - Breakout (25.07.2025)The AUD/USD Pair on the M30 timeframe presents a Potential Selling Opportunity due to a recent Formation of a Trendline Pattern. This suggests a shift in momentum towards the downside in the coming hours.
Possible Short Trade:
Entry: Consider Entering A Short Position around Trendline Of The Pattern.
Target Levels:
1st Support – 0.6551
2nd Support – 0.6513
🎁 Please hit the like button and
🎁 Leave a comment to support for My Post !
Your likes and comments are incredibly motivating and will encourage me to share more analysis with you.
Best Regards, KABHI_TA_TRADING
Thank you.
Disclosure: I am part of Trade Nation's Influencer program and receive a monthly fee for using their TradingView charts in my analysis.

A tale of two wedgesIn early 2025 we’ve seen two classic wedge patterns on two of the market’s most watched charts: a falling wedge on the U.S. Dollar Index ( TVC:DXY ) and a rising wedge on the S&P 500 ETF ( AMEX:SPY ). Alone each tells its own tale—but together they sketch a tug‑of‑war between a fading dollar and resilient equities.
The Falling Wedge on DXY
A falling wedge in a downtrend signals waning bearish momentum and often precedes a bullish reversal once price breaks the upper trendline.
The Rising Wedge on SPY
A rising wedge in an uptrend is classically a bearish reversal pattern —a breakdown below the lower trendline confirms sellers are gaining control.
A Converging Reversal
Given the well‑known inverse correlation between the dollar and most assets, it’s noteworthy that both asset classes are flashing signs of a reversal. Taken together that makes a compelling argument.

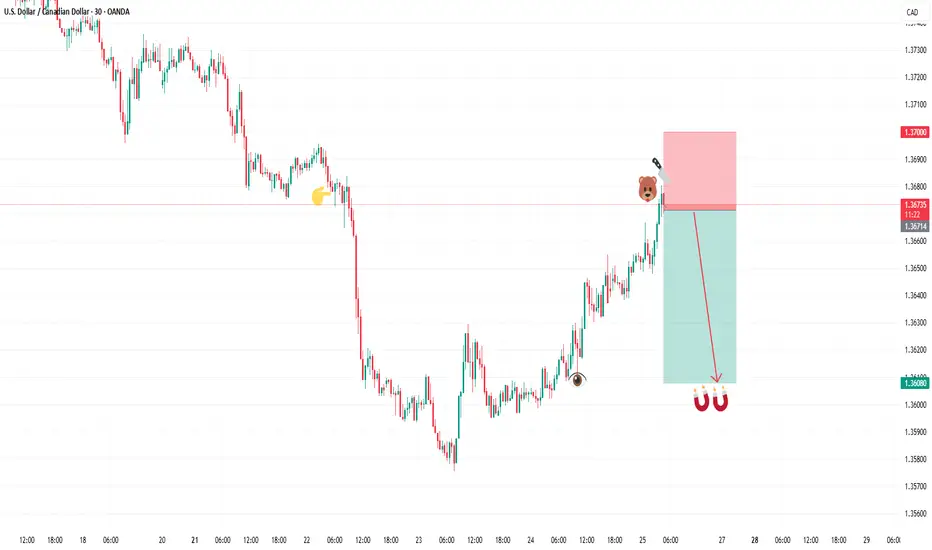
SELL USDCADIn todays session we are monitoring USDCAD for selling opportunities, we have our first entry at 1.36719 and our target is 1.36080 our stop is above 1.3700 , use proper risk management and risk what you can afford. Cheers fam.
Is the DOLLAR bullish? Look at the weekly support zone levelsI am trying to figure out what the recent bullish days mean within the overall range.
Please let me know what you think 🙏🏾

USD/CHF - Bearish Flag (24.07.2025)Fundamental Updates :
Dollar falls - New Trade agreement and uncertainties in Market :
President Donald Trump announced a trade deal on Tuesday with Japan, which lowers tariffs on auto imports to 15% in exchange for a $550 billion package of U.S.-bound investment and loans.
The USD/CHF Pair on the M30 timeframe presents a Potential Selling Opportunity due to a recent Formation of a Bearish Flag Pattern. This suggests a shift in momentum towards the downside in the coming hours.
Possible Short Trade:
Entry: Consider Entering A Short Position around Trendline Of The Pattern.
Target Levels:
1st Support – 0.7878
2nd Support – 0.7855
🎁 Please hit the like button and
🎁 Leave a comment to support for My Post !
Your likes and comments are incredibly motivating and will encourage me to share more analysis with you.
Best Regards, KABHI_TA_TRADING
Thank you.
Disclosure: I am part of Trade Nation's Influencer program and receive a monthly fee for using their TradingView charts in my analysis.

USD/CHF - Bearish Flag (24.07.2025)The USD/CHF Pair on the M30 timeframe presents a Potential Selling Opportunity due to a recent Formation of a Bearish Flag Pattern. This suggests a shift in momentum towards the downside in the coming hours.
Possible Short Trade:
Entry: Consider Entering A Short Position around Trendline Of The Pattern.
Target Levels:
1st Support – 0.7878
2nd Support – 0.7855
🎁 Please hit the like button and
🎁 Leave a comment to support for My Post !
Your likes and comments are incredibly motivating and will encourage me to share more analysis with you.
Best Regards, KABHI_TA_TRADING
Thank you.
Disclosure: I am part of Trade Nation's Influencer program and receive a monthly fee for using their TradingView charts in my analysis.

DXY: Strong Bullish Sentiment! Long!
My dear friends,
Today we will analyse DXY together☺️
The in-trend continuation seems likely as the current long-term trend appears to be strong, and price is holding above a key level of 96.722 So a bullish continuation seems plausible, targeting the next high. We should enter on confirmation, and place a stop-loss beyond the recent swing level.
❤️Sending you lots of Love and Hugs❤️
DXY 1D – Tipping Point: News or Price Action?Hey Guys,
The DXY index is currently moving within a downtrend. This trend is unlikely to reverse unless it breaks above the 98.950 level.
Sure, key fundamental data could shift the trend, but without those news catalysts, a reversal at this point doesn’t seem realistic.
Don’t forget—98.950 is a critical threshold for the DXY.
I meticulously prepare these analyses for you, and I sincerely appreciate your support through likes. Every like from you is my biggest motivation to continue sharing my analyses.
I’m truly grateful for each of you—love to all my followers💙💙💙

Nasdaq Ascending Trend has been broken.Good night traders.
With Tuesday & today's move. NQ has broken the ascending trend, and retested the highs.
A total of 107 daily candles, 7,000pips move.
Reasons for taking this trade:
Current monthly candle has 2.9m volume, compared to a 6m & 7million from last 2 months. With only 8 days missing to end the month, how to fill all that pending volume?
Ascending trend has been broken and retested.
Expect a deep correction, around 2000-2400-2600 pips. There is correlation between 38.2 Fibo level.
Last week there was a manipulation with Powell dismiss rumor on Wednesday, next day on Thursday NQ rallied to the upside. Today being also Wednesday we saw a huge rejection to the upside, but there is no continuation.
DXY reaching bottom, + has a deeper short trend initiation, starting on January 13.
Trade will be validated if NQ creates a LL followed by a LH within the next 2 days.
What do you think of this analysis?
Thank you.
Enjoy

US Dollar Index - 4h Chart (CAPITALCOM)4-hour chart of the US Dollar Index (DXY) from CAPITALCOM shows the index's recent price movements. The current value is 96.955, with a slight increase of 0.054 (+0.06%). Key levels include a support at 96.413 and resistance at 97.554. The chart highlights buy signals at 97.012 and sell signals at 96.958 and 96.955, with a notable downward trend breaking below a support zone around 97.150.
