03.04.25 Morning ForecastPairs on Watch -
FX:EURAUD
FX:GBPAUD
A short overview of the instruments I am looking at for today, multi-timeframe analysis down to what I will be looking at for an entry. Enjoy!
DXY

BUY GBPUSDLadies and Gents, in todays session we are monitoring GBPUSD for potential upwards move. BULLS INCOMING. Our target is 1.2923 and stops are below 1.2852 and targets above 1.31207. This set up is on higher time frame meaning it might take few days to play out make sure to look for confluence on lower time frames and use proper risk management.

We now have a direction for GOLDSeems the entire market was waiting on Trump to do his thing. Now that we have that news out the way on Tarrifs the market is much more likely to give up a direction. Grounds for much safter plays.

DXY:Expect an uptrend based on the daily chart supportOn Tuesday, the price of the U.S. Dollar Index generally fluctuated in a range. The price reached a daily high of 104.345, a low of 103.99, and closed at 104.19.
Looking back at the performance of the U.S. Dollar Index on Tuesday, after the morning opening, the price initially fell under short-term pressure. Subsequently, it halted its decline and resumed its upward movement above the daily support level, but the overall range was limited. The price rose in a volatile manner, and finally closed with a bullish doji.
From a weekly perspective, continue to focus on the 106.60 level, which is a key level for the medium-term trend. Below this level, the medium-term trend is bearish, and the price increase is temporarily regarded as a correction within the medium-term decline.
Meanwhile, from a daily perspective, temporarily pay attention to the 103.90 level, which is crucial for the wave trend. Above this level, adopt a bullish stance for the wave trend. Also, on the four-hour chart, temporarily focus on the support at the 104.10 area. Therefore, before the price breaks below the low of Monday, bet on an upward movement based on the daily support. Only after a downward break will the trend turn bearish.
Currently, there is a lot of news, so everyone must be cautious of market risks.
Trading Strategy:
buy@103.90-104
TP:104.50-104.80
Get daily trading signals that ensure continuous profits! With an astonishing 90% accuracy rate, I'm the record - holder of an 800% monthly return. Click the link below the article to obtain accurate signals now!

EUR/USD - Played out perfectly Hi,
I have updated this trade idea many time since the start of March. Waiting for the retest of 1.075. We finally had the correction which gave us a perfect 2.75R return.

Tariff Tensions, Dollar Dips & Gold’s Record Rally!"As of April 2, 2025, the financial markets have been significantly influenced by recent economic data releases and geopolitical developments, particularly concerning the U.S. Dollar Index (DXY), gold (XAU/USD), and Bitcoin (BTC/USD).
1. Key Economic Data Reports and Their Impact:
U.S. Dollar Index (DXY): The DXY has experienced fluctuations due to recent economic indicators and policy announcements. The Job Openings and Labor Turnover Survey (JOLTS) reported softer figures, indicating a slight cooling in the labor market. Additionally, the Institute for Supply Management (ISM) released data reflecting a slowdown in manufacturing activity. These reports have contributed to a marginal decline in the DXY, which decreased by 0.02% to 104.2418 on April 2 .Financial TimesTrading Economics
Gold (XAU/USD): Gold prices have surged to record highs, nearing $3,150 per ounce. This increase is largely driven by investor concerns over potential economic slowdowns and uncertainties surrounding impending tariff announcements by President Trump . The anticipation of these tariffs has led investors to seek safe-haven assets, bolstering demand for gold.
Bitcoin (BTC/USD): Bitcoin has shown signs of recovery, trading above $84,000 with a nearly 2% gain in the past 24 hours . This rebound follows weeks of price weakness and is occurring amid the backdrop of upcoming tariff announcements, which have introduced volatility into the cryptocurrency markets.
2. Implications of the Data Reports:
Labor Market and Manufacturing Data: The softer JOLTS figures and the ISM manufacturing slowdown suggest a potential deceleration in economic growth. These indicators may influence the Federal Reserve's monetary policy decisions, potentially impacting interest rates and, consequently, the strength of the U.S. dollar.The Guardian+3EWF Pro+3KuCoin+3
Tariff Announcements: The anticipation of new tariffs has heightened market uncertainty. Investors are closely monitoring these developments, as they could have significant implications for international trade relations and economic stability. Such uncertainties often lead to increased demand for safe-haven assets like gold and can introduce volatility into both traditional and digital asset markets.
3. Major Contributors to Recent Market Movements:
Tariff Uncertainty: President Trump's impending announcement of new tariffs has been a primary driver of recent market volatility. The potential for widespread tariffs has led to concerns about a global economic slowdown, prompting shifts in investor sentiment .
Investor Sentiment and Safe-Haven Demand: The uncertainty surrounding trade policies has led investors to seek refuge in assets perceived as safe havens, such as gold. This shift has contributed to the significant rise in gold prices.
Cryptocurrency Market Dynamics: While Bitcoin has faced headwinds from global trade tensions, it has also shown resilience. Analysts suggest that traders may be overstating the impact of the U.S.-led tariff war on Bitcoin's price, indicating that other factors, such as market sentiment and technological developments, also play crucial roles .
In summary, the recent economic data releases and the anticipation of new tariffs have collectively influenced the DXY, gold, and Bitcoin markets. Investors are advised to monitor these developments closely, as they have the potential to significantly impact market dynamics in the near term.

+400 pips EURUSD swing trade setup V-shape recovery BUY LOW🏆 EURUSD Market Update
📊 Technical Outlook
🔸Short-term: BEARS 0680
🔸Mid-term: BULLS 1180
🔸Status: pullback in progress
🔸0660/0680 normal pullback
🔸BULLS still maintain control
🔸Price Target Bears: 0660/0680
🔸Price Target BULLS: 1160/1180
📊 Forex Market Highlights – April 2nd, 2025
🚨 Traders await Trump’s “Liberation Day” tariff
reveal at 20:00 GMT – markets holding breath
as global trade tensions escalate.
💷 GBP/USD Sluggish Above 1.2900
📉 Cable struggles to gain upside as USD
safe-haven demand kicks in pre-announcement.
🇪🇺 EUR/USD Pressured Below 1.0800
🔽 Euro weakens amid risk aversion and strong
dollar flows — key support at 1.0760 in focus.
🥇 Gold Shines Bright
🚀 Hits ATH above $3,100 amid rising risk-off
mood & global uncertainty. Safe haven demand surging.
🔔 Stay sharp — volatility ahead.

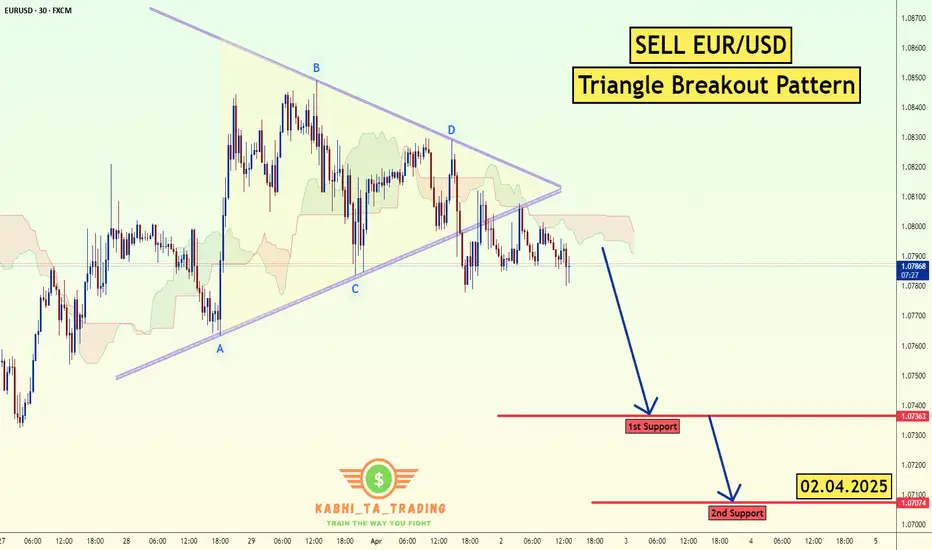
EUR/USD Triangle Breakout (02.04.2025)The EUR/USD Pair on the M30 timeframe presents a Potential Selling Opportunity due to a recent Formation of a Triangle Breakout Pattern. This suggests a shift in momentum towards the downside in the coming hours.
Possible Short Trade:
Entry: Consider Entering A Short Position around Trendline Of The Pattern.
Target Levels:
1st Support – 1.0736
2nd Support – 1.0707
🎁 Please hit the like button and
🎁 Leave a comment to support for My Post !
Your likes and comments are incredibly motivating and will encourage me to share more analysis with you.
Best Regards, KABHI_TA_TRADING
Thank you.
Gold running out of Gas to keep pushing up!I have been waiting for a solid pull back. Price looks like it wants to give it up. But since it is so bullish I have to wait for it to show its hand first before assuming. If price wants to continue with the strong bullish action I feel they need to come back and correct some of the price action first. Looking for signs they want to continue for Asian Session.

Monthly closing line, gold is alert to pull higher and fall backAt the end of March, the monthly and quarterly lines of gold and silver closed with saturated strong positive lines. The first trading day of the month has broken the high by inertia, which is consistent with expectations. Next, the focus should be on guarding against the potential scenario of pulling up shipments in the first half of the month, and the possibility of extreme volatility.
There are a lot of heavy news data from the 2nd to the 4th. I think there is a high probability that there will be an obvious turning point. However, given that the global political and economic situation has not cooled down significantly, even if there is a turning point and a correction, or even a sharp correction, it is still difficult to make a real judgment of a reversal of the big cycle trend. Therefore, I think the general idea of the short and medium-term line should be to maintain short first and then long.
The small resistance is around 3145--3155, and the important support during the week is around 3050. Given the recent volatility, it is obviously necessary to continue to be prepared to deal with continued large fluctuations.
The above strategy is based on current market analysis, and specific operations need to be combined with real-time data!

Smart Money at Work: EUR/USD Supply Zone Rejection! Money Concepts (SMC) reveal how liquidity moves in financial markets. In this setup, institutions leave behind footprints, forming supply zones where price reacts before a major move.
🧐 Key Observations:
✅ Price approaching a high-probability supply zone 🔲
✅ Liquidity grab before institutional moves
✅ Confluence of order blocks and Elliott Wave patterns
✅ Expecting a strong rejection & downside continuation 📉
💡 Key Idea: Market structure shifts and inefficiencies align with the natural flow of liquidity, just like waves in fluid dynamics!
📊 Will smart money drive this move? Let’s watch the reaction! 🏦⚡

Dollar Index Bullish to $111.350 (UPDATE)The DXY price action from my last video analysis has been moving as we expected & following the arrow accordingly.
We’ve seen a nice dip for the Dollar, a healthy retracement to the downside which should now be followed by the next bull run back up.
Major Wave 5 (Wave Y) en-route to $111.350📈

GOLD Market Update: Pullback in Progress BUY DIPS TP 3200 USD🏆 Gold Market Update (April 1st, 2025)
📊 Technical Outlook Update
▪️Bullish OUTLOOK
▪️Broke out and set new ATH
▪️Strong UPTREND: Sequence of Higher Lows
▪️Recommend to BUY DIPS at $3,050 USD
▪️Price Target BULLS: $3,150 USD - $3,200 USD
📈 Market Performance & Price Action
🚀 Gold Hits All-Time High: Surpassed $3,100 per ounce
📊 Driven by: Geopolitical tensions and economic uncertainty
🏦 Federal Reserve Impact
🛑 Fed Keeps Interest Rates Steady: Maintained at 4.25%–4.50%
🔮 Signals: 2 rate cuts likely in 2025 due to slowing growth
📉 Lower rate outlook supports bullish gold sentiment
💹 Gold Investment Trends
📈 Gold ETFs Outperform Physical Gold
GDX (Gold Miners ETF): ↑ 32%
GLD (SPDR Gold Shares): ↑ 15.5%
📊 Investors leaning toward mining stocks & ETF exposure for higher returns

Gold Wave 5 Bull Complete?! (4H UPDATE)There's 2 options on how I think Gold will complete its ‘Ending Diagonal’ pattern of the EW Theory & drop.
Option 1: We see a move higher towards $3,162 - $3,174 as a final LQ grab, before sellers kick in.
Option 2: Sellers kick in from CMP & slowly drag price back down.
Either way, I’m NOT LOOKING TO SELL until a strong confirmation at $3,057.

DeGRAM | DXY continued growthThe DXY is in an ascending channel between the trend lines.
The price is moving from the support level, the lower boundary of the channel and the lower trend line, which has already acted as a rebound point.
The chart has formed a harmonic pattern and successfully held the 50% retracement level.
We expect the growth to continue.
-------------------
Share your opinion in the comments and support the idea with like. Thanks for your support!

No Rate Hike, No Mercy – AUD/USD Selling in Style!Riding the wave of bearish structure, AUD/USD continues to follow the macro trend with laser precision. After the RBA held rates steady, we’re seeing the typical post-news dump play out—fueled by the market’s disappointment and reduced sentiment.
Technically, price respected the 4H Fair Value Gap (FVG) and showed strong displacement to the downside, confirming continuation.
Key Targets:
🔻 0.62311 – Minor liquidity
🔻 0.62185 – 1H Sell-side liquidity
🔻 0.61703 – Ultimate short-term sell-side target
Expecting the market to bleed lower unless major fundamentals flip the bias. Until then... the trend is your bestie.
DYOR 🧠📉

Eurusd Offfering Good Setup For Intraday eurusd is in downtrend in shorter tfs and now on verge of another consolidation breakout, after successful breakout it can give good intraday bearish setup, expecting 50 to 60 pips bearish wave after successful breakout.

DXY Bounces Back: I’m Staying BullishAfter breaking below the 104 support and hitting a low of 103.75, TVC:DXY staged a strong recovery, reclaiming support and signaling a potential false breakout.
The overnight retest of 104 established a higher low, suggesting further upside potential.
As long as 104 holds, I remain bullish and will look to sell EUR/USD and GBP/USD.

01.04.25 Morning ForecastPairs on Watch -
FX:GBPAUD
TVC:USOIL
A short overview of the instruments I am looking at for today, multi-timeframe analysis down to what I will be looking at for an entry. Enjoy!

GOLD - New Week, New Month, New Quarter! = Opportunity Gold has not been moving how I feel it normally should. The last 2 weeks have been extremely bullish with no significant pullbacks. I believe they wanted to close last month completely bullish before they offer the solid pullback that we are looking for. Also this is a new quarter. Taking it easy as we come into this new quarter but keeping a eye on all the signs for direction.

DXY:Seize the opportunity to sell short at high pricesThe situation in the Middle East is clearly deteriorating, which undoubtedly has a huge stimulating effect on the global risk aversion sentiment. More funds have started to seek safe havens. However, the best choice at present is not the US dollar. With the continuous rise of the East, more and more capital will favor this side of the East. Therefore, the pressure on the US dollar index is actually increasing, and it will be very difficult for it to rise.
Regarding the trend of the US dollar index today, although the current situation exerts great pressure, the actions to support the market of the US dollar index still take effect from time to time. So the price will not keep falling, and there will still be some oscillatory patterns. However, even if it moves in an oscillatory pattern, the upward pressure on the US dollar index will be significant. Therefore, when the price reaches the effective resistance level, it will be an excellent opportunity to short the US dollar index.
DXY Trading Strategy:
buy@104.500
TP:103.500
Get daily trading signals that ensure continuous profits! With an astonishing 90% accuracy rate, I'm the record - holder of an 800% monthly return. Click the link below the article to obtain accurate signals now!

EURUSD Weekly FOREX Forecast: BUY IT!In this video, we will analyze EURUSD and EUR Futures for the week of March 31 - April 4th. We'll determine the bias for the upcoming week, and look for the best potential setups.
The bias is bullish for now, but the April 2nd tariffs can flip the markets upside down. Be careful. Let the market tell you which direction it's going, and trade accordingly. Allow the markets to settle on a bias before you jump in.
NFP on Friday, btw.
Enjoy!
May profits be upon you.
Leave any questions or comments in the comment section.
I appreciate any feedback from my viewers!
Like and/or subscribe if you want more accurate analysis.
Thank you so much!
Disclaimer:
I do not provide personal investment advice and I am not a qualified licensed investment advisor.
All information found here, including any ideas, opinions, views, predictions, forecasts, commentaries, suggestions, expressed or implied herein, are for informational, entertainment or educational purposes only and should not be construed as personal investment advice. While the information provided is believed to be accurate, it may include errors or inaccuracies.
I will not and cannot be held liable for any actions you take as a result of anything you read here.
Conduct your own due diligence, or consult a licensed financial advisor or broker before making any and all investment decisions. Any investments, trades, speculations, or decisions made on the basis of any information found on this channel, expressed or implied herein, are committed at your own risk, financial or otherwise.

Gold | Oil | Dollar | Silver | Natural Gas Price ForecastMultiple Time Frame Analysis
Support and Resistance Key Levels Analysis
Gold | Oil | Dollar | Silver | Natural Gas Price Forecast
