DXY:Pay attention to the retest of the daily chart supportOn Tuesday, the price of the US Dollar Index generally declined. The intraday price peaked at 104.444, bottomed out at 103.917, and closed at 104.189.
From the perspective of the daily chart, the level of 103.80 below serves as a crucial watershed for the wave trend. As long as the price remains above this level, a short-term bullish position is advisable for the time being. Meanwhile, the short-term support of the four-hour chart is in the 104.10 area. Currently, the price in the short term is fluctuating and is likely to continue to retest the support area of the daily chart. Therefore, in trading operations, focus on the support of the daily chart and anticipate an upward movement.
Trading strategy:
buy@103.70-103.80
TP:104.50-105.00
Get daily trading signals that ensure continuous profits! With an astonishing 90% accuracy rate, I'm the record - holder of an 800% monthly return. Click the link below the article to obtain accurate signals now!
DXY

Skeptic | DXY Showdown: Battle at 104.403Welcome back, guys! 👋I'm Skeptic
Today, we're diving deep into the DXY (U.S. Dollar Index), analyzing key levels and potential triggers.
🔍 Recap & Current Structure:
As highlighted in our previous analysis , the major daily support (0.618 Fib) held strong at 103.303 , with price reacting precisely at this level.
Currently, the DXY is testing a critical 4H resistance at 104.403 , which aligns with:
A 4H consolidation range breakout zone
A potential fakeout trap if price fails to sustain momentum
The RSI (65.92) suggests building bullish momentum, but confirmation requires a clean break above 104.403.
📈 Bullish Scenario (Long Setup):
Trigger: Break & close above 104.403
Confirmation: RSI holding above 65.92
Invalidation: Rejection + close back below 104.000
📉 Bearish Scenario (Short Setup):
Trigger: Rejection at 104.403 + drop below 103.936
Confirmation: RSI reversal below 50 + bearish 4H candle close
⚠️ Key Notes:
Fundamentals: Recent economic data favors dollar weakness—trade longs cautiously.
Risk Management: Avoid overleveraging—wait for confirmed breaks.
Stay sharp, and I’ll see you in the next analysis!

USDJPY 18K PROFIT LIVE TRADE AND BREAK DOWNUSD/JPY rebounds toward 150.50 on risk recovery
USD/JPY is bouncing back toward 150.50 in Wednesday's Asian session. The pair reverses US President Trump's fresh tariff threats and hawkish BoJ commentary-led drop, tracking the rebound in risk sentiment and the US Dollar. All eyes stay on US tariffs, data and Fedspeak.

EURUSD Is due a correction EUR/USD has been in a sustained uptrend for some time, but we are currently seeing a period of consolidation. Given the current market structure, I anticipate a bearish move this week, with a potential entry either now or in the near future.
Let me know your thoughts, and if you found this analysis valuable, give it a boost!

3.26 Technical analysis suggestions for short-term gold operatioIn the early European trading on Wednesday (March 26), spot gold continued to rebound in the short term, and the current gold price is around $3027/ounce.
Gold technical analysis, how to operate in the evening? ——
The daily chart of gold shows that gold prices are rising above all bullish moving averages, while setting higher highs and higher lows. The 20-day simple moving average (SMA) has gained upward momentum and currently provides dynamic support around 2954.70. At the same time, after correcting the extreme overbought conditions, technical indicators resumed their upward trend within the positive level. From the 4-hour line, gold prices are fighting against the mildly bearish 20-period SMA, but are still well above the bullish 100-period SMA and 200-period SMA. At the same time, technical indicators are retreating from the midline and slightly lower within the neutral level. Overall, it is recommended to treat gold operations with a wide range of fluctuations today!
Gold operation strategy at night:
Short order strategy: short near 3031 above, stop loss 3040, target near 3010;
We will update regularly every day and introduce to you how we manage active ideas and settings. Thank you for your likes, comments and attention, we are very grateful

GBPUSD Is due a correctionThe GBP/USD pair has been in a sustained uptrend for some time, and while I maintain a bullish outlook, a pullback or correction appears likely. Below, I’ve outlined key target levels where I anticipate potential price movements.
I’d love to hear your thoughts—let me know your perspective. If you found this analysis valuable, consider giving it a boost!

eurusd alternative 5 wave outlook buy dips tp 1100🏆 eurusd Market Update / Wednesday
📊 Alternative Technical Outlook
🔸Bullish OUTLOOK
🔸5 waves Bullish Sequence on H12
🔸0230/0530 w1, 0530/0290 w2, 0290/0935 w3
🔸0935/0675 wave 4 pullback now
🔸0675/1100 - final wave 5 pump
🔸Recommend to BUY DIPS 0675/0665
🔸Price Target BULLS: 1100 USD in Wave5
💶📉 EUR/USD Mini Market Recap – March 2025
🔹 🛑 Fed Holds Rates
📉 No rate cut yet, but hints coming soon 🏦📊
🔹 💵 USD Strength Rising
💪 US data strong + tariff optimism = dollar gains 💼📈
🔹 📉 EUR/USD Weakens
⚠️ Testing 1.0798 support, 1.06 may come next 🚨📉
🔹 📊 Key US Data Ahead
🕵️♂️ Core PCE inflation data could move EUR/USD fast 📆📊
🔹 🌐 Trade Tensions Return
🧨 Tariff talk adds pressure to euro and dollar 💣💬

GOLD Bouncing Higher, Following 200-hour SMA Major Support Gold prices have experienced significant volatility over the last days, with conflicting reports on the current trend. According to some sources, gold prices have increased, with spot gold reaching nearly $3,050, new all the history high on Thursday, March 20, 2025.
The $3,000 milestone has sparked increased interest from investors and market analysts, meaning that Gold spot doubled in price over the past 5 years, 3rd time in history ever.
Despite the short-term volatility, gold has shown a strong performance since the beginning of 2025, with an increase of approximately 14-15% year-to-date. Market analysts remain bullish on gold, with some forecasting prices to reach $3,100-$3,200 per ounce in the near term.
The main 1-hour Gold spot OANDA:XAUUSD graph indicates on 200-hours SMA technical support, with further upside opportunity due to mentioned on the chart descending triangle (flat bottom/ descending top) breakthrow.
--
Best #GODL wishes,
@PandorraResearch Team

DOLLAR INDEX (DXY): Time to Recover
I see a confirmed bullish reversal on Dollar Index
initiated after a test of a key daily horizontal support.
A formation of a double bottom pattern on that and a consequent
violation of its neckline provides a strong bullish signal.
I think that the index will reach at least 105.0 level soon.
❤️Please, support my work with like, thank you!❤️

26.03.25 Morning ForecastPairs on Watch -
OANDA:XAGUSD
FX:EURUSD
FX:NZDUSD
A short overview of the instruments I am looking at for today, multi-timeframe analysis down to what I will be looking at for an entry. Enjoy!

DXY:Maintain a long position above the daily line supportOn Monday, the price of the US Dollar Index generally showed an upward trend. On that day, the price rose to a maximum of 104.422, dropped to a minimum of 103.814, and closed at 104.285. Looking back at the price performance on Monday, after the opening in the morning, the price initially came under pressure and declined in the short term.
Subsequently, when the price reached the 103.80-90 area, it stopped falling and then started to rise, and finally closed with a large bullish candlestick on the daily chart. Currently, since the retracement and rally on Monday have provided confirmation, if the price remains above the 103.80 level in the subsequent period, a swing long position can be taken.
In the short term, on the four-hour chart, attention should be temporarily paid to the support in the range of 104.00-104.10. After the price reaches this level in the future, further upward movement should be observed. In the short term, attention should be paid to the resistance in the area of 104.50-104.90 on the upside.
Trading strategy:
buy@104.00-104.10
TP:104.50-104.90
Get daily trading signals that ensure continuous profits! With an astonishing 90% accuracy rate, I'm the record - holder of an 800% monthly return. Click the link below the article to obtain accurate signals now!

EURUSD Short IdeaTrade entered. Entry rules met.
Confluences:
✅ Bearish overall bias
✅ Bearish demand zone
✅ Bearish impulse crab pattern
✅ Bearish divergence
✅ Bearish break of structure
✅ Entering London close zone
✅ Price is in entry zone
✅ Required risk:reward met
⭐ I shared this watch zone in my weekly forex outlook this week, you can subscribe by clicking the link in my bio.

potential liquidity grab and sell-offEUR/USD Key Setup – Smart Money in Action! 🚀
The market is setting up for a potential liquidity grab and sell-off! 📉 Here’s the breakdown:
🔹 Price is approaching a key supply zone (highlighted in yellow & purple). A strong reaction here could indicate a short opportunity.
🔹 Invalidation level is clearly marked—if price breaks above, the setup is invalid.
🔹 Anticipated move: A rejection from the zone could lead to a drop towards the 1.07200-1.07600 demand area.
🔹 Confluence factors: Structure, liquidity, and institutional order flow align with this move.
📊 Trade Idea:
✅ Entry: Wait for a confirmation in the highlighted area
✅ Stop Loss: Above the invalidation level
✅ Take Profit: Lower demand zone
💡 Will this setup play out? Let’s see how the market reacts! Comment below with your thoughts! 🔥📉
#ForexTrading #EURUSD #SmartMoney #PriceAction #Liquidity #ForexSetup

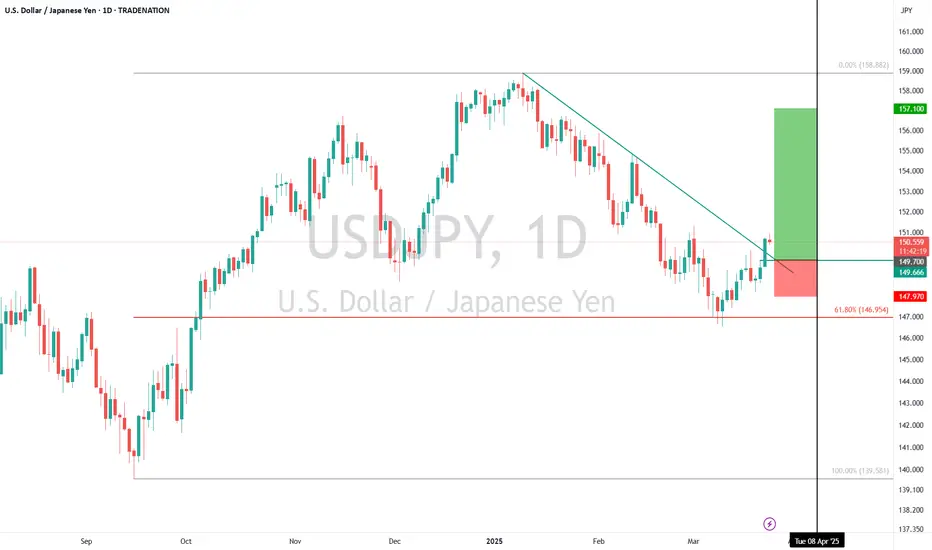
USDJPY Buy Setup – Breakout Confirmation & Seasonal TailwindTechnical: USDJPY has broken above a downtrend resistance line after finding support at the 61.8% Fibonacci retracement level at 146.95 . This breakout suggests the corrective phase may have ended, signaling potential for further upside. Pullbacks toward 149.70 (a retest of the broken trendline) present an attractive entry opportunity. Upside targets are 152.74 and 157.10 in the short to medium term. The setup is invalidated below 147.97 , with a break below 146.33 negating further bullish expectations.
Fundamental: Commercial selling of the Japanese Yen and renewed dollar purchases indicate a shift favoring USD over JPY, supporting the bullish technical outlook.
Seasonal: Over the past 25 years , USDJPY has risen 76% of the time between March 25 – April 8 , with an average gain of 1.04% .
Trade Idea:
Entry: On pullbacks toward 149.70
Stop Loss: 147.97 (or 146.33 for extended risk management)
Targets: 152.74 and 157.10
Disclosure: I am part of Trade Nation's Influencer program and receive a monthly fee for using their TradingView charts in my analysis.
+250 pips EURUSD XABCD Short From Resistance ADVANCED🔸Hello traders, let's review the 12 hour chart for EURUSD. Strong gains off the lows recently, however price getting overextended and expecting reversal later at/near PRZ/B.
🔸Speculative XABCD structure defined by point X 1140 point A 0240 point B 0935 point C 0425 point D/PRZ 1390 still pending. C also pending.
🔸Advanced short from point B targeting point C of the sequence.
Higher risk trade setup, use protective SL and adjust to PE at +50 pips.
🔸Recommended strategy for EUR traders: short sell rips / short sell
at market now, target is +250 pips or point C of the XABCD structure.
Later will update the setup for the BULLS for a potential ride to 1390.
🎁Please hit the like button and
🎁Leave a comment to support our team!
RISK DISCLAIMER:
Trading Futures , Forex, CFDs and Stocks involves a risk of loss.
Please consider carefully if such trading is appropriate for you.
Past performance is not indicative of future results.
Always limit your leverage and use tight stop loss.

Bears give the USD a break, EUR/USD pullback may not be overThe retracement higher for the US dollar is finally underway, which also shows further upside potential. And this is why I am wary of being long EUR/USD over the foreseeable future, even if I suspect it is poised to break to new highs in the coming weeks.
Matt Simpson, Market Analyst at City Index and Forex.com
