Major Levels Ahead: GBPUSD Trade Setup UnveiledHey friends, I’ve prepared a fresh GBPUSD analysis for you!
📍 Target level: 1.34028
🔻 SELL zone: Between 1.34532 and 1.34437
I expect the trade to reach its target during the London or New York session.
Every like and show of support fuels my motivation to share more analysis—thank you all for being part of this journey!
DXY

GBPUSD: Bearish > Bullish Order FlowAlright, we are approaching some Higher Timeframe Points of Interests. We got a Potential Bullish Bat Pattern Pattern this align with this Bullish H4 Order Block, that's right in the middle of an whole number 1.34. We could expect some spikes around the area, some complex pullbacks, but we must remain steady.

Bearish drop off 50% Fibonacci resistance?The US Dollar Index (DXY) is rising towards the pivot which acts as a pullback resistance and could drop to the 1st support.
Pivot: 99..15
1st Support: 96.54
1st Resistance: 100.57
Risk Warning:
Trading Forex and CFDs carries a high level of risk to your capital and you should only trade with money you can afford to lose. Trading Forex and CFDs may not be suitable for all investors, so please ensure that you fully understand the risks involved and seek independent advice if necessary.
Disclaimer:
The above opinions given constitute general market commentary, and do not constitute the opinion or advice of IC Markets or any form of personal or investment advice.
Any opinions, news, research, analyses, prices, other information, or links to third-party sites contained on this website are provided on an "as-is" basis, are intended only to be informative, is not an advice nor a recommendation, nor research, or a record of our trading prices, or an offer of, or solicitation for a transaction in any financial instrument and thus should not be treated as such. The information provided does not involve any specific investment objectives, financial situation and needs of any specific person who may receive it. Please be aware, that past performance is not a reliable indicator of future performance and/or results. Past Performance or Forward-looking scenarios based upon the reasonable beliefs of the third-party provider are not a guarantee of future performance. Actual results may differ materially from those anticipated in forward-looking or past performance statements. IC Markets makes no representation or warranty and assumes no liability as to the accuracy or completeness of the information provided, nor any loss arising from any investment based on a recommendation, forecast or any information supplied by any third-party.

GOLD-XAUUSD vs. The FED: Technicals or Fundamentals?Good Morning Traders,
Let’s break down what gold is showing us on the 1-day chart:
- **Resistance:** 3,378
- **Support:** 3,282
- There’s a noticeable **head and shoulders pattern** on the chart. Under normal conditions, gold’s target sits at **3,170**.
Gold is highly sensitive to fundamental factors. Sudden war news or events like last week’s rumors about Trump firing the Fed Chair can trigger serious volatility.
That’s why I always combine **technical and fundamental analysis** in my approach.
For gold to reach the 3,170 target, the **3,282 support level must first be broken**. Since that hasn't happened yet, we can't confirm a bearish move—fundamentals play a key role here.
Keep in mind: this is a **swing trade** setup based on a 1-day chart. Reaching the target could take time.
I want to sincerely thank everyone who’s been supporting my analyses with likes—your support is
my biggest source of motivation when it comes to sharing content.
Much love and respect to you all.💛

Gold will make a Low for the Week before Pushing BullishOn my previous Update I mention that we should have support off this H4 Gap. My problem with it s it immediately reacted to it when the market opened back up. well before the killzone. So I feel like this is a fake out to go short for now. they will make a low for the week then we will see it set up for the bullish move.

Natural Gas | Oil | Dollar | Silver | Gold Price Forecast.Natural Gas | Oil | Dollar | Silver | Gold Price Forecast.
NYMEX:NG1! AMEX:UNG NYMEX:CL1! COMEX:GC1!

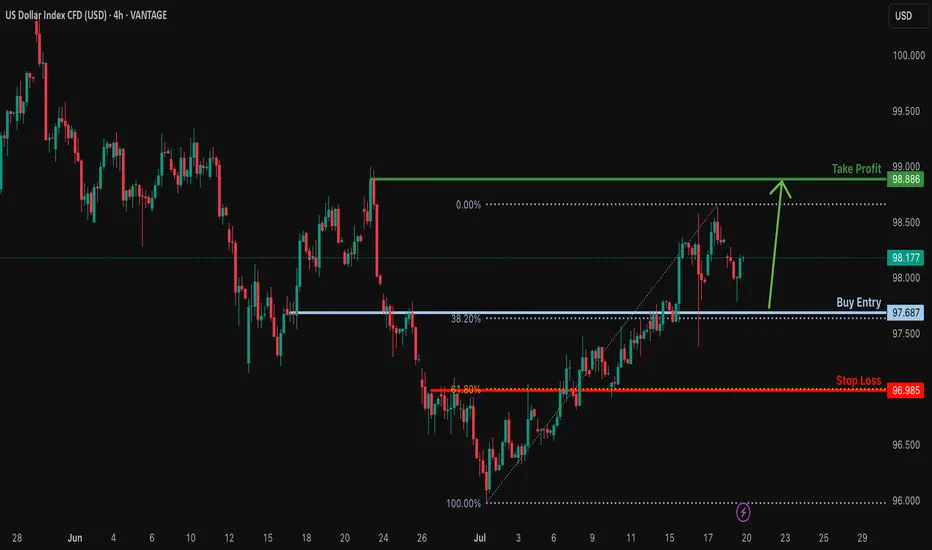
Bullish continuation for the Dollar?The price is falling towards the support level which is a pullback support that lines up with the 38.2% Fibonacci retracement and could bounce from this level to our take profit.
Entry: 97.68
Why we like it:
There is a pullback support that aligns with the 38.6% Fibonacci retracement.
Stop loss: 96.98
Why we lik eit:
There is an overlap support that aligns with the 61.8% Fibonacci retracement.
Take profit: 98.88
Why we like it:
There is a pullback resistance.
Enjoying your TradingView experience? Review us!
Please be advised that the information presented on TradingView is provided to Vantage (‘Vantage Global Limited’, ‘we’) by a third-party provider (‘Everest Fortune Group’). Please be reminded that you are solely responsible for the trading decisions on your account. There is a very high degree of risk involved in trading. Any information and/or content is intended entirely for research, educational and informational purposes only and does not constitute investment or consultation advice or investment strategy. The information is not tailored to the investment needs of any specific person and therefore does not involve a consideration of any of the investment objectives, financial situation or needs of any viewer that may receive it. Kindly also note that past performance is not a reliable indicator of future results. Actual results may differ materially from those anticipated in forward-looking or past performance statements. We assume no liability as to the accuracy or completeness of any of the information and/or content provided herein and the Company cannot be held responsible for any omission, mistake nor for any loss or damage including without limitation to any loss of profit which may arise from reliance on any information supplied by Everest Fortune Group.
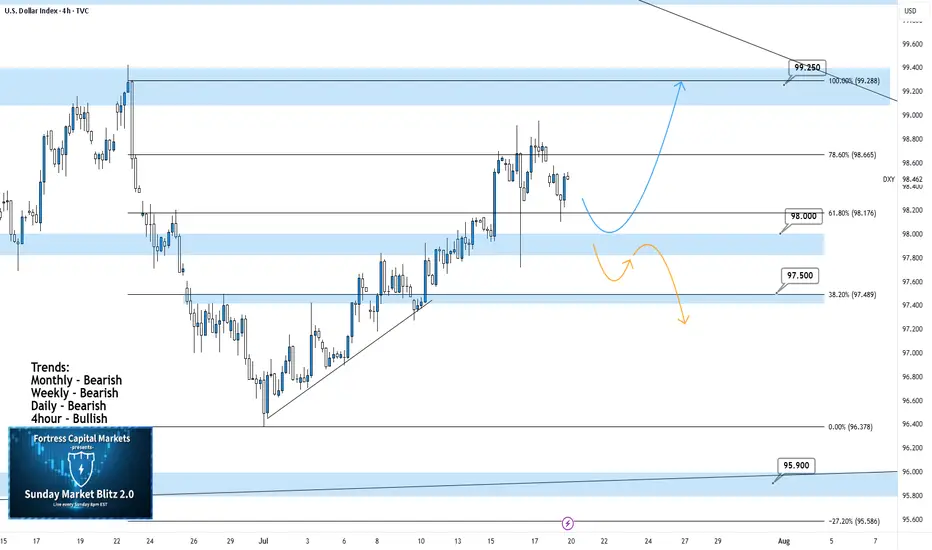
DXY 4Hour TF - July 20th, 2025DXY 7/20/2025
DXY 4hour Neutral Idea
Monthly - Bearish
Weekly - Bearish
Dailly - Bearish
4hour - Bullish
Higher timeframe trend analysis suggests that DXY is primarily bearish and is currently retracing to potential resistance.
Going into this week we are looking to see if our 98.000 zone will stay as support or transition into resistance. Here are two scenarios which highlight both a bullish and bearish outcome:
Bullish Continuation - Last week we saw a strong rally through our 98.000 zone which seems to still be holding. If this 4hour bullish trend is to continue we would like to see some sort of rejection off 98.000 support while also confirming a higher low. If this happens look to target higher toward major resistance levels like 99.250.
Bearish Reversal- If we are to consider DXY bearish again on the 4hour we would need to see a break below 98.000 support and confirm this level as new resistance.
There are a few major support levels to watch out for but DXY has the potential to fall dramatically if we see price get below 97.500.
Looking Over Gold Expectations for the coming Week!Last week had a solid play of moves. Ultimately closing out around 50% of its overall movement. Looking for price to continue with more bullish activity as we come into a new week. Keeping in tune to find areas I can take advantage and get active.

DXYDXY still have some more upside, let the market correct and push up further.
Disclosure: We are part of Trade Nation's Influencer program and receive a monthly fee for using their TradingView charts in our analysis.
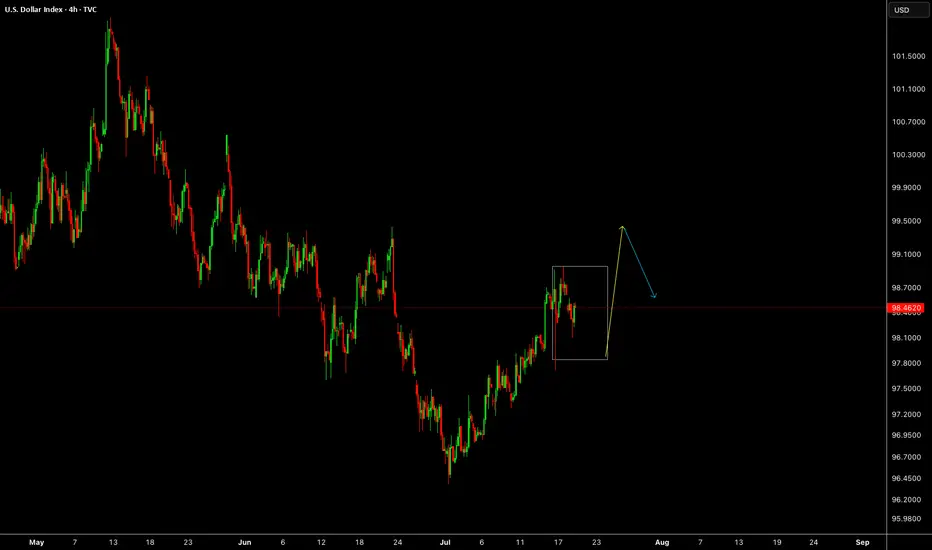
USD Is Still Bullish! Wait For Buys!Welcome back to the Weekly Forex Forecast for the week of July 21-25th.
In this video, we will analyze the following FX market:
USD
The DXY has run bullish last week, up into an area of Supply, where the momentum hesitates now. Next week may pull back a bit... before continuing higher to the buy side liquidity.
Look out for the short term pullback to the W +FVG for a high probability move higher!
Enjoy!
May profits be upon you.
Leave any questions or comments in the comment section.
I appreciate any feedback from my viewers!
Like and/or subscribe if you want more accurate analysis.
Thank you so much!
Disclaimer:
I do not provide personal investment advice and I am not a qualified licensed investment advisor.
All information found here, including any ideas, opinions, views, predictions, forecasts, commentaries, suggestions, expressed or implied herein, are for informational, entertainment or educational purposes only and should not be construed as personal investment advice. While the information provided is believed to be accurate, it may include errors or inaccuracies.
I will not and cannot be held liable for any actions you take as a result of anything you read here.
Conduct your own due diligence, or consult a licensed financial advisor or broker before making any and all investment decisions. Any investments, trades, speculations, or decisions made on the basis of any information found on this channel, expressed or implied herein, are committed at your own risk, financial or otherwise.

EURUSD is Nearing an Important Support!!Hey Traders, in today's trading session we are monitoring EURUSD for a buying opportunity around 1.15400 zone, EURUSD is trading in an uptrend and currently is in a correction phase is in a correction phase in which it is approaching the trend at 1.15400 support and resistance area.
Trade safe, Joe.

DXY Potential DownsidesHey Traders, in the coming week we are monitoring DXY for a selling opportunity around 99.000 zone, DXY is trading in a downtrend and currently is in a correction phase in which it is approaching the trend at 99.000 support and resistance area.
Trade safe, Joe.
AUDUSD Potential UpsidesHey Traders, in today's trading session we are monitoring AUDUSD for a buying opportunity around 0.64500 zone, AUDUSD is trading in an uptrend and currently is in a correction phase in which it is approaching the trend at 0.64500 support and resistance area.
Trade safe, Joe.

Gold Potential UpsidesHey Traders, in today's trading session we are monitoring XAUUSD for a buying opportunity around 3,336 zone, Gold is trading in an uptrend and currently is in a correction phase in which it is approaching the trend at 3,336 support and resistance area.
Trade safe, Joe.

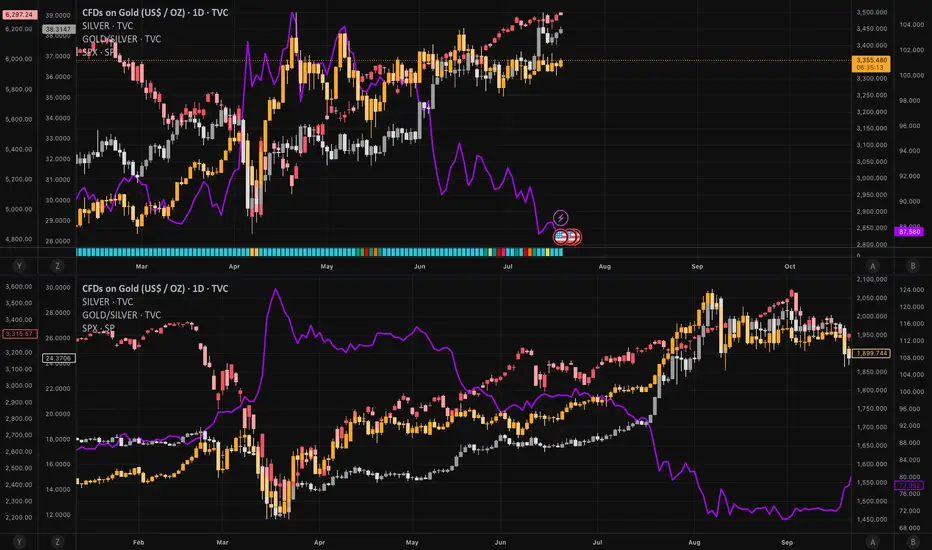
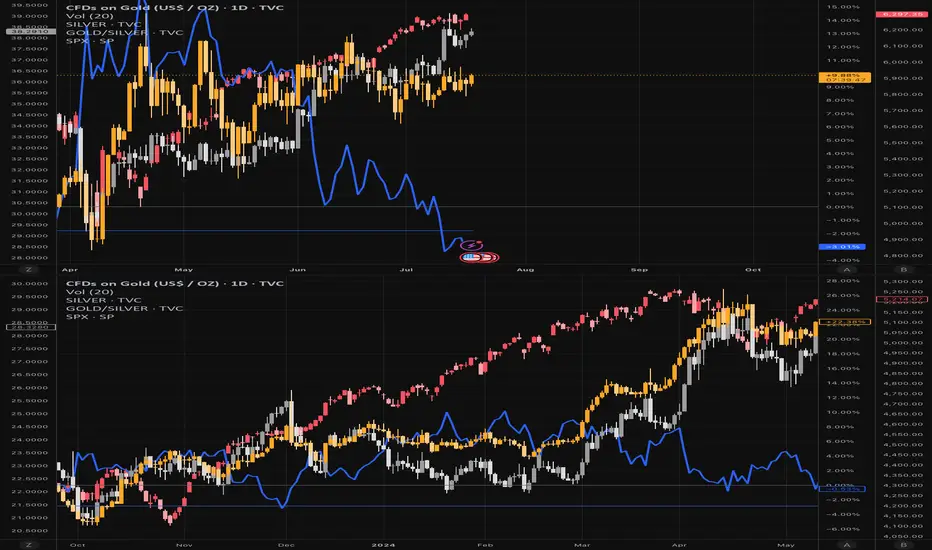
Bear-Trap armed: Gold ticks 4 / 5 boxes - waiting for the spark1️⃣ Why the 2020 déjà-vu is EVEN louder
2025 (now) 2020 (pre-rally)
TradingView ideas still bearish 💬
> 70 % 60 % bearish
Managed-money net-longs ≈ 115 k
-35 % from Apr. –25 % from peak
+ $741 m PM-ETF inflow Record IN-flows
G/S ratio 87 (< 90) Fell to 95
S&P keeps making highs Ditto
2️⃣ What’s still different
Real 10-y TIPS yield +0.7 % vs -1 % in 2020 → smaller monetary tail-wind.
Gold is already at an infl-adj. record – expect a short & sharp squeeze, not a fresh multi-year super-cycle (yet).
3️⃣ Checklist – updated
Signal Status 18 Jul Comment
———————————————————
Gold DAILY close ≥ $3 200–3 250 YES – $3 354 ✔
G/S ratio < 90 YES – 87 ✔
CFTC net-longs < 150 k YES – ~115 k ✔
ETF flows turn positive. YES – $741 m ✔
Equity stress (VIX > 25 or SPX −5 %) NOT YET – VIX 16.5 ✖
4 / 5 boxes = 99 % primed. One spark missing.
4️⃣ What could light the fuse
Date Potential trigger Why it matters
22 Jul Mega-tech Q2 earnings (NVDA/AMD) Any guidance miss → SPX wobble
30 Jul FOMC Fed holds but sounds dovish USD dump + yield spike risk
1 Aug Trump s “reciprocal” duties Imported-inflation scare → VIX pop
Early Aug. DXY crashes < 96 in < 5 days. Disorderly USD slide = funding stress
Hit ≥ 2 of: DXY < 96, VIX > 25, SPX -5 % or HY-spread +75 bp → final ✔.
Bottom line
The bear-trap thesis aged well: sentiment, positioning, ETFs, and G/S ratio have already clicked bullish.
Only equity-market stress is missing. A fast USD slide or a tariff shock right after a neutral Fed is the most likely detonator.
Stay nimble: Collect premium inside $3 250-3 400 while volatility sleeps – but keep alarms on VIX 25 and DXY 96. One red headline could still launch the squeeze.
Disclaimer: Educational opinion, not investment advice. Futures & CFD trading is risky – do your own research and consult a professional.
1 minute ago
Bear-Trap armed: Gold ticks 4 / 5 boxes - waiting for the spark
1️⃣ Why the 2020 déjà-vu is EVEN louder
2025 (now) 2020 (pre-rally)
TradingView ideas still bearish 💬
> 70 % 60 % bearish
Managed-money net-longs ≈ 115 k
(-35 % from Apr) –25 % from peak
+ $741 m PM-ETF inflow, first after months Record IN-flows
G/S ratio 87 (< 90) Fell to 95
S&P keeps making highs. Ditto
2️⃣ What’s still different
Real 10-y TIPS yield +0.7 % vs -1 % in 2020 → smaller monetary tail-wind.
Gold is already at an infl-adj. record – expect a short & sharp squeeze, not a fresh multi-year super-cycle (yet).
3️⃣ Checklist – updated
Signal Status 18 Jul Comment
———————————————————
Gold DAILY close ≥ $3 200–3 250 YES – $3 354 ✔
G/S ratio < 90 YES – 87 ✔
CFTC net-longs < 150 k YES – ~115 k ✔
ETF flows turn positive. YES – $741 m ✔
Equity stress (VIX > 25 or SPX −5 %) NOT YET – VIX 16.5 ✖
4 / 5 boxes = 99 % primed. One spark missing.
4️⃣ What could light the fuse
Date Potential trigger Why it matters
22 Jul Mega-tech Q2 earnings (NVDA/AMD) Any guidance miss → SPX wobble
30 Jul FOMC Fed holds but sounds dovish USD dump + yield spike risk
1 Aug Trump s “reciprocal” duties Imported-inflation scare → VIX pop
Early Aug. DXY crashes < 96 in < 5 days. Disorderly USD slide = funding stress
Hit ≥ 2 of: DXY < 96, VIX > 25, SPX -5 % or HY-spread +75 bp → final ✔.
Bottom line
The bear-trap thesis aged well: sentiment, positioning, ETFs, and G/S ratio have already clicked bullish.
Only equity-market stress is missing. A fast USD slide or a tariff shock right after a neutral Fed is the most likely detonator.
Stay nimble: Collect premium inside $3 250-3 400 while volatility sleeps – but keep alarms on VIX 25 and DXY 96. One red headline could still launch the squeeze.
Disclaimer: Educational opinion, not investment advice. Futures & CFD trading is risky – do your own research and consult a professional.
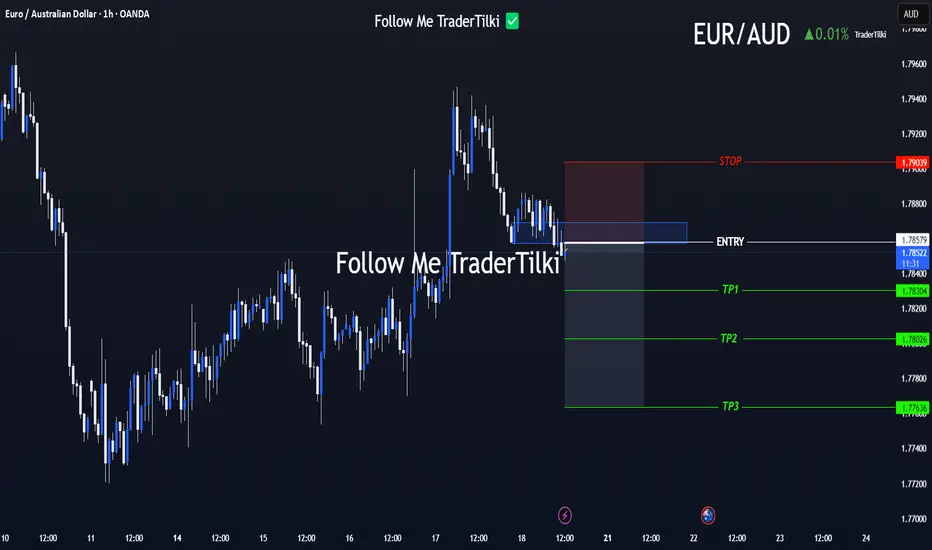
FX Setup of the Day: EURAUD SELL ZONEHey traders 👋
📌 SELL / EURAUD – Technical Breakdown
🟢 Entry: 1.78579
🎯 Target 1: 1.78304
🎯 Target 2: 1.78026
🎯 Target 3: 1.77636
🔴 Stop Loss: 1.79039
📈 Risk/Reward Ratio: 2.00
I’ve carefully validated these levels and crafted a clean, focused analysis for you.
Every like seriously fuels my drive to produce more top-tier content 📈
Your support genuinely means a lot to me.
Thanks from the heart to everyone showing love 💙
🎯 Clear targets, solid strategy.
🤝 Let’s move forward with logic and discipline.
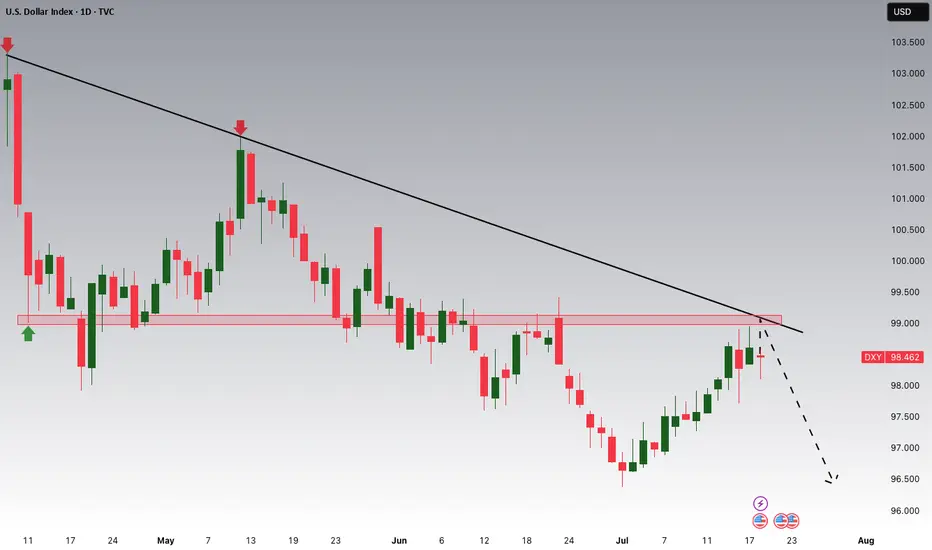
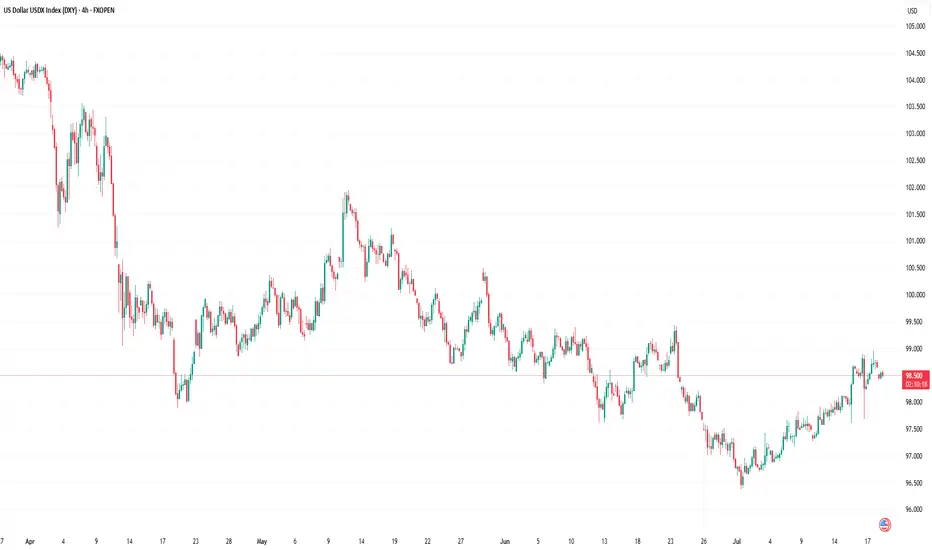
US Dollar Index (DXY) Chart AnalysisUS Dollar Index (DXY) Chart Analysis
The addition of the US Dollar Index (DXY) to FXOpen’s suite of instruments offers traders potential opportunities. This financial instrument:
→ serves as a measure of the overall strength of the US dollar;
→ is not tied to a single currency pair but reflects the value of the USD against a basket of six major global currencies, including the EUR, JPY, and GBP;
→ allows traders to capitalise on price fluctuations in the currency market;
→ is used in more advanced strategies for hedging risks in portfolios sensitive to sharp movements in the US dollar.
In today’s environment of heightened volatility, this instrument becomes particularly valuable. The active stance of US President Donald Trump — through the implementation of trade tariffs, sanctions, and unpredictable geopolitical rhetoric — gives traders even more reason to closely monitor the DXY chart.
Technical Analysis of the DXY Chart
Moving averages show that the US Dollar Index displayed a predominantly bearish trend during the first half of 2025.
However, the picture shifted in July: the index began rising steadily (already up approximately +1.9% since the beginning of the month), highlighted by the blue ascending trend channel.
This suggests that the DXY may have found support following a prolonged decline, and a shift in market sentiment could be underway: after a bearish phase, a period of consolidation may follow. If this scenario plays out, we could see DXY oscillating between the 97.65 and 99.30 levels – both of which show signs of acting as support and resistance (as indicated by the arrows).
This article represents the opinion of the Companies operating under the FXOpen brand only. It is not to be construed as an offer, solicitation, or recommendation with respect to products and services provided by the Companies operating under the FXOpen brand, nor is it to be considered financial advice.
18.07.25 Morning ForecastPairs on Watch -
FX:GBPAUD
FX:EURAUD
FX:EURNZD
FX:EURCAD
A short overview of the instruments I am looking at for today, multi-timeframe analysis down to what I will be looking at for an entry. Enjoy!

USD/JPY - Triangle Pattern (18.07.2025)The USD/JPY pair on the M30 timeframe presents a Potential Buying Opportunity due to a recent Formation of a Triangle Pattern. This suggests a shift in momentum towards the upside and a higher likelihood of further advances in the coming hours.
Possible Long Trade:
Entry: Consider Entering A Long Position around Trendline Of The Pattern.
Target Levels:
1st Resistance – 149.93
2nd Resistance – 150.65
🎁 Please hit the like button and
🎁 Leave a comment to support for My Post !
Your likes and comments are incredibly motivating and will encourage me to share more analysis with you.
Best Regards, KABHI_TA_TRADING
Thank you.
Disclosure: I am part of Trade Nation's Influencer program and receive a monthly fee for using their TradingView charts in my analysis.

Has the DXY got you confused? Well, check out this analysis.Welcome back, traders, it’s Skeptic from Skeptic Lab! 😎 , the DXY has entered a corrective phase over the past weeks. In this analysis, I’ve broken down the technicals and chart with a skeptical eye, outlined long and short triggers on the 4h timeframe , and tried to give you a solid multi-timeframe view of the setup. At the end, I’ve shared a key educational tip that can seriously boost your win rate and R/R , so make sure you check out the full analysis.
💬If you’ve got a specific symbol in mind for analysis, drop it in the comments. Have a profitable Friday, fam <3

Sweep On levels and Confirmation of Bullish pressure! Now that we have a sweep on levels we are looking for bullish pressure to continue. They have closed the 4Hr bullish. Being that it is Friday keeping expectation low cause price can break out and push hard or it can end up being Rotational. I feel there is a move here. We just have to wait for it to line up inside of the killzone. NOFOMO Mayn!
