DeGRAM | DXY growth in the channelThe DXY is in an ascending channel between the trend lines.
The price is moving from the lower boundary of the channel and dynamic support, which has already acted as a rebound point twice.
The chart has formed a harmonic pattern.
The index will continue to grow after consolidation above the 62% retracement level.
-------------------
Share your opinion in the comments and support the idea with like. Thanks for your support!
Dxyanalysis

ABC Correction perfection A Beautiful ABC pattern
Lines up perfectly with :
- Previous range Point Of Control
- Previous month Value Area Low
- A Daily Naked
- The 1 to 1
- Global Swing Low Avwap
Elliot wave theory
I expect early next week being hit. Then target the highs for a wyckoff distribution pattern.
People are already positioning EU swing longs, without a spring.
We need to punish dem early bulls 🏌️♀️
CAPITALCOM:DXY OANDA:EURUSD CME:6E1! ICEUS:DX1!

#DXY 1DAYDXY (1D Timeframe) Analysis
Market Structure:
The price has broken below the uptrend support, signaling a potential shift from bullish to bearish momentum. This breakdown indicates that buyers were unable to sustain the upward trend, leading to increased selling pressure. Additionally, a sell engulfing candlestick has formed, further confirming bearish sentiment.
Forecast:
A sell opportunity is expected as the breakdown of uptrend support and the sell engulfing pattern suggest further downside movement.
Key Levels to Watch:
- Entry Zone: After a confirmed breakdown and possible retest of the broken support as resistance.
- Risk Management:
- Stop Loss: Placed above the broken support or recent swing high.
- Take Profit: Target lower support zones for potential downside movement.
Market Sentiment:
The combination of the uptrend support breakdown and a sell engulfing pattern indicates that bearish momentum is increasing. Waiting for confirmation of continued selling pressure will help align with the prevailing market trend.


DXY Weekly BiasMy bias for this index is bearish considering that we retested and confirmed the Weekly Bearish Order Block at 109.65.
I do anticipate that the index might be attracted towards Sellside Liquidity at 107.27, 106.95 ,and 105.4.
Our daily setup will further give us the best entry and stop loss.

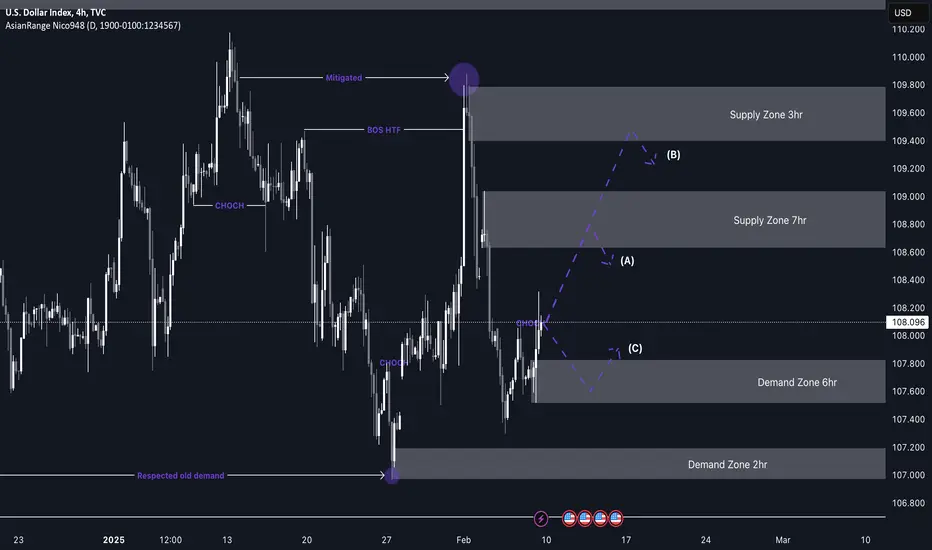
DXY (Dollar index) short from 108.800My DXY analysis aligns with the expectation of a bearish move, which suggests that my pairs—EU and GU—could push higher. However, before that, we may see a minor pullback as price moves toward a demand zone.
Price has recently broken structure to the upside, leaving behind a fresh demand level. Once price reaches this area, I anticipate accumulation before a potential move upward. I will look for opportunities to capitalize on this movement across the pairs I trade, such as Gold, EU, and GU.
The price action has been very clean so far, which is promising, and we can expect more of the same as we move further into Q1.
Have a great week ahead and remain vigilant!

Surging Dollar Spurs Jump in Corporate FX HedgingThe relentless rise of the U.S. dollar is sending ripples of concern through the global economy, and businesses are taking notice. Faced with a strengthening greenback, corporations are increasingly turning to foreign exchange (FX) hedging strategies to mitigate the impact of currency fluctuations on their bottom lines. This surge in hedging activity reflects a growing awareness of the risks associated with currency volatility and a proactive approach to protecting profits in an increasingly uncertain global landscape.
The Dollar's Dominance
The U.S. dollar has been on a tear, appreciating significantly against a basket of other major currencies. This surge is driven by a confluence of factors, including the Federal Reserve's hawkish monetary policy, safe-haven demand amid geopolitical tensions, and the relative strength of the U.S. economy. While a strong dollar can have some benefits, such as lower import costs, it also poses significant challenges for multinational corporations.1
Impact on Corporate Earnings
For companies that generate revenue in foreign currencies but report earnings in U.S. dollars, a strong dollar can create a significant headwind. When foreign revenues are converted back into dollars, they are worth less than they were before the dollar's appreciation. This can lead to lower reported earnings, even if the company's underlying business performance remains strong. Conversely, companies that import goods priced in dollars but sell them in other currencies see their profit margins squeezed as their input costs rise.
The Hedging Imperative
In this environment of heightened currency risk, FX hedging has become a crucial tool for corporations.2 Hedging involves using financial instruments, such as forward contracts, options, or swaps, to lock in exchange rates for future transactions.3 This allows companies to insulate themselves from adverse currency movements and provides greater certainty about their future cash flows and earnings.4
Surge in Hedging Activity
Market data suggests a significant uptick in corporate FX hedging activity. Treasurers and finance departments are increasingly prioritizing currency risk management, recognizing that even small fluctuations in exchange rates can have a material impact on their financial results. This increased focus on hedging is driven by several factors:
• Heightened Volatility: The dollar's rapid appreciation has created significant volatility in currency markets, making it more difficult for companies to predict future exchange rates. This uncertainty underscores the need for hedging strategies to protect against unexpected currency swings.
• Earnings Protection: As mentioned earlier, a strong dollar can erode corporate earnings. Hedging allows companies to mitigate this risk and ensure that their financial performance is not unduly impacted by currency fluctuations.5
• Strategic Planning: Hedging provides greater predictability in cash flows, which is essential for strategic planning and investment decisions.6 By locking in exchange rates, companies can make more informed decisions about future investments and expansion plans.7
• Shareholder Expectations: Investors are increasingly scrutinizing companies' currency risk management practices. Companies that proactively hedge against currency risks are often seen as more prudent and better managed, which can be a positive factor for investor confidence.
Types of Hedging Strategies
Companies employ a variety of hedging strategies depending on their specific needs and risk tolerance.8 Some common approaches include:
• Forward Contracts: These contracts obligate a company to buy or sell a specific amount of currency at a predetermined exchange rate on a future date.9 This is a straightforward way to lock in exchange rates for future transactions.
• Options: Currency options give a company the right, but not the obligation, to buy or sell currency at a specific price on or before a certain date.10 Options provide flexibility and allow companies to benefit from favorable currency movements while limiting their downside risk.11
• Currency Swaps: These agreements involve exchanging principal and/or interest payments in one currency for those in another currency.12 Swaps can be used to manage currency risk associated with long-term debt or investments.13
Challenges and Considerations
While hedging can be an effective way to manage currency risk, it's not without its challenges. Hedging strategies can be complex and require specialized expertise. Furthermore, hedging involves costs, such as premiums paid for options or fees for forward contracts.14 Companies need to carefully weigh the costs and benefits of hedging and choose strategies that are appropriate for their specific circumstances.
Looking Ahead
The strong dollar is likely to remain a significant factor in the global economy for the foreseeable future. As such, corporate FX hedging is expected to remain a priority for multinational companies. Companies that proactively manage their currency risk are better positioned to navigate the challenges of a strong dollar environment and protect their earnings from adverse currency movements.15 The current surge in hedging activity reflects a growing recognition of this reality and a proactive approach to mitigating currency risk in an increasingly interconnected world. As global economic conditions evolve, companies will need to remain vigilant and adapt their hedging strategies accordingly to ensure they are adequately protected from currency volatility.

DeGRAM | DXY downturn in the channelThe DXY is in an ascending channel between the trend lines.
The price is moving from the dynamic resistance, which previously acted as a pullback point.
The chart has formed a harmonic pattern.
We expect the continuation of the decline in the channel.
-------------------
Share your opinion in the comments and support the idea with like. Thanks for your support!

DXY US Dollar Index Market Bearish Heist Plan🌟Hi! Hola! Ola! Bonjour! Hallo!🌟
Dear Money Makers & Robbers, 🤑 💰🐱👤
Based on 🔥Thief Trading style technical and fundamental analysis🔥, here is our master plan to heist the DXY US Dollar Index Market. Please adhere to the strategy I've outlined in the chart, which emphasizes short entry. Our aim is the high-risk Green Zone. Risky level, oversold market, consolidation, trend reversal, trap at the level where traders and bullish robbers are stronger. 🏆💸Be wealthy and safe trade.💪🏆🎉
Entry 📈 : "The vault is wide open! Swipe the Bullish loot at any price - the heist is on!
however I advise placing Sell limit orders within a 15 or 30 minute timeframe. Entry from the most recent or closest high or low level should be in retest.
Stop Loss 🛑: Thief SL placed at 108.500 (swing Trade) Using the 2H period, the recent / nearest low or high level.
SL is based on your risk of the trade, lot size and how many multiple orders you have to take.
Target 🎯: 106.000 (or) Escape Before the Target
Scalpers, take note 👀 : only scalp on the Short side. If you have a lot of money, you can go straight away; if not, you can join swing traders and carry out the robbery plan. Use trailing SL to safeguard your money 💰.
📰🗞️Fundamental, Macro, COT, Sentimental Outlook:
DXY US Dollar Index Market is currently experiencing a Bearish trend., driven by several key factors.
🟦Fundamental Analysis:
- The US Dollar Index (DXY) has been under pressure due to the contraction in JOLTS job openings, indicating a tightening job market
- The Federal Reserve's monetary policies, geopolitical stability, and global acceptance of the dollar as a reserve currency contribute to the dollar's strength
- A strong economy with high productivity, low unemployment, and stable inflation provides a foundation for strengthening the dollar's position
🟫Macro Analysis:
- The US economy is expected to remain strong, with low unemployment and stable inflation, supporting the dollar's value
- Global trade tensions and geopolitical instability may impact the dollar's value, but its status as a reserve currency provides stability
- Interest rate decisions by the Federal Reserve will influence the dollar's value, with potential rate cuts impacting its strength
🟪Sentimental Analysis:
- 60% of client accounts on IG are long on the US Dollar Index, indicating a bullish sentiment
- However, the recent contraction in JOLTS job openings and potential Fed rate cuts may lead to a bearish sentiment
🟧COT Analysis:
- The latest Commitment of Traders (COT) report shows that speculators are net long on the US Dollar Index, indicating a bullish sentiment
- However, the report also shows that commercial traders are net short, indicating a potential bearish sentiment
🟨Positioning:
- Corporate traders may consider hedging their exposure to the US Dollar Index due to potential volatility
- Investor and hedge fund traders may consider going long on the US Dollar Index due to its potential strength, but should be cautious of potential rate cuts and geopolitical instability
- Institutional traders may consider diversifying their portfolios to minimize exposure to the US Dollar Index
- Retail traders should exercise caution when trading the US Dollar Index due to its potential volatility and should consider using proper risk management strategies
⚠️Trading Alert : News Releases and Position Management 📰 🗞️ 🚫🚏
As a reminder, news releases can have a significant impact on market prices and volatility. To minimize potential losses and protect your running positions,
we recommend the following:
Avoid taking new trades during news releases
Use trailing stop-loss orders to protect your running positions and lock in profits
📌Please note that this is a general analysis and not personalized investment advice. It's essential to consider your own risk tolerance and market analysis before making any investment decisions.
📌Keep in mind that these factors can change rapidly, and it's essential to stay up-to-date with market developments and adjust your analysis accordingly.
💖Supporting our robbery plan will enable us to effortlessly make and steal money 💰💵 Tell your friends, Colleagues and family to follow, like, and share. Boost the strength of our robbery team. Every day in this market make money with ease by using the Thief Trading Style.🏆💪🤝❤️🎉🚀
I'll see you soon with another heist plan, so stay tuned 🤑🐱👤🤗🤩

DXY - "Pullback or Breakdown? Key Levels to Watch!"📉 Price Action Update: Key Levels to Watch
Currently, the price is trading within the 108 – 107.800 range. There are two potential scenarios to anticipate:
1️⃣ If the price continues to decline, we could see a drop toward 106.950.
2️⃣ Alternatively, a pullback from 108 could push the price toward 108.500 – 108.700 before resuming its downside move.
This analysis is based on DXY's price action on February 3rd, where it faced monthly timeframe resistance. Such a significant resistance level often leads to a short-term downtrend, especially on lower timeframes like the 1-hour chart.
📊 Stay alert to price reactions at these key levels! 🚀

DeGRAM | DXY dollar strengthened againThe DXY is in an ascending channel between trend lines.
The price has already reached the upper boundary of the channel and the dynamic resistance, which previously acted as a pullback point.
During the growth in the channel, the chart formed a gap.
We expect a pullback.
-------------------
Share your opinion in the comments and support the idea with like. Thanks for your support!

DXY Analysis & ConsiderationsOverall Trend & Context:
Long-Term Uptrend: The DXY exhibits a clear uptrend from late 2023, indicating persistent USD strength.
Key Levels:
Resistance Zone (109.50 - 110.00): This zone has proven a challenge for the DXY to break decisively. A sustained break above this level is crucial for further upside.
Support Zone (107.00 - 108.00): This zone has provided support during pullbacks.
EMAs (25, 50, 100, 200 - 4-Hour Chart): The DXY is trading above all EMAs, a bullish sign. The 25 EMA is acting as dynamic support, and a bullish crossover (25 above 50) has occurred.
Potential Scenarios & Probabilities:
Bullish Breakout (High Probability) : The bullish EMA alignment favor an upside breakout above 110.00. Increased volume would confirm this scenario.
Pullback to Support/EMAs (Medium Probability) : A pullback towards the support line or the 25 EMA (around 108.80 - 109.00) is plausible, especially given the overbought RSI. This could offer a good long entry opportunity.
Breakdown Below Support (Low - Medium Probability) : A break below the support line and the EMAs would weaken the bullish outlook and could lead to a deeper correction.
Trading Considerations:
xxxUSD pairs - If the dollar goes up we should look for short positions.
USDxxx pairs - If Dollar goes up we can look for long positions.
A pullback to the support zones or the 25 EMA could offer a lower-risk long entry, provided these levels hold and there is sufficient demand on the USDxxx pair you're trading. (technicals should always be prioritized)
Consider placing stop-loss orders below key support/demand levels to manage risk.
Look for increased volume during breakouts or bounces off support to strengthen signals.
Watch for bearish divergence on the RSI as a potential bearish warning sign on the DXY.
Geopolitical Factors:
De-dollarization Efforts: Some countries are exploring alternatives to the US dollar for trade and reserves. While this is a long-term trend, any significant announcements or actions could impact the dollar's value.
Sanctions and Trade Policies: US sanctions and trade policies can influence the dollar's strength, particularly against the currencies of targeted countries. The US imposed tariffs are creating ripples right now.
Let's quickly look at what 'tariffs' are -
By now you should all know about the US imposed tariffs on several major trading partners including China, Canada and Mexico (and that they've retaliated with their own tariffs on US goods).
What does this all mean?
In the US any goods that are imported from Canada for example, will now cost more to the general public. To put it simply, the US is now charging a "handlers fee" and that will increase the overall price.
These tariffs are intended to encourage these countries to change their trade practices.
The tariffs have disrupted global supply chains, increased costs for businesses, and created uncertainty.
Make no mistake, this is without a doubt, a trade war.
Potential Impacts on the US Dollar:
Positive Impact:
Safe-haven demand: Increased global economic uncertainty due to the trade war could drive investors towards the US dollar as a safe-haven asset, increasing demand and its value. People will flock to the take no s#it protocols implemented by the Trump administration.
Reduced imports: If tariffs lead to a significant decrease in US imports, there could be less demand for foreign currencies to purchase those imports, indirectly increasing demand for USD. This means that trade conducted by the US will increase the overall Dollar output - thus making it seem more valuable. (If we assume the Trump administration is playing petty games, we're badly misinformed, we should assume that these are well calculated risks)
Negative Impact:
Reduced US exports: Tariffs can make US goods less competitive, leading to a decrease in exports. This can reduce foreign demand for USD, as fewer foreign buyers need dollars to purchase US goods.
Economic slowdown: The trade war could negatively impact economic growth in the US and globally. A slowdown in the US economy could make the dollar less attractive to investors.
Retaliatory tariffs: If other countries retaliate with their own tariffs on US goods, it can further dampen US exports and reduce demand for the dollar.
Trade Wars and Uncertainty:
The uncertainty and potential for escalation associated with trade wars can negatively impact investor confidence and lead to a flight to safety. While the USD is often seen as a safe haven, extreme uncertainty could lead investors to seek other safe-haven assets or reduce their overall exposure to USD (Right now Gold is something you should be looking into as a trader and investor).
Final Notes:
The technical picture is strong and does favour a breakout. But the geopolitical risks reduce the probability. Be prepared for fundamentals to override technicals in the short term.
Given the heightened risks, traders should be cautious and wait for clear confirmation signals before taking positions.
Closely follow news related to the debt ceiling, economic data, and geopolitical events.
Disclaimer: This analysis is for informational purposes only and does not constitute financial advice. Trading involves substantial risk and may not be suitable for all investors. Conduct your own research and consult with a financial advisor before making any investment decisions.

DXY Dive Incoming? Watch the Liquidity Zones!From the higher timeframe perspective, DXY is currently hovering within a key monthly Fair Value Gap (FVG), marked in red. This zone serves as a critical point of interest and could dictate the next directional bias for the dollar.
Key Observations:
Current FVG Zone:
-Price is consolidating within the monthly FVG. A close below this zone would provide stronger confirmation of a bearish move targeting lower liquidity levels.
Bearish Bias:
-The recent price action indicates weakness as sellside liquidity (SSL) is beginning to show signs of attraction.
-The presence of significant sellside liquidity targets below, including:
-105.411 (Weekly SSL - Sweep)
-103.370 (Weekly SSL - Next Zone)
-100.215 (Major Daily SSL Zone)
Messy Market Conditions:
-Due to fluctuating macroeconomic factors, including USD news events, we may observe temporary rallies or retracements. However, these are likely to form lower highs before continuing the descent.
Confirmation Levels:
-Bearish Confirmation: A daily or weekly close below the monthly FVG would solidify the bearish case, signaling that sellside liquidity at 105.411 and lower levels are likely next.
-Bullish Risk: If the current FVG holds as support and price pushes higher, we could see an attempt to retest higher zones (e.g., 109.535) before resuming downside momentum.
Conclusion:
The expectation is for DXY to drop towards sellside liquidity levels at 105.411, 103.370, and potentially as low as 100.215. However, traders should await a clean confirmation (such as a close below the monthly FVG) to validate the move.
DYOR (Do Your Own Research) and trade safely amidst potential market volatility!
Let me know if you'd like any refinements!


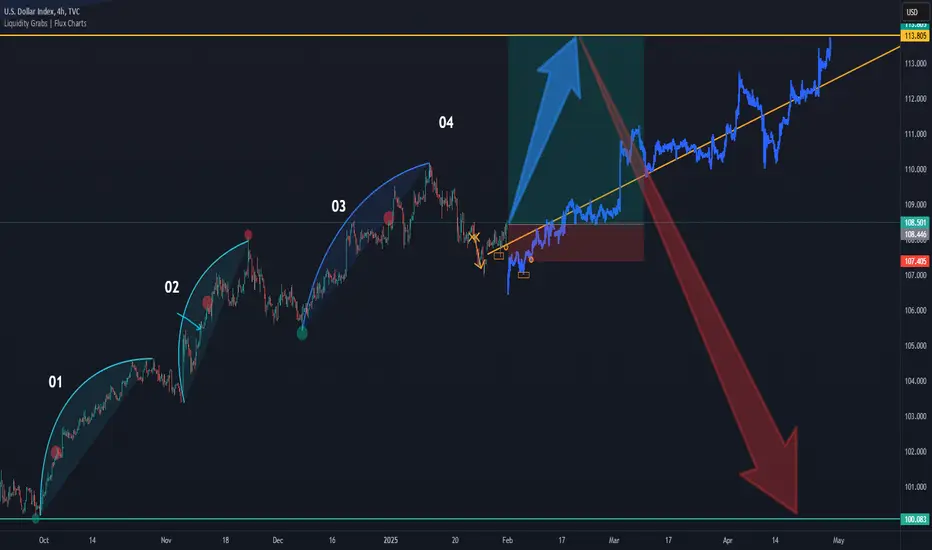
US DOLLAR INDEX : DXY READY TO FLY !! great opportunity !- The US Dollar Index (DXY) is showing strong signs of bullish momentum as it bounces off key support levels and begins to break through short-term resistance.
- I draw a bars pattern to show you exactly how DXY will balance next weeks.
The strategie that i used is very unique, just follow bars pattern up and down.
- Fundamental Drivers: Positive US economic data and expectations of potential Fed rate hikes support the bullish outlook for the USD, adding confidence to the trade.
- This setup offers a great opportunity to catch the next leg of the US Dollar’s potential rally. Happy trading! 📈
$DXY MMBMIn the 4H timeframe, we can clearly see the MMBM holding. We moved from the selling side of the curve to the buying side, where we can identify liquidity purges and the continuation of the movement.

$DXY MMBMReinforcing our weekly view, the daily chart showed the formation of an SMT relative to the EU within the weekly key level, which strengthens the signs of a bullish move seeking low-resistance liquidity at the tops.

$DXY MMBMThe price respected the weekly FVG, forming a swing at a key level. We anticipate the third candle distribution and expect next week to be a classic buy week

DXY ideaWe are waiting for our asset to reach our action zone, and based on the reaction, we’ll decide on our next moves.ALWAYS WAIT FOR A CONFIRMATION TO SEE IF THE PRICE VALIDATES THE ZONE.and you what is your vision of the EURUSD its interests me! i wait you in the commentary

DXY Dollar Index Market Bearish Heist Plan 🌟Hi! Hola! Ola! Bonjour! Hallo!🌟
Dear Money Makers & Robbers, 🤑 💰
Based on 🔥Thief Trading style technical and fundamental analysis🔥, here is our master plan to heist the XAU/USD "GOLD vs US Dollar" Metal market. Please adhere to the strategy I've outlined in the chart, which emphasizes short entry. Our aim is the high-risk Green Zone. Risky level, oversold market, consolidation, trend reversal, trap at the level where traders and bullish robbers are stronger. 👀 Be wealthy and safe trade.💪🏆🎉
Entry 📉 : Traders & Thieves with New Entry A Bear trade can be initiated at any price level.
however I advise placing sell limit orders within a 15 or 30 minute timeframe. Entry from the most recent or closest high level should be in retest.
Stop Loss 🛑: Using the 4h period, the recent / nearest high level
Goal 🎯: 105.800 (or) Before escape in the market
Scalpers, take note : only scalp on the Short side. If you have a lot of money, you can go straight away; if not, you can join swing traders and carry out the robbery plan. Use trailing SL to safeguard your money 💰.
📰🗞️Fundamental, Macro, Sentimental Outlook
The DXY (Dollar Index) market is expected to move in a bearish direction, driven by several key factors.
🔴Fundamental Analysis
The DXY is a geometrically weighted index that tracks the value of the US dollar against a basket of six major currencies: the euro (57.6%), Japanese yen (13.6%), British pound (11.9%), Canadian dollar (9.1%), Swedish krona (4.2%), and Swiss franc (3.6%). The index is influenced by interest rates, inflation, and economic indicators such as GDP and employment rates.
🟠Macro Analysis
The US Federal Reserve's monetary policy decisions significantly impact the DXY. With the Fed's rate hike cycle, the US dollar has strengthened against other major currencies. However, the recent decline in US Treasury yields has put pressure on the dollar.
🟡Market Sentiment
The market sentiment for the DXY is currently bearish, with 71% of IG client accounts short on this market. However, some analysts believe that the dollar's decline has been overdone and expect a rebound.
🟢Retail Traders' Sentiments
Retail traders' sentiments are mixed, with some expecting a bullish move and others predicting a bearish trend. On TradingView, some analysts have identified a potential bearish pattern, while others see a bullish reversal.
🔵Upcoming Events
The upcoming events that may impact the DXY include:
Federal Reserve Meeting: The Fed's interest rate decision and monetary policy statement may influence the dollar's value.
US GDP and Inflation Data: The release of US GDP and inflation data may impact the dollar's strength.
Trade Developments: Any updates on US trade policies, particularly with China, may affect the dollar's value.
🟣Trading Expectations
Based on the analysis, it's challenging to predict a clear direction for the DXY. However, considering the bearish market sentiment and potential bearish patterns, a neutral to bearish move is possible in the short term. Keep a close eye on upcoming events and market developments to adjust your trading strategy accordingly.
⚠️Trading Alert : News Releases and Position Management 📰 🗞️ 🚫🚏
As a reminder, news releases can have a significant impact on market prices and volatility. To minimize potential losses and protect your running positions,
we recommend the following:
Avoid taking new trades during news releases
Use trailing stop-loss orders to protect your running positions and lock in profits
🚨Please note that this is a general analysis and not personalized investment advice. It's essential to consider your own risk tolerance and market analysis before making any investment decisions.
🚨Keep in mind that these factors can change rapidly, and it's essential to stay up-to-date with market developments and adjust your analysis accordingly.
💖Supporting our robbery plan will enable us to effortlessly make and steal money 💰💵 Tell your friends, Colleagues and family to follow, like, and share. Boost the strength of our robbery team. Every day in this market make money with ease by using the Thief Trading Style.🏆💪🤝❤️🎉🚀
I'll see you soon with another heist plan, so stay tuned 🫂

XAUUSD - Gold Enters the Last Week of January!On the 4-hour timeframe, gold is above the EMA200 and EMA50 and is in its ascending channel. If gold rises to the previous ATH, we can look for selling positions at the ceiling indicated by the target of the midline of the ascending channel. A correction of gold towards the demand zone will provide us with its next buying position.
Last week, the gold market showcased one of its most stable and impressive performances in recent months, seemingly adapting to the shocks and uncertainties introduced by the newly established U.S. administration.
Darin Newsom, Senior Market Analyst at Barchart.com, highlighted that given global markets’ reaction to the unpredictability of the new U.S. president, there appear to be few barriers to new record highs for gold. He stated, “At this point, we can set aside technical and fundamental analysis. Gold is acting as a safe haven against the chaos stemming from the new U.S. government. No one knows what the next statement or action will be.”
According to the latest U.S. Purchasing Managers’ Index (PMI) report released by S&P Global, the services sector index dropped to 52.8, marking its lowest level since April of last year and falling below market expectations of 56.5. Meanwhile, the manufacturing PMI rose to 50.1, exceeding the forecasted 49.7. The composite PMI also decreased to 52.4.
Although confidence in the services sector has declined from its 18-month peak in December, it remains the second-highest level recorded in the past year.Additionally, the services sector experienced the fastest rate of job creation in 30 months. Input costs and selling prices across sectors also rose at the fastest pace in four months.
Chris Williamson, Chief Economist at S&P Global, commented on the data, stating that U.S. businesses began 2025 with optimism about the new administration’s policies. In particular, growth expectations in the manufacturing sector have increased due to anticipated government support. He also noted that while GDP growth slowed slightly in January, sustained business confidence suggests this slowdown may be temporary. The rise in hiring rates, driven by improved business outlooks, is another encouraging sign.
However, Williamson warned about increasing inflationary pressures. Companies reported that rising supplier costs and higher wages, driven by labor shortages, have led to price increases. If this trend continues, concerns about inflation could intensify, prompting the Federal Reserve to adopt more hawkish policies.
Rich Checkan, President and COO of Asset Strategies International, predicted that gold might experience a price correction in the short term. He explained, “While the long-term trend for gold remains bullish, thanks to the mismanagement of fiat currencies, I anticipate a price correction this week. Gold has approached historical highs today, but uncertainties surrounding the upcoming Federal Open Market Committee (FOMC) meeting could prompt investors to take profits, leading to a temporary price pullback.”
This week, officials from major central banks worldwide will convene to make critical decisions. These meetings come as discussions about President Trump’s tariff threats resurface. The Federal Reserve, the European Central Bank (ECB), and the Bank of Canada (BoC) are all scheduled to hold their monetary policy meetings this week.

