DXY DOLLAR INDEX : My vision hello guys not gonna lie i was bearish on dxy last quarter my first target was hit but suddenly price showed signs of bullishness i see price going up for previous year high.
Dxyanalysis

DeGRAM | DXY broke through the channel boundaryThe DXY is under an ascending channel between the trend lines.
The chart has already reached the dynamic resistance level and has now broken down the channel boundary.
We expect a decline after consolidation under the trend line.
-------------------
Share your opinion in the comments and support the idea with like. Thanks for your support!

Dxy downgradeDxy trending down, xxxusd going up usdxxx going down, bullish trend at DXY penetrative and crossing bullish resistance,
DYOR always, n keep ur trade safe

DXY reached the critical resistance zone. H4 15.11.2024 DXY reached the critical resistance zone 📉
Honestly, I didn't think they would push the dollar index to the final zone near 107
without a pullback, but they still did. Now they gave a clear reaction downwards
and it is very possible that the correction has started. Of course, we cannot deny
the possibility of retesting the highs and then continuing the fall, but in general,
the first signs of reversal and culmination have already appeared. It is very desirable
to close the week below 106.30 and then the idea of a false
breakdown of the 2-year highs will be confirmed.
TVC:DXY

Dollar's Rise, Gold's Demise◉ Abstract
The US Dollar Index (DXY) and gold prices have a historically inverse correlation, with a stronger dollar typically reducing gold demand. Key drivers of this relationship include inflation, geopolitical tensions, and interest rates. With a 73-95% negative correlation observed over time, investors should note the current market outlook: the DXY is poised to break out above 107, potentially surging to 114, while gold prices may drop 5% to 2,400 and then 2,300. Understanding this dynamic is crucial for making informed investment decisions and capitalizing on potential trading opportunities.
◉ Introduction
The relationship between the U.S. Dollar Index (DXY) and gold prices is significant and typically characterized by an inverse correlation. Understanding this relationship is crucial for investors and traders in the gold market.
◉ U.S. Dollar Index Overview
The U.S. Dollar Index measures the value of the U.S. dollar against a basket of six major foreign currencies, including the euro, Japanese yen, and British pound. It serves as an indicator of the dollar's strength or weakness in global markets. When the index rises, it indicates that the dollar is gaining value relative to these currencies, while a decline suggests a weakening dollar.
◉ Inverse Relationship with Gold Prices
Gold is priced in U.S. dollars on international markets, which directly influences its price based on fluctuations in the dollar's value:
● Strengthening Dollar: When the DXY index increases, it generally leads to a decrease in gold prices. This occurs because a stronger dollar makes gold more expensive for investors using other currencies, thereby reducing demand.
● Weakening Dollar: Conversely, when the DXY index falls, gold prices tend to rise. A weaker dollar makes gold cheaper for foreign investors, increasing its demand and driving up prices.
Research indicates that this inverse relationship has been consistent over time, particularly in long-term trends. For instance, historical data shows that gold prices often rise when the dollar depreciates, reflecting a negative correlation of approximately 73% to 95% over various time intervals.
◉ Short-Term Deviations
While the long-term trend supports this inverse relationship, short-term anomalies can occur under specific market conditions. For example, during periods of extreme volatility or economic uncertainty, gold and the dollar may exhibit a positive correlation temporarily as both assets are sought after as safe havens. This behaviour can confuse investors who expect the typical inverse relationship to hold.
◉ Additional Influencing Factors
Several other factors also affect gold prices beyond the dollar's strength:
● Inflation: Rising inflation often leads investors to flock to gold as a hedge against currency devaluation.
➖ E.g. In 2022, as inflation rates surged to 9.1%, demand for gold increased by 12% year-over-year, pushing prices higher. Historical data shows that during periods of high inflation from 1974 to 2008, gold prices rose by an average of 14.9% annually.
● Geopolitical Events: Uncertainty from geopolitical tensions can drive demand for gold regardless of dollar fluctuations.
➖ E.g. In late 2023, escalating conflicts such as the Israel-Palestine situation and the ongoing Russia-Ukraine war contributed to a surge in gold prices, with reports indicating increases of over 3% in a week due to these tensions
● Interest Rates: When the Fed raises interest rates, it typically strengthens the dollar as higher yields attract foreign capital. A stronger dollar makes gold more expensive for holders of other currencies, which can reduce demand.
➖ E.g. During the Federal Reserve's rate hikes from March 2022 to early 2023, many investors moved away from gold as they sought higher returns from bonds and other fixed-income securities. This shift contributed to downward pressure on gold prices during that period.
◉ Technical Standings
● U.S. Dollar Index TVC:DXY
The US Dollar Index has been stuck in neutral for two years. But if it clears the 107 hurdle, get ready for a surge to 114.
● Gold Spot/USD OANDA:XAUUSD
➖ Gold prices skyrocketed to 2,790, then plunged. Expect a 5% drop to 2,400. If that support cracks, 2,300 is the next safety net.

Yen VS Dollar; Trade with cautionGlobal financial markets are bracing for a possible Fed rate cut. Accordingly, forex markets have priced in the anticipated rate cut. September CPI data indicated US inflation is on course towards 2%; seems like the prevailing interest rates are working.
Blackrock thinks the Fed will be cautious with a 25-bps rate cut as opposed to a 50-bps rate cut. There is also the remote possibility that the Fed will be cautious and maintain the rates. Ostensibly, it seems the markets have aggressively priced in a rate cut that has seen the dollar weaken against major currencies.
Looking at cross Yen pairs, bearish momentum is dominant in Q3 OF 2024. However, we have seen price imbalance and price inefficiency across all Yen pairs that must be corrected. For this imbalance to be corrected, we require the US Dollar to rise. All factors held constant, retaining rates or cutting rates lesser than expected will spook the markets and we could see the dollar strengthen against the Yen and other major global currencies.
Turning to the US Dollar index, we see a potential for further weakening before the index rises targeting 105 to 110 price levels.

The Impact of Emerging Markets on the Dollar amidst Looming TradThe recent shift in US political landscape has ignited a wave of uncertainty across global markets. A potential escalation of trade tensions with China and other key economies could have far-reaching consequences, particularly for the US dollar and emerging market currencies.
The Dollar's Uncertain Future
The US dollar, long considered a safe-haven asset, faces a crossroads. While a more protectionist stance could initially bolster the dollar's appeal, it could also trigger a chain reaction of economic consequences. Increased tariffs and trade barriers could lead to higher inflation, which could erode the dollar's purchasing power. Moreover, if the US economy weakens as a result of trade disputes, the dollar's demand as a safe-haven currency could diminish.
Emerging Markets in the Crossfire
Emerging market economies, which have often relied on exports to fuel their growth, are particularly vulnerable to escalating trade tensions. A trade war could disrupt global supply chains, increase the cost of imported goods, and reduce demand for emerging market exports. This could lead to currency devaluation, higher inflation, and slower economic growth.
Currency Pegs Under Pressure
Countries that peg their currencies to the US dollar, such as Hong Kong and some Middle Eastern nations, could face significant challenges. If the dollar weakens or strengthens significantly, it could put pressure on these currency pegs, forcing central banks to intervene to maintain the exchange rate. This could deplete foreign exchange reserves and limit monetary policy flexibility.
The Renminbi's Rising Influence
China's renminbi could emerge as a potential beneficiary of a weakened US dollar. As China continues to expand its economic influence and promote the internationalization of its currency, it could become a more attractive alternative to the dollar for global trade and investment. However, a trade war with the US could also negatively impact the renminbi, as it could lead to reduced demand for Chinese exports and capital flight.
Navigating the Uncharted Waters
To mitigate the risks associated with a potential trade war, emerging market economies may need to adopt a combination of strategies. These could include diversifying export markets, promoting domestic consumption, and strengthening financial institutions. Additionally, central banks may need to adjust monetary policy to stabilize currencies and manage inflation.
In conclusion, the potential for increased trade tensions between the US and China could have significant implications for the global economy, the US dollar, and emerging market currencies. While the full impact of these developments remains uncertain, it is clear that businesses, investors, and policymakers around the world will need to closely monitor the situation and adapt their strategies accordingly.

DXY, Is correction on the way ?Hello Traders, Hope you are doing great.
for upcoming days and for a short period of time, we'll probably see a downward correction to Specified level in TVC:DXY , we also have a Divergence on 4H that confirms our theory.
so with a proper trigger we can open a short position. We will also probably find better buy positions in FX:GBPUSD And FX:AUDUSD than the FX:EURUSD .
Trade safe and have a great weekend.
And finally tell me what do you think ? UP or DOWN ? leave your comment below this post.
If this post was helpful to you, please like it and share it with your friend.
THANKS.

DXY is facing resistance zoneAs you know, I’ve been bullish on the DXY and have anticipated a reversal since the now-confirmed bottom just above 100.
With the price now above 106, however, I believe USD bulls should start exercising caution. There’s a very strong resistance zone ahead, ranging from 106.20 to 106.50, with another important level just above 107.
In my view, a correction is likely soon, and I’ll be watching for buying opportunities in EUR/USD and GBP/USD.

DXY Update and Levelsafter good impulse move to the upside there is certainty of price going into pullback mode
because
. price recently broken the trend line which was from weekly side so the next liquidity zone is supply from monthly which is 1% away and on other hand price can try to retest the fvg which nearby 0.5% below the current price (105.998) or the round figure 105 can act as support
my take - before going to 107 zone price should retrace and get some liquidity from fvg

DeGRAM | DXY preparing for correctionDXY is near the upper border of the channel, between the trend lines, which the chart formed during the correction on the last downward impulse.
The price has reached the resistance level and is now below it.
We expect a correction after the retest of the channel border.
-------------------
Share your opinion in the comments and support the idea with like. Thanks for your support!

DeGRAM | DXY growth in the channelDXY is moving in a descending channel between trend lines.
Having reached the lower boundary of the channel, the chart has formed a reversal harmonic pattern.
The price has reached the 62% retracement level.
We expect the growth to continue after retesting and consolidating above the current resistance.
-------------------
Share your opinion in the comments and support the idea with like. Thanks for your support!

Is a DXY Pullback on the Horizon? Key Price Action Signals Is a DXY Pullback on the Horizon? Key Price Action Signals to Keep an Eye On
👀👉 The DXY Dollar Index has shown robust bullish momentum recently—but is it overextended? A pullback at a major support level could offer a valuable entry opportunity. I’m watching this zone closely for a possible buy setup aligned with the key criteria covered in the video. In this analysis, we’ll explore essential price action signals to watch and discuss strategies for positioning in the next potential move. Disclaimer: This analysis is for informational purposes only and not financial advice.* 📊✅

DXY makes it to the most important resistance zone.H4 12.11.2024💸 Dollar Index DXY makes it to the most important resistance zone 📉
The dollar index still managed to break through to the most important resistance zone 105.80-106.35 from which I expect a medium-term reversal. Honestly, I didn't think it would be pushed to it, but as it is. Other currencies against the dollar have almost reached their reversal zones, lacking the final rebound. As for me, the level of 106 on the index and the area near it is strong. The situation is a copy of 2016, when the index was also pushed hard, and then a long-term reversal was made to weaken it.
TVC:DXY

DXY (dollar index) Out lookMy bias for the dollar is that it may start to slow down and experience some pullbacks, likely to fill the imbalances below and capture some liquidity. However, I also see Scenario A playing out, which could push the price upward and continue the bullish trend.
Given the current market conditions, I expect these retracements, which also align with my outlook for EU and GU.
Confluences supporting my bullish bias on the dollar:
- The DXY has been very bullish and has broken significant structure to the upside.
- The DXY has surpassed the key psychological level of 105.00.
- There is still a lot of liquidity to the upside that needs to be taken.
- Clean demand zones are in place, reinforcing my bullish outlook.
P.S. Be cautious and watch for the major red news on Wednesday, specifically the CPI event, as it will provide key insight for the forecast. I expect the dollar to retrace ahead of the news, but once it's released, I anticipate the dollar will shoot back up.

DXY "DOLLAR INDEX" Bank Bullish Robbery Plan To Steal MoneyHola! My Dear Robbers / Money Makers & Losers, 🤑 💰
This is our master plan to Heist DXY "DOLLAR INDEX" Bank based on Thief Trading style Technical Analysis.. kindly please follow the plan I have mentioned in the chart focus on Long entry. Our target is Red Zone that is High risk Dangerous level, market is overbought / Consolidation / Trend Reversal / Trap at the level Bearish Robbers / Traders gain the strength. Be safe and be careful and Be rich.
Entry : Can be taken Anywhere, What I suggest you to Place Buy Limit Orders in 15mins Timeframe Recent / Nearest Swing Low
Stop Loss 🛑 : Recent Swing Low using 2h timeframe
Attention for Scalpers : If you've got a lot of money you can get out right away otherwise you can join with a swing trade robbers and continue the heist plan, Use Trailing SL to protect our money 💰.
Warning : Fundamental Analysis news 📰 🗞️ comes against our robbery plan. our plan will be ruined smash the Stop Loss. Don't Enter the market at the news update.
Loot and escape on the target 🎯 Swing Traders Plz Book the partial sum of money and wait for next breakout of dynamic level / Order block, Once it is cleared we can continue our heist plan to next new target.
Support our Robbery plan we can easily make money & take money 💰💵 Follow, Like & Share with your friends and Lovers. Make our Robbery Team Very Strong Join Ur hands with US. Loot Everything in this market everyday make money easily with Thief Trading Style.
Stay tuned with me and see you again with another Heist Plan..... 🫂

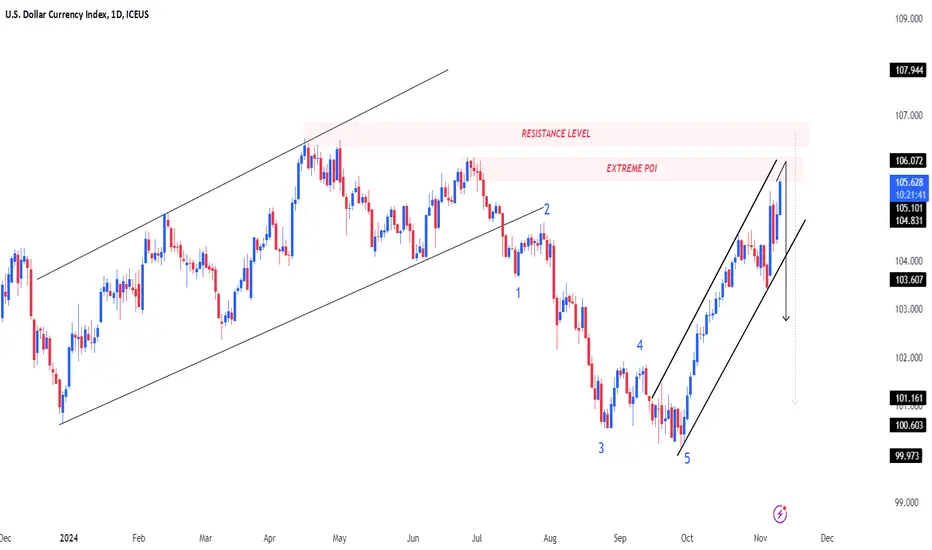
DXY IndexDXY Index
Completed " 12345 " Impulsive Waves and " ABC " Corrective Waves at Extreme Point of Interest ( POI ). Bullish Channel as an Corrective pattern in Short Time Frame and Rejection from Resistance Level with a Strong Divergence
Is the DXY dollar index ready for a correction ? H4 08.11.2024💸 Is the DXY dollar index ready for a correction ⁉️
Looking back to 2016 when Trump first became US President, the dollar index initially reacted with a sharp rise and then a prolonged fall. I wonder if history will repeat itself again or if the market will take his second presidency more calmly in the distance.
DXY formed a sellers' zone at 104.80-105.16, but the far resistance zone at 106 remains intact. It's not a sure thing that it will get there, but I keep the option in my head just in case. The priority for me is to fall from the nearest sellers' zone with the targets of 103.30 and lower to 102.30. I will specify in the process.
TVC:DXY

EUR/USD: PAT + VPA 10/21/2024Good morning,
I will be monitoring the daily candle close today, anticipating a bullish pullback or reversal to develop over the next few weeks.
Several indicators have pointed to this:
1. The weekly chart has surpassed the previous high established on December 25, 2023. Currently, the price is attempting to retest the Demand zone that led to the breakout of that high..
2. The weekly demand zone is identified between 1.0775 and 1.0825. Pay attention to the key level at 1.080, as it appears to be setting up as a robust support level for the currency pair.
3. The market has declined approximately 400 points since September 27, 2024, showing minimal pullbacks on a daily basis. Notably, this price drop has formed a double top without a genuine next line test. I anticipate that prices will rebound to around 1.100 in the coming weeks. A break below 1.100 could trigger a long-term retracement back to the highs at 1.200.
Volume signature indicates that market makers are gradually exiting the trend. The weekly outlook remains bullish and is expected to dominate. It's important to note that the weekly chart is currently retesting the bearish flag it broke out of between June 24, 2024, and August 19, 2024.
TVC:DXY
OANDA:EURUSD
XETR:DAX

Gold’s Sharp Decline Brings Profits; Ready to BuyI predicted it in advance—the election results would boost the dollar, leading to a drop in gold. Do you trust my analysis? Have you ever traded with such precision? If you followed my suggestion, I’m sure you’ve made a substantial profit! Gold’s volatility remains high, and it may drop below 2700 before rebounding. I’m ready to start buying—are you joining in?

DXY bias new outlooklast 10 candle does not have any liquidity which seems that price is likely to bounce from 1st poi
but the candle from nov5 and nov6 will be important as it is bearish marbozu with nov6 candle could create bearish fvg that can give price another rejection zone to push the price to test poi 2
based on drawn poi
poi 1 = 103.220
and poi 2 = 102.630
we need see if price is rejected from this zone followed by dotted line which represents external liquidity to grab
and finally we have orange zone that is weekly bearish fvg once that is tested will follow with new idea

XAUUSD: Bullish trendToday, gold has tested the support at the 2732-2728 range again. So far, the support remains intact, and the short-term trend is still leaning towards a bullish outlook. Based on this, the primary trading direction in the current session remains bullish.
From a technical perspective, gold is likely to continue its upward momentum in the near term. The key resistance zone to watch on the upside is between 2750 and 2758. It is worth noting that a resistance level has emerged around 2745 since the market opened yesterday.
However, given the overall trend, this resistance does not pose a strong technical barrier at the moment, and a breakout above this level is not expected to face significant difficulty.
Therefore, if gold can break above the 2745 level, there is a high likelihood of further gains towards the 2750-2758 range.

EURUSD 1.09085 +0.71% short idea INTRA-DAY SET UP...HELLO TRADERS
Hope everyone is doing great
📌 A look at The EURUSD NY FROM AM - PM SESSION
* With a bullish run into Monday CLOSE (PO3) today will be looking for some retracement.
* looking at the daily HIGH taken which is a sign of weakness on EU.
* Looking at the VI below as targets as well.
* on the 4H looking for a bullish open to take ASIA high LQ✔.
* PO3
* Push higher before going for lower structures✔.
* looking for an aggressive move above out of the range to sweep.
* and aggressive in.
* this where I would look for entries short.
* Looking for the take of that ERL WHICH we saw friday.
* with two possible OTE ( ASIA HIGHS, AND LONG TERM HIGH) , EXECUTION IS BASED ON RR & RISK MANAGEMENT.
* DXY 15M
- Will wait for the DXY to take ASIA lows and trade back in the range as a confirmation as well...
* BASED on the price action served next session...
* We will see what does the market dish.
🤷♂️😉🐻📉🐮📈
HOPE YOU ENJOYED THIS OUT LOOK, SHARE YOUR PLAN BELOW,🚀 & LETS TAKE SOME WINS THIS WEEK.
SEE YOU ON THE CHARTS.
IF THIS IDEA ASSISTS IN ANY WAY OR IF YOU ENJOYED THIS ONE
SMASH THAT 🚀 & LEAVE A COMMENT.
ALWAYS APPRECIATED
____________________________________________________________________________________________________________________
Kindly follow your entry rules on entries & stops. |* Some of The idea's may be predictive yet are not financial advice or signals. | *Trading plans can change at anytime reactive to the market. | * Many stars must align with the plan before executing the trade, kindly follow your rules & RISK MANAGEMENT.
_____________________________________________________________________________________________________________________
|
* ENTRY & SL -KINDLY FOLLOW YOUR RULES | * RISK-MANAGEMENT | *PERIOD - I TAKE MY TRADES ON A INTRA DAY SESSIONS BASIS THIS IS NOT FINACIAL ADVICE TO EXCECUTE ❤
LOVELY TRADING WEEK TO YOU!
