"DXY Bullish Setup – High Probability Trade!"🚨 "DXY DOLLAR BANK HEIST" – THIEF TRADING STYLE MASTER PLAN (HIGH-IMPACT TRADE ALERT!)
🔥 "Steal the Market Like a Pro – This DXY Heist Could Print Serious Cash!" 🔥
🌍 Greetings, Market Pirates & Profit Raiders! 🌍
🤑 "Money isn’t made… it’s TAKEN!" 💰💸
Based on the 🔥 Thief Trading Style 🔥 (a lethal mix of technical + fundamental + psychological warfare), we're executing a DXY Dollar Index Bank Heist—a high-stakes robbery where YOU get to keep the loot!
📜 THE HEIST BLUEPRINT (TRADE PLAN)
🎯 ENTRY ZONE – "BREAK THE VAULT DOOR!"
📍Key Trigger: Wait for price to SMASH through the Moving Average Wall (97.700) – then STRIKE!
🔪 Thief’s Entry Trick:
Buy Stop Orders above MA (aggressive)
Buy Limit Orders near recent swing low (smart pullback play)
DCA/Layering Strategy for max profit extraction (real robbers scale in!)
🚨 ALERT SETUP: "Don’t miss the breakout – set an ALARM!" ⏰
🛑 STOP LOSS – "DON’T GET CAUGHT!"
"Yo, rookie! If you’re entering on a breakout, WAIT for confirmation before placing SL!"
📍Thief’s SL Zone: 97.400 (30min swing low – adjust based on your risk appetite!)
⚠️ WARNING: "Place it wrong, and the cops (market) will lock YOU up!" 🚔
🎯 TARGET – "ESCAPE WITH THE LOOT!"
🏆 Primary Target: 98.350 (Take profits before the resistance police show up!)
🔄 Scalper’s Bonus: "Trail your SL, squeeze every pip!"
💡 Pro Tip: "If you’re underfunded, ride with the swing traders – teamwork makes the dream work!"
💣 WHY THIS HEIST WILL WORK (MARKET DYNAMICS)
✅ Bullish Momentum Building (DXY showing strength!)
✅ Overbought? Maybe… but thieves don’t wait for permission!
✅ Trend Reversal Potential (Big money shifting!)
✅ Police (Resistance) Trap Ahead (Escape before they catch you!)
📡 NEWS & RISK MANAGEMENT (DON’T GET BUSTED!)
🚨 High-Impact News? AVOID new trades! (Use trailing stops to lock profits!)
📊 Check COT Reports, Macro Data, Geopolitics (Smart thieves do their homework!)
💥 BOOST THIS HEIST – LET’S GET RICH TOGETHER!
👊 "Hit the LIKE & BOOST button to fuel our next heist!"
💖 "More boosts = More robberies = More FREE money for YOU!" 🚀
⚠️ DISCLAIMER (LEGAL SPEAK)
"This ain’t financial advice – just a damn good robbery plan. Trade at your own risk, and don’t cry if you ignore the SL!" 😎
🔔 Stay tuned for the next heist… The market’s our playground! 🏴☠️💰
🚀 "See you at the next breakout, thief!" 🚀
🔥 #DXY #Forex #Trading #BankHeist #ThiefTrading #ProfitPirates #MakeMoney #TradingView #SmartMoney 🔥
Dxyanalysis

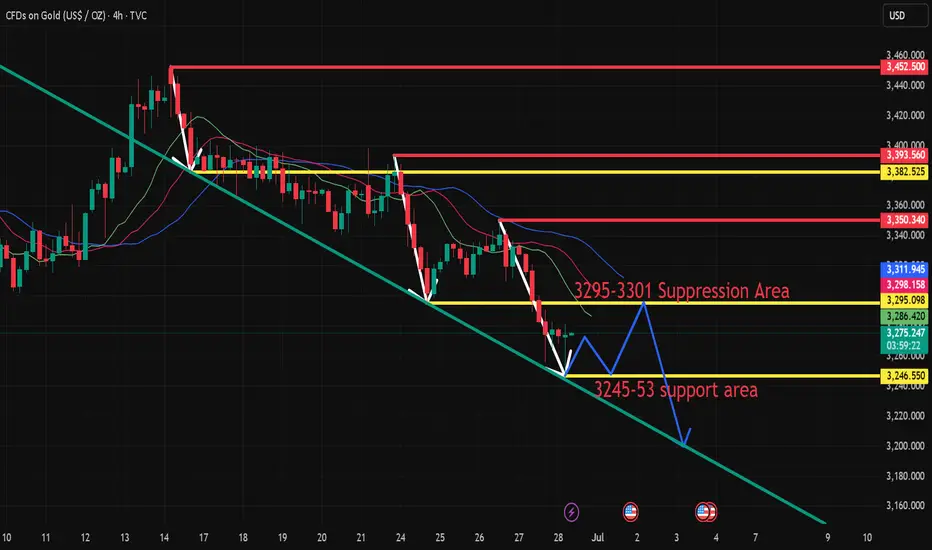
Gold's short-term decline is limited and will continue to riseWith the rise of gold in the US market yesterday, the trend line of the downward trend channel has been supported many times in the short cycle. After the rebound, we still need to pay attention to the suppression of 3328-30. This position is the suppression position of the 4-hour downward trend channel. If it breaks, the overall trend will be a rising flag, which may continue the upward trend. Of course, if it continues to not break through the suppression of 3328-30, it may fluctuate within the range. This requires further observation.
Intraday short-term suggestions: short-term long mainly, pay attention to the support of short-term long near 3307, stop loss 3297, take profit at 3328-30 suppression, break at 3348-50, pay attention to risks.

Dollar Index AnalysisDollar Index has been in continuous sell for last 5 Months. Has hit the demand zone and giving a pull back and short term trend in daily and 4H charts. From the 4H charts we can see that it is in short term uptrend move and has pushed higher and it is giving a pull back which is visible.

7.9 Gold long and short switches frequently!From the daily chart, the overall gold price is still in a weak position, the moving average is hooked, and the upper pressure is near the moving average 3319. Only if it breaks through and stands firm at this position during the day, can the bulls start to exert their strength. It happens that the MA10 position of H4 is also near 3319. At present, H4 is in a bearish trend, so the bullish pressure is still very large, but it rose in the early morning, and it bottomed out and rebounded. Combined with the recent non-continuation of the long and short trends, there is a high probability of rebounding during the day, so we can go long in the Asian session first, and go long directly at the current price of 3300, add positions to 3295, defend 3286, and look at 3312-19. The focus is still on the strength of the European session. If the European session is strong, continue to go long before the US session retreats; if the European session is weak, the US session will bottom out and rebound!

Weekly range to be continued, gold short and long this weekLast week, gold opened high at 3280.9 at the beginning of the week and then fell back. The weekly low reached 3245.8, and then the market was strongly pulled up by the support of this round of trend line and fundamentals. On Thursday morning, the weekly high touched 3366, and then the market fell strongly under the strong influence of non-agricultural data. On Friday, the market consolidated in the range due to the holiday, and the weekly line finally closed at 3337.2. The weekly line closed with a medium-sized positive line with equal upper and lower shadows. After ending in this pattern, today's market continued to move in the range. In terms of points, the stop loss was still at 3346 after the short position at 3342 last Friday. Today, it first rose to 3342 and the short stop loss was still 3346. The target below is 3330 and 3322. If it falls below, the support of 3310 and 3300-3292 will be targeted.

DXYDXY still needs more correction upside, once we see more upside we will see if dollar is ready for one last drop.
Disclosure: We are part of Trade Nation's Influencer program and receive a monthly fee for using their TradingView charts in our analysis.

DXY Potential Bullish Reversal – Target 99.456 DXY Potential Bullish Reversal – Target 99.456 🎯
Technical Analysis Overview:
🔹 Trend Structure:
The chart illustrates a recent downtrend, which has been broken as price moved above the descending trendline, signaling a potential trend reversal.
🔹 Pattern Insight:
A bullish harmonic pattern is visible (possibly a bullish Bat or Gartley), with the price reacting from the PRZ (Potential Reversal Zone), aligning with key support near 96.500. The market has respected this zone multiple times, evident from the orange highlighted circles showing price rejections.
🔹 Support & Resistance:
Support Zone: ~96.500
Breakout Zone: ~96.985 (current consolidation near this resistance)
Target Zone: Marked at 99.456, which aligns with previous structure and fib projection.
🔹 Market Sentiment:
Price is consolidating after breaking the downtrend, forming a bullish rectangle (accumulation). The green arrows indicate bullish intent from buyers defending support levels.
🔹 Price Action Signal:
Formation of higher lows.
Break of structure and close above previous highs.
Possible breakout pending above consolidation box.
📊 Conclusion:
DXY shows bullish potential as it builds a base around strong support. A confirmed breakout above the rectangle could fuel a rally toward 99.456. Keep an eye on volume and confirmation candles for entry. ✅

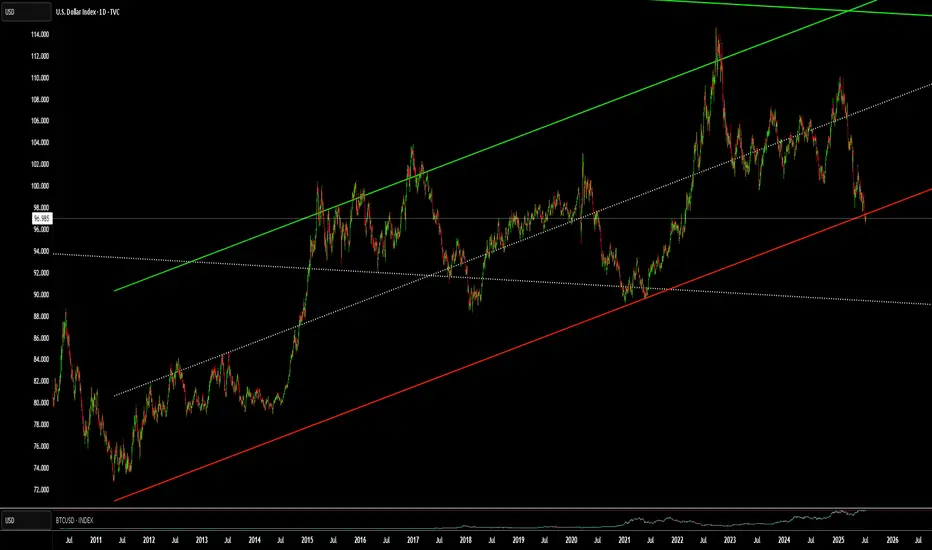
WHy is everyone Freaking out over the DXY !?!?!Here is a chart of the DXY. with a linear regression channel plotted over it. Yes, we are close to the bottom of the channel. But we are no where near an all time low. Far from it. The DXY may be due for a push, but even if it was to drop more it would not be that big of a deal relative to historical patterns.
7.3 Prediction of gold price fluctuation before non-agriculturalAfter the release of ADP data last night, gold prices resumed their rise and crossed the high of 3357.88 this week and closed near this position. Today, gold prices opened high and then fell back. Pay attention to the strength of the correction in the morning session and choose the opportunity to go long and bullish. From the current market perspective, the support below can focus on the low point of yesterday's US session near 3333, followed by 3327; before the release of non-agricultural data, the upper pressure will focus on the early trading start point 3366, followed by 3375. The operation in the Asian and European sessions is mainly to go long on the correction, and the high-altitude thinking is abandoned. Specific operation ideas: Go long and bullish when the gold price falls back to around 3338, protect the position of 3330, and the target is to see whether the early trading high of 3365 can break!

A Dollar in Freefall and a Bitcoin on the Brink
In the grand theater of global finance, narratives rarely align with perfect symmetry. The market is a complex ecosystem of competing forces, a cacophony of signals where long-term tectonic shifts can be momentarily drowned out by the piercing alarms of short-term volatility. Today, we stand at the precipice of one of the most profound and fascinating divergences in modern financial history, a story of two assets locked in an inverse dance, each telling a radically different tale about the immediate future.
On one side of this chasm stands the titan of the old world, the U.S. Dollar. The bedrock of global commerce, the world’s undisputed reserve currency for nearly a century, is in a state of unprecedented crisis. The U.S. Dollar Index (DXY), the globally recognized measure of the greenback’s strength against a basket of other major currencies, is in freefall. It is suffering its most catastrophic crash since 1991, and by some measures, is enduring its worst year since the historic turmoil of 1973. This is not a minor correction; it is a fundamental challenge to the dollar’s hegemony, a macro-level event driven by seismic shifts in U.S. economic policy, including aggressive trade tariffs and ballooning government deficits. For the world of alternative assets, a collapsing dollar is the loudest possible bullhorn, a clarion call to seek refuge in stores of value that lie beyond the reach of any single government.
On the other side of the chasm is the digital challenger, Bitcoin. Born from the ashes of the 2008 financial crisis as an answer to the very monetary debasement the dollar is now experiencing, Bitcoin should, by all fundamental logic, be soaring. The dollar’s demise is the very thesis upon which Bitcoin’s value proposition is built. And yet, while the long-term case has never looked stronger, the short-term picture is fraught with peril. A close reading of its technical chart reveals a market showing signs of exhaustion. A key momentum indicator, the stochastic oscillator, is flashing a stark warning, suggesting that the digital asset, far from rocketing to new highs, could be on the verge of a significant drop, a painful correction that could pull its price back below the psychological threshold of $100,000.
This is the great divergence. The macro-economic landscape is screaming for a flight to safety into hard assets like Bitcoin, while the micro-level technicals of Bitcoin itself are suggesting an imminent storm. It is a battle between the long-term fundamental signal and the short-term technical noise, a dilemma that forces every market participant to ask themselves a critical question: In a world where the old rules are breaking down, do you trust the map or the compass?
Chapter 1: The Fall of a Titan - Deconstructing the Dollar's Demise
To understand the magnitude of Bitcoin’s long-term promise, one must first dissect the anatomy of the dollar’s current collapse. The U.S. Dollar Index, or DXY, is not merely a measure of the dollar against a single currency; it is a weighted average of its value relative to a basket of six major world currencies: the Euro, the Japanese Yen, the British Pound, the Canadian Dollar, the Swedish Krona, and the Swiss Franc. Its movement is a reflection of global confidence in the U.S. economy and its stewardship. For this index to suffer its worst crash since 1991 is a historic event. To be on pace for its worst year since 1973 is a paradigm-shifting crisis.
The year 1973 is not a random benchmark. It was the year the Bretton Woods system, which had pegged global currencies to the U.S. dollar (which was in turn pegged to gold), officially died. Its collapse ushered in the modern era of free-floating fiat currencies. For the dollar’s current performance to be compared to that chaotic, system-altering period is to say that the very foundations of the post-1973 monetary order are being shaken.
The catalysts for this historic weakness are rooted in a dramatic shift in American economic policy, largely attributed to the actions of President Donald Trump’s administration. The two primary drivers are a protectionist trade policy and a fiscal policy of burgeoning deficits.
First, the tariffs. The implementation of broad tariffs on imported goods was intended to protect domestic industries and renegotiate trade relationships. However, such measures are a double-edged sword for a nation's currency. They create friction in the intricate web of global supply chains, increase costs for consumers and businesses, and often invite retaliatory tariffs from trading partners. This environment of trade conflict creates economic uncertainty, which can deter foreign investment. When international capital becomes wary of deploying in a country, demand for that country’s currency wanes, putting downward pressure on its value.
Second, and perhaps more fundamentally, are the rising deficits. The U.S. government has been running massive budget deficits, spending far more than it collects in revenue. This debt must be financed. When a country runs a large budget deficit alongside a large current account deficit (importing more than it exports), it becomes heavily reliant on foreign capital to purchase its government bonds. If the world’s appetite for that debt falters, or if the sheer volume of new debt issuance becomes too large to absorb, the nation’s central bank may be implicitly forced to monetize the debt—effectively printing new money to buy the bonds. This expansion of the money supply is the classic recipe for currency debasement.
The combination of trade protectionism and fiscal profligacy has created a perfect storm for the dollar. Global investors, looking at the rising deficits and the unpredictable trade environment, are beginning to question the long-term stability of the dollar as a store of value. This erosion of confidence is what is reflected in the DXY’s historic plunge. A weaker dollar makes U.S. exports cheaper and imports more expensive, but its most profound effect is on the global investment landscape. It forces a worldwide repricing of assets and sends a tidal wave of capital searching for alternatives that can preserve wealth in an era of fiat decay.
Chapter 2: The Digital Phoenix - Bitcoin's Long-Term Bull Case
In the world of finance, every action has an equal and opposite reaction. As the value of the world's primary reserve asset erodes, the value of its antithesis should, in theory, appreciate. Bitcoin is the dollar’s antithesis. Where the dollar’s supply is infinite and subject to the political whims of policymakers, Bitcoin’s supply is finite, transparent, and governed by immutable code. There will only ever be 21 million Bitcoin. This fundamental, mathematically enforced scarcity is the core of its value proposition.
The inverse correlation between the DXY and Bitcoin is one of the most powerful and intuitive relationships in the digital asset space. When the DXY falls, it signifies that the dollar is losing purchasing power relative to other major currencies. For investors around the globe, this means that holding dollars is a losing proposition. They begin to seek out assets that are not denominated in dollars and cannot be debased by the U.S. Federal Reserve. Bitcoin stands as the prime candidate for this capital flight. It is a non-sovereign, globally accessible, digital store of value that operates outside the traditional financial system. A falling dollar is therefore the strongest possible tailwind for Bitcoin, validating its very reason for existence.
This relationship transcends simple price mechanics; it is a philosophical and macroeconomic hedge. Owning Bitcoin is a bet against the long-term viability of the current debt-based fiat monetary system. The dollar’s crash, driven by deficits and monetary expansion, is not a flaw in the system; it is a feature of it. Bitcoin offers an escape hatch. It is a lifeboat for investors who see the iceberg of sovereign debt on the horizon.
This narrative is what has fueled the wave of institutional adoption that has defined the current market cycle. Sophisticated investors and corporations are not allocating to Bitcoin because they are speculating on short-term price movements. They are buying it as a long-term strategic reserve asset, a hedge against the very macroeconomic turmoil that the dollar’s crash represents. They see a world drowning in debt and a global reserve currency being actively devalued, and they are making a calculated, multi-generational bet on a system of verifiable digital scarcity. From this perspective, the long-term bull case for Bitcoin has never been clearer or more compelling. The dollar’s historic weakness is the ultimate validation of the Bitcoin thesis.
Chapter 3: The Ghost in the Machine - Bitcoin's Short-Term Technical Warning
If the story ended with the macro-economic picture, the path forward would be simple. But markets are not simple. They are a reflection of human psychology, a tapestry of fear and greed woven in real-time. While the fundamental, long-term story points resolutely upward, the short-term evidence, as read through the language of technical analysis, is painting a much darker picture.
Technical analysis operates on the principle that all known information, including the bullish macro fundamentals, is already reflected in an asset's price. It seeks to identify patterns and gauge market momentum to predict future movements. One of the most trusted tools for measuring momentum is the stochastic oscillator. It does not measure price or volume itself, but rather the speed and momentum of price changes. Think of it like a car's tachometer: it tells you not how fast you are going, but how hard the engine is working to maintain that speed.
The stochastic oscillator operates on a scale of 0 to 100. A reading above 80 is considered "overbought," suggesting the asset has moved up too quickly and the rally may be running out of steam. A reading below 20 is considered "oversold," suggesting a decline may be exhausted. The current technical analysis of Bitcoin’s chart reveals a deeply concerning signal from this indicator.
Despite the overwhelmingly bullish news of the dollar’s collapse, Bitcoin’s price momentum is reportedly waning. The stochastic oscillator is likely showing what is known as a "bearish divergence." This occurs when the price of an asset pushes to a new high, but the oscillator fails to do so, creating a lower high. This is a classic warning sign. It’s the market’s equivalent of a car’s engine sputtering and revving less intensely even as the driver pushes the accelerator to the floor. It suggests that the underlying buying pressure is weakening, that the rally is becoming exhausted, and that a reversal or significant correction may be imminent.
The technical forecast of a potential drop below the $100,000 level stems directly from this type of signal. It implies that the recent price strength is not supported by genuine momentum and that the market is vulnerable. Why would this happen when the fundamental news is so positive? There are several possibilities. Short-term traders who bought at lower prices may be taking profits. The market may be flushing out over-leveraged long positions, triggering a cascade of liquidations. Or, it could simply be the natural rhythm of a market. No asset moves up in a straight line. Even the most powerful bull trends require periods of consolidation and correction to shake out weak hands, build a stronger base of support, and gather energy for the next major advance. A pullback to below $100,000, while painful for those who bought at the top, could be a perfectly healthy and necessary event in the context of a much larger, multi-year bull market.
Chapter 4: Reconciling the Irreconcilable - The Investor's Dilemma
This great divergence presents every market participant with a profound dilemma, forcing a clear-eyed assessment of their own investment philosophy and time horizon. The market is speaking in two different languages simultaneously, and the message you hear depends on the language you choose to listen to.
For the long-term investor, the individual or institution with a five, ten, or twenty-year outlook, the story is clear. The historic crash of the U.S. dollar is the signal. It is the fundamental, world-altering event that confirms their thesis. The debasement of the world’s reserve currency is a generational opportunity to allocate capital to a superior, non-sovereign store of value. From this vantage point, the bearish reading on a short-term stochastic oscillator is, at best, irrelevant noise. It is the momentary turbulence felt on a flight destined for a much higher altitude. The strategy for this investor is one of conviction. They may choose to ignore the short-term dip entirely, or more likely, view it as a gift—a final opportunity to accumulate more of a scarce asset at a discount before the full force of the dollar’s crisis is felt in the market. Their actions are guided by the macro map, not the short-term compass.
For the short-term trader, the world looks entirely different. Their time horizon is measured in days, weeks, or months, not years. For them, the bearish divergence on the stochastic oscillator is the signal. The macro story of the dollar’s decline is merely the background context. Their primary concern is managing risk and capitalizing on immediate price swings. A warning of a potential drop below $100,000 is an actionable piece of intelligence. It might prompt them to take profits on existing long positions, hedge their portfolio with derivatives, or even initiate a short position to profit from the anticipated decline. Their survival depends on their ability to react to the compass of market momentum, regardless of the map’s ultimate destination.
The most sophisticated market participants, however, attempt to synthesize these two perspectives. They recognize that the long-term macro trend provides the overarching directional bias, while the short-term technicals provide the tactical roadmap for navigating that trend. Such an investor would maintain a core long position in Bitcoin, acknowledging the powerful tailwind of the dollar’s collapse. However, they would use the technical signals to actively manage their position and optimize their entries and exits. They might trim their position when the stochastic indicator signals overbought conditions, taking some profit off the table to reduce risk. They would then stand ready to redeploy that capital and add to their core holding when the technicals signal oversold conditions after the very correction they anticipated. This approach allows them to maintain their long-term conviction while respecting the short-term risks, blending the art of the trader with the discipline of the investor.
Conclusion: The Signal and the Noise
The financial markets are standing at a historic crossroads. The U.S. dollar, the sun around which the global monetary system has orbited for generations, is dimming. Its historic crash is a signal of the highest order, a fundamental warning that the era of unchallenged fiat dominance is facing its most serious test. This decay is creating a powerful gravitational pull toward assets defined by scarcity and sovereignty, with Bitcoin as the undisputed digital leader. This is the signal.
Simultaneously, the internal mechanics of the Bitcoin market are showing signs of short-term fatigue. The warnings from technical indicators like the stochastic oscillator are a reminder that no market is immune to the laws of gravity, that periods of profit-taking and consolidation are a natural and healthy part of any long-term advance. This is the noise.
The great challenge, and the great opportunity, for every investor today is to learn to distinguish between the two. The collapse of the dollar is a paradigm shift, while the potential drop in Bitcoin’s price is a cyclical correction. The former defines the destination; the latter describes the terrain along the way. The current divergence is a test of thesis, of timeframe, and of temperament. Those who are shaken out by the short-term noise will likely miss the long-term signal. But those who understand that the dollar’s fall is the very reason for Bitcoin’s rise, and who have the conviction to see the short-term turbulence for what it is, will be best positioned to navigate this great divergence and witness the dawn of a new financial landscape.

7.2 Technical Analysis of Gold Trading in the US MarketGold fluctuated in the range of 3326-3355 today on Wednesday. The small non-agricultural bullish gold broke through the 3345 line and hit the 3351 line, and then fluctuated back to the current 3342 to adjust the momentum of rising again. If the positive line on Wednesday closed above 3345, it will continue to rise to 3363-3370; if the negative line on the closing fell below the middle track, it will continue to fluctuate and consolidate in this range. The support of 3324 below is the key position tonight; as long as this position is maintained, the bulls will rebound and rise, otherwise they will fall into the battle for support at the 3295-3301 line.
Technical analysis:
From the 4-hour analysis, the support below is around 3324. The main bullish trend remains unchanged after the evening retracement. The important support is 3314-16, and the focus is on the long-short watershed position of 3295-3301. The daily level stabilizes above this position and continues to maintain the rhythm of retracement and bullish trend.

Gold bulls and bears compete for non-agricultural dataTechnical aspects:
Currently, gold is in a typical ascending triangle structure, reflecting that the market bullish trend has not been broken but faces strong resistance. On the daily chart, gold as a whole maintains a range of $3250 to $3400, with obvious horizontal support and resistance bands formed at both ends of the range.
The Bollinger Bands are converging as a whole, indicating that volatility is shrinking, indicating that the large-scale direction selection is approaching. The green column of the MACD indicator has narrowed slightly, and the short-term momentum is still bearish but there are signs of weakening. The RSI indicator runs around 49, maintaining a neutral and bearish state, and there is no obvious deviation in the short term, suggesting that there is still the possibility of subsequent shocks and consolidation.

7.2 Gold price continues to fluctuate! Non-agricultural positionGold is still temporarily maintaining a wide range of fluctuations in the daily trend, and the price is temporarily under pressure around 3360. In the 4-hour level trend, after continuous high-level narrow fluctuations, the technical pattern has begun to weaken. The short-term moving average has gradually flattened from the previous upward divergence. After the continuous small-scale high-rise and fall back, the upward momentum in the short-term trend is insufficient. In the hourly level trend, the current running space is very compressed, but in the small-level cycle trend, after continuous fluctuations, the technical pattern has begun to weaken. The price has begun to slowly move out of the narrow range of fluctuations. Pay attention to the short-term adjustment and repair.

7.1 Technical guidance for short-term gold analysis!!!Gold hourly level: From the opening to now, it has been rising slowly with a small negative in the middle. It is all positive. This kind of pull-up pattern must not be tested for shorting. During the European session, it also broke through the upper rail resistance of the 3335 downward channel. There is a second pull-up in the US session; but it has not been able to step back, and even the 10-day moving average does not give a chance. If you want to step back and follow the long position, there is no chance for the time being, and going long directly seems more radical; conservative can wait patiently, be bullish, and don't go short; if it can be confirmed tonight that it is above 3335, you can try to follow the bullish trend, and the upper resistance target is 3374;

7.2 Gold bulls continue to rise, bears come to an end temporarilFrom the 4-hour analysis, the upper focus is on the 3345 line of suppression, the lower short-term support focuses on the 3314-3316 line, and the key support of 3295-3301 line is focused on. The overall support is based on this range to maintain the main tone of low-multiple participation. In the middle position, watch more and do less, be cautious in chasing orders, and wait patiently for key points to enter the market.
Gold operation strategy:
1. Gold 3316-24 line long, retrace to 3295-3303 line to add more positions, stop loss 3293, target 3340-45 line, continue to hold if broken;

7.1 London gold rebounds and rises, gold market trend analysis aGold rose to 3295 in the Asian session on Monday and was blocked. It fell in the European session as we expected, but the decline was not strong. After the lowest price of 3274.57, it rose again in the US session and stood firmly at the 3300 mark. The monthly line closed with a cross Yang K. The gold price continued to rise at the opening today. After the market on Monday, the 3247 below can be used as a reference for the bottom rebound position. Now the short-term trend belongs to the bulls, so we will continue this trend today and look at the upward trend first, wait for the European session to see the strength of the decline and then formulate the idea of the US session.
From the market point of view, after the gold price stood above the 3300 mark again, it is used as a short-term support level reference for the bulls. The Asian session can rely on this position to arrange long orders to see the continuation of the upward trend; the initial pressure on the upper side focuses on the 3328 position, followed by 3345. Now that the idea is established, the idea for intraday operations is: wait for the gold price to pull back to around 3308 in the Asian session and then go long and bullish, protect the 3300 mark, and target around 3328; if there is pressure at 3328 in the European session, you can arrange short positions with a downward trend, wait for the US session, and then decide whether to go long again based on the pullback position and target around 3345.

Gold's rally has not reversed yet? The consolidation pattern hasTechnicals:
Short-term risks remain skewed to the downside as the momentum of the relative strength index (RSI) and the moving average convergence divergence indicator (MACD) weakens. The RSI hit a new low below the neutral 50 mark. If short pressure intensifies in the next few trading days, gold prices may retest the upper track of the previous falling channel at 3215, followed by the rising support line from October 2024 at 3150. If it falls below this level, the decline may accelerate towards the psychological level of 3000, or even lower to 2970.
On the upside, if a strong catalyst pushes gold to rebound above the 20-day and 50-day moving averages (currently 3320-3350), the next resistance level may appear in the 3400-3435 range. A decisive close above this boundary may pave the way for gold prices to move towards 3500, or test resistance near 3530, and then may target the 3600 level.
Overall, despite the weakening technical indicators, gold has not completely lost its bullish reversal potential. As long as the price remains within the sideways structure above 3150, the downward pressure may still give rise to a "buy on dips" strategy.

6.30 Safe haven disappears, gold loses its luster!Gold did not break through the upper pressure at midnight last Friday. Gold fell directly after opening in the morning on Friday. The bears broke through the previous 3295 support line, and the lowest reached 3255 in the evening. It closed at around 3274, and the daily line also closed in the form of a big Yin line.
From the 4-hour analysis, the upper short-term resistance focuses on the 3295-3301 line, and the 3316 line is focused on. In terms of operation, it is still rebounding and continuing to be short and follow the trend to fall. The short-term support below focuses on the 3250-3255 line. The overall high-altitude participation tone remains unchanged relying on this range. I will remind you of the specific operation strategy during the session, and pay attention to it in time.
Gold operation strategy:
1. Short gold rebounds at the 3295-3301 line, and short gold rebounds at the 3314-16 line, stop loss at 3326, target 3255-3260 line, and continue to hold if it breaks;
6.30 Four-hour resistance determines the strength of the reboundAt the weekly level, the short-term focus is on the adjustment and continued breaking of the weekly support. As time goes by, the weekly support is at the 3285 watershed. At the daily level, after the price broke the daily support last week, the price continued to rely on the daily resistance to bear pressure. At present, the daily resistance is at the 3355 area resistance. Below this position, gold can continue to be shorted. At the four-hour level, the four-hour key position is the key to our emphasis on short-term trends. At present, the four-hour watershed is in the 3300 area, so the focus is on the gains and losses of this position. Before it breaks up, the short-term focus will be on the pressure first, but once it breaks up, it will need to focus on the rebound to the daily resistance. From the one-hour perspective, the bottom rebounded during the early morning session and broke through the high point of the previous trading day’s early morning retracement, so the short-term is still in adjustment. Temporarily pay attention to the gains and losses of the 3300 position, and treat it as the right-side trading method in terms of operation.

Skeptic | Weekly Watchlist : DXY Triggers & Pro SetupsLast week, DXY played out our bearish scenario perfectly, breaking the short trigger at 98.530 and delivering a strong downward move . With Higher Wave Cycle (HWC) and Minor Wave Cycle (MWC) now bearish, I’m leaning heavier on short positions with tighter risk management. Let’s break it down with no FOMO, no hype, just reason. 📊
Daily Timeframe: The Big Picture
The key support at 98.801 was decisively broken, and we’ve confirmed below it—the major trend is now fully bearish. The next daily support lies at 96.478 , but I expect range-bound action early this week, especially after last week’s big move. Patience is key—let the market form a clear structure before jumping back in.
Key Insight: The bearish trend is locked in, but early-week consolidation is likely. Wait for the market to signal its next move.
4-Hour Timeframe: Long & Short Triggers
Zooming into the 4-hour chart, let’s pinpoint Low Wave Cycle (LWC) and triggers for long and short setups:
Short Trigger: Break below 4-hour support at 96.995 , confirmed by RSI re-entering oversold. Want to wield RSI like a pro? Check out my RSI Masterclass —it’s a game-changer! 😏
Long Trigger: Break above resistance at 98.215 . This is riskier since it’s against the bearish trend—set a wider stop-loss and take profits quickly. Why? HWC and MWC are bearish, so the first uptrend wave risks stop-loss hunts or fakeouts. I’ll drop an HWC/MWC/LWC guide soon to optimize entries, stops, and more—stay tuned!
Pro Tip: For longs, expect volatility in the first wave. Shorts align with the trend, so they’re the safer play—focus on 96.995.
Final Vibe Check
This Weekly Watchlist sets you up to trade smarter, not harder. DXY’s bearish momentum is our focus, but patience will unlock the best setups. I’ll keep you updated daily as markets evolve. Protect your capital—max 1%–2% risk per trade, no exceptions. Want the HWC/MWC/LWC guide or another pair? Drop it in the comments! If this watchlist sharpened your edge, hit that boost—it fuels my mission! 😊 Stay disciplined, fam! ✌️
💬 Let’s Talk!
Which setup are you eyeing this week? Share in the comments, and let’s crush it together!

“The Dollar Job: Break-In Strategy for 99+ Profits”💸 “DXY Heist Blueprint: Thieves’ Bullish Breakout Play” 🏴☠️
🌟Hi! Hola! Ola! Bonjour! Hallo! Marhaba!🌟
Welcome, Money Makers & Silent Robbers 🕶️💼✨
This is our next big Thief Trading Heist Plan targeting the 💵 DXY Dollar Index Vault. Armed with both technical precision 🔍 and fundamental insight 📊, we're ready to strike smart — not just fast.
🎯 THE MASTER HEIST PLAN:
🟢 ENTRY POINT – “Heist Entry Protocol”
🎯 Wait for price to break above Resistance @ 99.000 and candle to close ✅
💥 Plan A: Place Buy Stop Orders just above breakout
📥 Plan B: For Pullback Pros, use Buy Limit at recent swing low/high (15m–30m TF)
📌 Tip: Set alerts — don’t get caught napping while the vault opens! ⏰🔔
🛑 STOP LOSS – “Thief’s Escape Hatch”
🧠 Use 4H swing low at 98.100 as SL
⚖️ Adjust based on your lot size and number of open positions
🚨 Don't rush to set SL for Buy Stop entries before confirmation! Patience is part of the plan. 😎
🎯 TARGET – “Mission Objective”
💰 First Exit Target: 100.000
🏃♂️ Optional: Escape earlier near high-risk zones (Blue MA Line Trap Area)
⚔️ SCALPERS' CODE – Stay Sharp!
Only scalp on the Long side.
🔐 Use Trailing SL to guard your loot!
💸 Big wallets? Jump early.
🧠 Smaller stack? Follow the swing crew for coordinated execution.
🌐 MARKET OUTLOOK: WHY THE VAULT’S OPENING
💡 Currently seeing bullish momentum in the DXY
📈 Driven by macroeconomics, sentiment shifts, and intermarket pressure
📰 Want the full debrief? Check our analysis across:
COT Data
Geopolitics & News
Macro Trends & Sentiment
Fundamental Forces
📎🔗 See full breakdown
⚠️ TRADE MANAGEMENT ALERT
🚫 Avoid opening new trades during high-impact news
🔁 Always use Trailing Stops to lock in profits
❤️ Support The Heist – Boost the Plan!
Every boost powers our underground crew 🐱👤.
We rob the markets, not the people. 💼💰
Like & Boost to help grow the Thief Trading Gang 👊💥
Stay tuned, robbers – more heist plans dropping soon.
💸🚀📈🤑

DXY Bullish Reversal Setup Toward 98.20 Target Entry Point
Marked at: ~97.200
The price has already reacted multiple times around this level, suggesting it's a key support zone.
🛑 Stop Loss
Placed at: ~96.930
Just below the support zone, protecting against a breakdown below recent lows.
This implies a risk of about 27 pips from the entry.
🎯 Target Point (TP)
Marked at: ~98.201
Strong resistance zone from previous price action.
Target implies a potential reward of 100+ pips, offering a risk-reward ratio (RRR) of ~3.7:1, which is favorable.
📊 Resistance Area
Around 97.419–97.465
This is the first obstacle the price must break through to confirm bullish continuation.
The 200 EMA (blue curve) is currently acting as dynamic resistance, aligning near this zone.
📉 Indicators
Moving Averages:
Red: Likely 50 EMA
Blue: Likely 200 EMA
Price is currently below both EMAs — so trend is still bearish, but trying to shift.
📌 Strategy Insight
The setup anticipates a bullish reversal from 97.200, aiming for a breakout above the 200 EMA and resistance to reach the 98.201 zone.
For confirmation, watch for a strong bullish candle close above 97.465, which would validate upside continuation.
⚠️ Risks
Price is still under both moving averages → downward momentum may persist.
If support at 97.00 breaks, downside acceleration could occur.
✅ Conclusion:
This is a bullish breakout setup on DXY with:
Defined entry and stop-loss.
Clear target.
High RRR.
But it’s crucial to wait for confirmation above resistance (97.465) before full conviction on the long trade.

DXY BANK VAULT BREAK-IN: Your Dollar Index Profit Blueprint🚨 DXY BANK HEIST: Dollar Index Breakout Robbery Plan (Long Setup) 🚨
🌟 Hi! Hola! Ola! Bonjour! Hallo! Marhaba! 🌟
Attention, Market Robbers & Dollar Bandits! 🏦💰💸
Using the 🔥Thief Trading Style🔥, we’re plotting a DXY (Dollar Index) bank heist—time to go LONG and escape near the ATR danger zone. Overbought? Yes. Risky? Absolutely. But the real robbery happens when weak hands panic. Take profits fast—you’ve earned this loot! 🏆💵
📈 ENTRY: BREAKOUT OR GET LEFT BEHIND!
Wait for DXY to cross 99.300 → Then strike hard!
Buy Stop Orders: Place above Moving Average.
Buy Limit Orders: Sneak in on 15M/30M pullbacks (swing lows/highs).
Pro Tip: Set a BREAKOUT ALARM—don’t miss the heist!
🛑 STOP LOSS: DON’T GET LOCKED UP!
For Buy Stop Orders: Never set SL before breakout—amateurs get caught!
Thief’s Safe Spot: Nearest swing low (2H chart).
Rebels: Place SL wherever… but your funeral! ⚰️
🏴☠️ TARGET: 102.300 (Bank Vault Cracked!)
Scalpers: Long only! Trail your SL like a pro thief.
Swing Traders: Ride this heist for maximum payout.
💵 MARKET CONTEXT: DXY IS BULLISH (But Traps Await!)
Fundamentals: COT Reports, Fed Plays, Geopolitics.
Intermarket Sentiment: Bonds, Gold, Stocks—all connected.
Full Analysis: Check our bio0 linkks 👉🔗 (Don’t trade blind!).
⚠️ ALERT: NEWS = VOLATILITY = TRAP ZONE!
Avoid new trades during high-impact news.
Lock profits with trailing stops—greed gets you caught!
💥 SUPPORT THE HEIST (OR GET LEFT BROKE!)
Smash that Boost Button 💖→ Stronger team = bigger scores!
Steal profits daily with the Thief Trading Style. 🎯🚀
Next heist coming soon… stay ready! 🤑🐱👤🔥
