DXY(based on NEo wave)from 2500 to 4000 days I think dollar start a down trend with is corrective and after that it will start an up trend which is strong, also gold can make the bowtie diametric
Dxyanalysis

US Dollar Index (DXY) Price Value Chart TodayThe US Dollar Index, also known as DXY, is used by traders seeking a measure of the value of USD against a basket of currencies used by US trade partners. The index will rise if the Dollar strengthens against these currencies and will fall if the Dollar weakens against these currencies. Plan your technical analysis of the US Dollar Index by tracking its price in the chart and keep up with the latest market movements with news, advice pieces, and the dollar index forecast.
TVC:DXY
CAPITALCOM:DXY

DXY - Ready to skyrocket buying!This is DOLLAR INDEX (DXY) MONTHLY ANAYLSIS..
DXY Imminent Skyrocket
Price is buying from Panic Zone (0 -382%) INSIDE MONTHLY DEMAND ZONE (PREVIOUSLY SUPPLY ZONE)
We expect price BREAK 0% AREA (WEEKLY SUPPLY ZONE) and continue buying to TP1 A AND TP 2 B AREAS.
TRIGGER: WAIT PRICE BREAK 0% AREA (104.620)
When it's triggered, I suggest to open BUY POSITIONS on USD parallel pairs (USD/JPY, USD/CAD, USD/CHF)
and SELL POSITIONS on opposite (EUR/USD, GBP/USD, BTC/USD)
BULLISH INTERNAL CYCLE - WEEKLY ANALYSIS.
- TP 1 - AREA A: 50 - 61.8 % (109.719 - 110.923)
- TP 2 - AREA B: 100 % (114.819)
- FINAL DESTINATION: MONTHLY SUPPLY ZONE (RED AREA ABOVE)

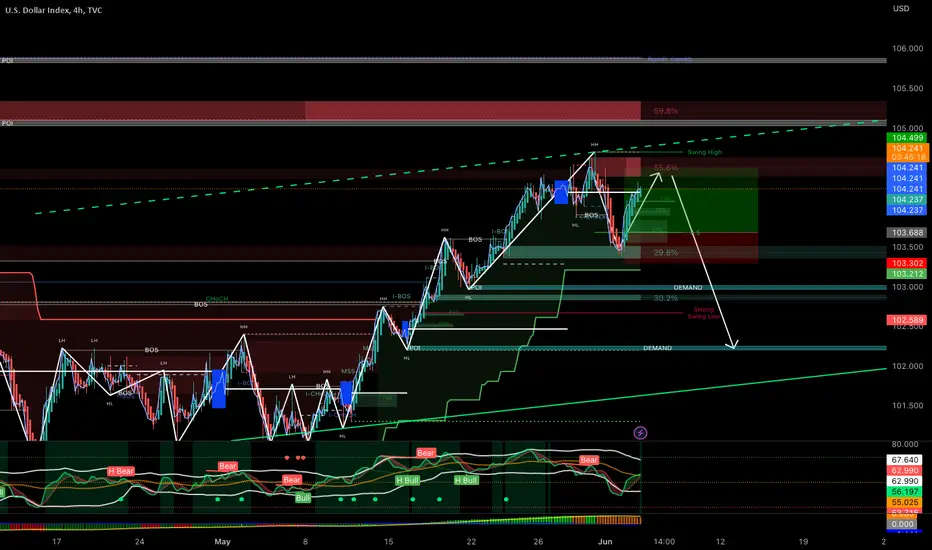
DXY - Catch the NEXT xxxUSD massive rally DXY is currently on a SHORT-TERM bearish trend and right, all scenarios point to BEARS at full strength. We expect the next impulse leg to happen around the
Baseline when this criteria is met, we expect LONG opportunities on xxxUSD pairs. Do nothing until DXY is ready.
INVALIDATION
iF DXY manage to fix ABOVE the Previous Week High level, wait for a pullback to exit LONGS on xxUSD
TARGETS
If the SHORT gets triggered, we are looking at a possible TARGET to be around PMth.5 on the HOOD DUITE indicator.
P.S I trade with literally zero complicated analysis and still maintain 90% HIT RATE on my LIVE TRADES and ideas.

DXY gain from trendline 📖🚀Hello 🐋
Based on the chart, the price is close to the support area and channel support ✔️
if
the price doesn't break the support zone to the downside, we can see more gain 💣🚀
otherwise
we can see more correction ❌🧨
👌 Notice: pay attention to the price on shortcut chart (located above the main chart with black colour) 📖💡
Please, feel free to share your point of view, write it in the comments below, thanks 🐋

DXY 10June2023the analysis a few days ago went well, the price went to the trendline and now looks rebound. the biggest possibility is that the price will still go down in the direction of the black arrow. if you see the bearish trendline responded positively at that time, it could be that the price will respond positively again when approaching the trendline.

Central Banks USD Reserves Drop to Record LowsI am writing to bring your attention to a concerning trend that has been emerging in the global economy. The de-dollarization movement is now evident as central banks worldwide reduce their US dollar reserves to record lows.
This trend indicates that the confidence in the US dollar as the world's reserve currency is declining. As forex traders, we must be aware of this trend and its potential impact on our investments.
The US dollar has been the dominant currency in the world for decades, but this is now changing. Countries in the BRICS (Brazil, Russia, India, China and South Africa) have been actively promoting the use of their currencies in international trade, and other countries are following suit.
As central banks reduce their US dollar reserves, its value will likely decline. This could lead to inflation and a weaker US economy. As forex traders, we need to take action to protect our investments.
I encourage you to sell the dollar and diversify your portfolio into other currencies such as the euro, Australian Dollar, etc. This will help to mitigate the risks associated with the de-dollarization movement and protect your investments.
In conclusion, the de-dollarization movement is now evident, and as forex traders, we need to take action to protect our investments. I urge you to diversify your portfolio into other currencies. Let us stay vigilant and proactive in managing our investments.

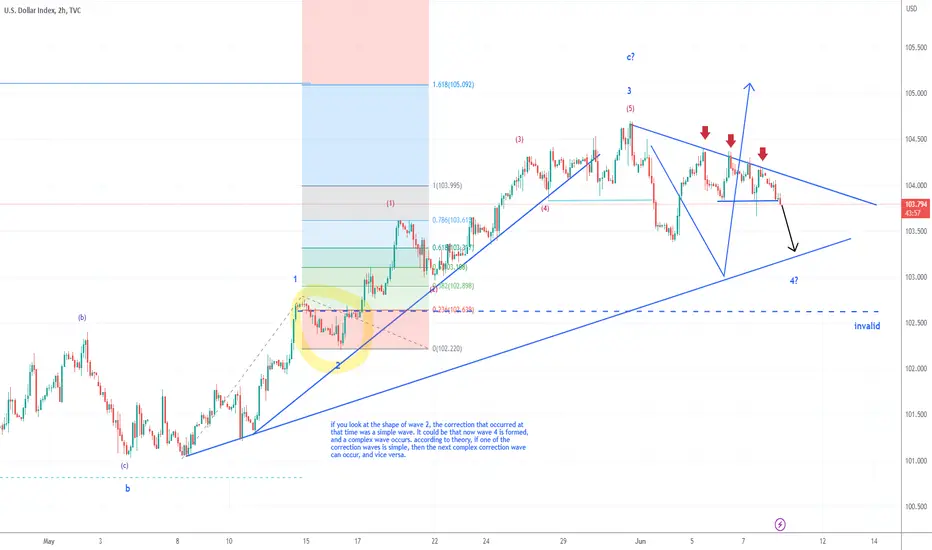
DXY 8June2023Currently the DXY seems to respond positively to the bearish trendline. the price has also broken the support. the next target is the trendline below. there are times when now is wave 4 a complex correction occurs, then we can be prepared that the price can go down quite deep going forward. the invalid area is the limit where this analysis can still be valid. when the price goes down deeper than the invalid area, then it could be that the trend has changed completely to bearish.
DXY Next Possible MovePair : DXY Index
Description :
Bearish Channel as a Correction in Long Time Frame
Break of Structure
RSI - Divergence
Symmetrical Triangle
Completed " AB " Corrective Wave
Fibonacci Level - 78.60%

DXY brief gain 🚀Hello 🐋
Based on the chart, the price is close to the support area and channel support ✔️
if
the price doesn't break the support zone to the downside, we can see more gain 💣🚀
otherwise
we can see more correction ❌🧨
👌 Notice: pay attention to the price on shortcut chart (located above the main chart with black colour) 📖💡
Please, feel free to share your point of view, write it in the comments below, thanks 🐋

DXY aka USdollar aka dollar indexdxy is still bullish at the moment i want to see price action once it pushes up towards 104.4-104.5 area if we get some bearishness there we can see a nice push down if not it will head to that 105 area but this area ia attractive for the fact it created a flip zone here retest and made a move down leaving the orderblock we are testing now
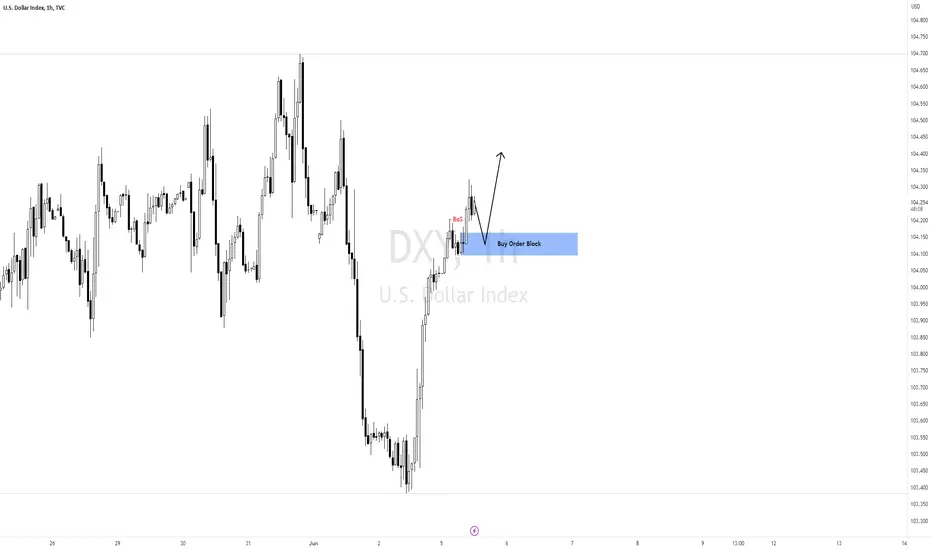
DXY Chart H1Here is my view for DXY on H1. The price could go bullish, you can put a pending order on the Order block or find an entry on LTF within OB Zone. Trade Safe!
DXY 3June2023You can see the note that I gave on the chart, the possibility of wave 4 happening later. I still believe DXY will remain bullish as long as the price does not fall deeper than the invalid area, there is a possibility that DXY will fall more than that, but there is a certain limit to how deep the price will fall.

$DXY - Keep an 👀TVC:DXY CAPITALCOM:DXY
TVC:DXY - Keep an 👀
Currently we are within the range: Lows: 100.820 Highs: 103.150
Pattern: Wedge
We are at an very interesting area when it comes to dollar! Keep your eyes wide open a break above 103 areas, we could easily go towards 105 handle. However, if we are to close below the range of 100 areas then bears are still in control. A great break out trade idea!
Keep in mind those trendlines going down.
Trade Journal

DXY Index Analyze (Road Map, 05/31/2023)!!!🗺️Hi, everyone👋.
To better understand the DXY Index roadmap🗺️, it is better to first look at the DXY weekly time frame:👇(Running well, as I expected ✅)
As you can see, the upward trend of DXY will continue.
Now, I tried to show you the DXY roadmap in the 4-hour time frame using the Elliott wave theory .
It seems that DXY is nearing the end of wave 3, and this wave can end at 🟡 Price Reversal Zone(PRZ) 🟡.
I expect the DXY to return to the first 🟢 support zone($ 103.60-$ 103.36) 🟢 after the end of wave 3 is confirmed and rise again to the top of the 🔴 heavy resistance zone($ 105.80-$ 104.53) 🔴.
U.S.Dollar Currency Index ( DXYUSD ) Analyze, 4-hour time frame⏰.
Do not forget to put Stop loss for your positions (For every position you want to open).
Please follow your strategy, this is just my Idea, and I will be glad to see your ideas in this post.
Please do not forget the ✅' like '✅ button 🙏😊 & Share it with your friends; thanks, and Trade safe.

DXYIt's not financial advice.
It's just my prediction about the future of the DXY index
Just see and Think about it.
I think it's so interesting analysis to imagine the future of DXY.
So Let's go
************************************
In the first level let me tell you more about the relationship between DXY and the cryptocurrency market.
It is a known fact that the crypto price movements are deeply correlated with the DXY Index since its inception. While the DXY index gets stranger, Bitcoin, Ethereum, and many other assets tend to fall. Besides, if the cryptos manifest their strength, then the dollar’s strength tends to fall
************************************
Hello Guys.
How are you doing? I hope you feel great and always be happy and successful.
Today, I want to show you something strange that will happen in the market.
as you see in this chart, we are in Parallel Channel and whenever the index touches the top of the channel, we expect to react. it's the third time I expect the DXY index to go up from here.
But it takes time. maybe more than 4 Months.
************************************
by the way, I should say that at the first level, we should go up to the 106 Level and stay there.
after that, we will expect to go up level by level.
the next levels are: 110-117-125 and maybe 132
who knows !!! maybe 132 is closer to us than we think.
************************************
Please be patient and think about that.
************************************
Please SHARE this analysis with your friends and also, FOLLOW me.
It can help you to be the first one that sees the analysis after publishing.
wish you health and wealth
Sincerely Yours
