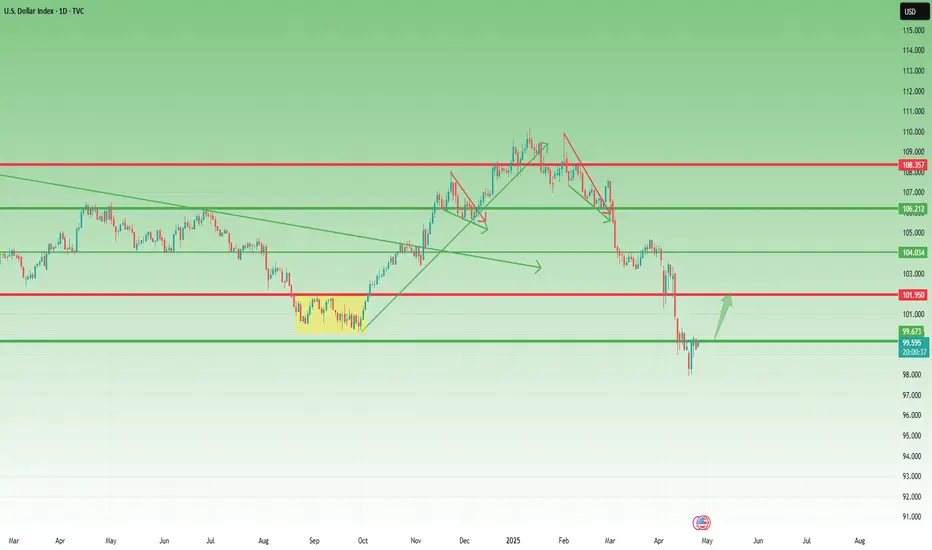
DXY Forecast: More Bearish OrderflowThis week, I anticipate further downside movement on the DXY, with price potentially reaching a key area of interest—a bullish order block. While the reaction at this level remains uncertain, my current bias remains bearish unless a break of structure to the upside signals a continuation of the bullish trend.
Dxyanalysis

Gold is forming a head and shoulders pattern!Analysis and interpretation:
Gold prices have been on a strong upward trend since the beginning of 2025. The daily chart shows that gold prices have climbed from around $2,600 to around the $3,500 mark. Recently, gold prices have formed a consolidation trend in the range of $3,260 to $3,380, indicating that the bulls and bears are fighting fiercely here. It can be seen from the K-line chart that gold prices fell back after hitting a record high of $3,499.83 in April, but then gained support and rebounded at $3,260.
The Bollinger Band indicator shows that the upper track is at $3,465.75, the middle track is at $3,191.92, and the lower track is $2,918.08. The current price is running between the upper and middle tracks, indicating that the medium-term upward trend is still maintained. Although the gold price may fluctuate in the range of $3,260 to $3,380 in the short term, the overall upward trend has not changed.
The MACD indicator shows that DIFF is 81.35, DEA is 84.74, and the MACD value is -6.80. The histogram shows a shrinking state, indicating that the upward momentum has weakened, but no obvious short signal has been formed. The RSI indicator is around 58.81, which is in the neutral to strong area, and has not reached the overbought or oversold level, and there is still room for growth.

Gold falls as expected, awaiting guidance from ADPGold continued to fluctuate in 1 hour. Now, the gold fluctuation is most likely a relay of decline. Gold rebounds and continues to be short. The gold 1-hour moving average gradually begins to stick together, but it is still diverging downward. If it continues to cross downward to form a dead cross, then there is still room for gold shorts to fall. Gold hit a high twice and was suppressed by the 3330 line. Today, gold continued to be short at highs under the pressure of 3330.
Gold bulls continue to rebound every time. Now gold bulls obviously have no confidence in further rise, so gold shorts take the opportunity to exert their strength. Gold is still the home of shorts, and gold rebounds and continues to be short.
US trading operation ideas:
Gold 3320 short, stop loss 3330, target 3300-3290;

Gold maintains a volatile range, pay attention to subsequent breOn Tuesday, the gold price generally showed a downward trend. The highest price rose to 3348.45 on the day, and the lowest price fell to 3299.49, closing at 3316.95. On Tuesday, gold was under pressure during the early trading session, and then the price continued to fluctuate during the European and US trading sessions. Overall, the price is still running within the fluctuation range, but once the daily support is broken, it is expected to break the lower edge of the range.
From the multi-cycle analysis, first observe the monthly rhythm. The price rose for three months before and then a single-month correction occurred. Recently, it has risen for four months and then a single-month correction occurred. Therefore, according to the rhythm, April is generally bullish, but for May, we must pay attention to market risks. From the weekly level, the gold price is supported by the support level of the 3040 area. So from the perspective of the mid-line, we can continue to maintain a bullish view. From the daily level, the current price is supported by the 3004 area support. This position is the key watershed of the band trend. The market will further break down in the future, so it will be focused on in the future. At the same time, for the short-term four-hour price, it has been fluctuating up and down at the four-hour key position recently. Pay attention to the resistance of 3387 and 3370 on the top, and the 3260 area on the bottom. Before the data, the market as a whole tends to fluctuate temporarily. After breaking through the daily support, pay attention to the performance of breaking down the lower edge of the range.

Interpretation of technical ideas for short-term gold trading onGold opened this week in a volatile market. It opened high and fell on Monday. The US market rose above the high opening position. It fell in the Asian market on Tuesday. The European and American markets fluctuated and adjusted. The main reason is that the data this week is concentrated in the second half of the week. From the past market, this week's rebound did not touch 3370, so it cannot be treated as strong. It did not fall below the bottom support of 3260. The overall trend is convergent and volatile. Now the technical indicators are in a sticky posture, and the three lines of the Bollinger Bands are also closed. The Asian market mainly focuses on the continuation of volatility. The upper side focuses on the resistance of the hourly Bollinger Band upper rail 3330, and the lower support is at 3300.
Pay attention to the operation of the range at noon. If the gold price touches 3300 below, participate in long orders with a light position. With a small loss, look at the target of the upper rail pressure of the Bollinger Band at 3330; if there is a rebound before the European market that touches the upper rail of the Bollinger Band at 3330, you can try to arrange a short position to be bearish, and the target is whether 3300 can be broken. The small non-farm data will be released before the U.S. market opens, followed by the PCE data. At that time, I will re-position my position based on the data release and wait for the data release to help gold prices move out of the range of volatility.

Gold's shock trend and interpretation of US market thinkingGold continues to fluctuate, we continue to look down in the European session, try long orders near 82;
2025-4-29 Tuesday Gold Asia-Europe long and short strategies
The market is always changing, the only constant is the existence of risks.
Keeping the principal is always the first principle.
◆Short order◆
Aggressive: short near 3356, stop loss 7 points, short at 62-68 after breaking,
Stop loss: stop loss 7 points each, or unified stop loss 77. Target: 3286-69-54-42, continue to reduce holdings after breaking
◆Long order◆
Aggressive: long at 82, stop loss 7 points, long at 75-70 after breaking,
Stop loss: stop loss 7 points each, or unified stop loss 62. Target: 98-06-12, continue to reduce holdings after breaking;
Steady: 66 long, stop loss 7 points, 58-52 long after breaking,
Stop loss: 7 points for each stop loss, or a unified stop loss of 42. Target: 98-06-12, continue to reduce holdings if the position breaks;
【Today's long orders must be promptly protected after profit, and the next position will be entered after the principal is protected】
Stop loss is determined according to your actual tolerance. Protect in time after profit, and enter the next position after protection】
★ Pattern analysis and attention:
Daily strategy ideas: Asia and Europe, our current price 06 long orders are also given to around 22 as expected. We are still bearish if the resistance is not broken, and try 82 long orders
【Reference: Russia-Ukraine peace talks, US-Japan tariff negotiations】
【Data: wholesale inventory rate, consumer confidence index, job vacancies】
☆ There is a delay in posting, and the final operation is based on real-time strategy and current price orders. Please continue to pay attention;
☆ Strategy orders are divided into warehouses, and the total position shall not exceed 20%;

Risk aversion eases, gold continues to fluctuateSpot gold prices (XAU/USD) fluctuated and fell, approaching the $3,300 mark, continuing the weak trend of the previous trading day.
From the daily chart, gold prices have fallen from their historical highs and are currently approaching the 38.2% Fibonacci retracement level (US$3,300-3,290). The key support level below is concentrated in the $3,265-3,260 range, which is also the previous consolidation range. If it falls below, it will open up the space for a 50% retracement level (US$3,225) or even $3,200.
In terms of technical indicators, the MACD indicator shows signs of a dead cross, and the green kinetic energy column expands moderately, indicating that short-term bears still have the initiative; the RSI indicator is still oscillating near the 50 axis, and has not yet shown extreme oversold, indicating that the downside space may be limited. Once the price rebounds, the initial resistance above is seen at $3,348-3,353.
After the breakthrough, it is expected to re-challenge the $3,400 mark, and even attack $3,425-3,427.
If the US PCE inflation and non-farm data weaken this week, it will further support the re-entry of gold bulls.

Interpretation of the short-term operation ideas of shopping4-hour trend will not hit the high point within this 4-hour period, so currently we can focus on the morning high point and yesterday's high point 3348-3353. Currently we can focus on the support near 3316.
First point: After the 4-hour high closed with a small positive column yesterday, a big negative column fell in the morning, indicating that the price will continue to bottom out in the short term. Therefore, we can arrange short orders below yesterday's high point 3353-3348 in the white session, so 3340-44 is the best shorting point.
Second point: Because the price rose to 3336 after yesterday's high of 3302 and only retreated to 3319, the support of 3316-17 still exists. The point we focus on in the Asian and European sessions is when 3316-17 will break.
Third point: In the event of an accident, the price directly pulls back and breaks the high point, then the next short position is 3370-72; I think this probability is small. Then if it breaks 3315-16, we need to find a low position to go long. Then 3300-3288 and 3273 in yesterday's Asian and European sessions are the long positions. We can use small stop losses to bet on long positions.
Strategy:
Short at 3340-44 during the Asian session, defend at 3353, target at 3330-3320, break at 3315 and target at 3300-3290
Short at 3370-72, defend at 3378, target at 3350
After breaking 3315, short at 3300-328-3276 with a small stop loss of 5-6 US dollars, target at 3305-3350-70

Gold fluctuates within a wide range, and may stop falling as it On Tuesday, gold trading relied on the 3310 support level to directly go long, and the near-point pressure area of 3360/80 was bullish. The long logic of gold as a "safe haven trump card" is beyond doubt. The small cycle adjustment is only the accumulation stage. Once it starts to explode, it will be unstoppable. Recently, when gold touched 3500 again, there was a market view of "suspected top". It is recommended that all investors maintain their composure-the short-term adjustment is insignificant compared to the entire rising cycle. This time, the price retreated from 3500 and corrected by about US$240, which is still within a reasonable range relative to the previous increase. It is emphasized again that it is not recommended for investors to be bearish on gold in the long term, or to subjectively determine that 3500 has become the top. Such psychology is prone to trading deviations and even breeds a dangerous mentality of short orders to bear losses, which is the root cause of long-term losses.
In the early trading of the day, a 3310 long strategy has been deployed, and it is suggested that 3315 can be entered into the long position during the trading session. The current position is in market fluctuations. The current uptrend will first focus on the recovery of the 3340/45 line, and the opening price pressure level should be paid special attention to, especially during the Asian and European sessions. If the Asian and European sessions maintain a shock correction pattern, the support level will continue to be relied on for game play; if the uptrend effectively breaks through 3340/45 and stabilizes, the handover period between the European and American sessions is expected to explode to the 3380 line, or even challenge a higher price range.

USD/JPY 1H Chart AnalysisStructure: Bullish, with higher highs (H1) and higher lows consistently forming.
Key Zone: A demand zone around 143.00 – 143.20. Price could pull back here for liquidity before continuing higher.
Current Price: Consolidating near 143.70 after a strong impulse.
Bias: Bullish, as long as price holds above 143.00. Watching for a possible dip into demand before resuming the uptrend toward 144.20 highs.

Gold fluctuates at high levels, waiting for adjustmentGold fell back after a cyclic rise in the morning, and the price lost today's starting point. The current position is near the starting point of Friday! If the Asian session cannot bottom out and rebound, then we must be careful of further declines to 3260 in the European session to test around 3230. This position will not be reached soon, but after the loss of the key position, the momentum below will gradually open up, so today the long position is at 3260.
This week's data reference: Wednesday's ADP employment report, Friday's non-agricultural data
Recent fundamental news is complicated, and the fluctuations in the past two weeks are relatively large compared to before. The fluctuations in a single day will basically exceed 100 US dollars, so we must pay attention to strict loss control in operations.
Intraday view: After a short-term retracement, the first pressure level: 3315-17 top and bottom conversion position Strong pressure focus: 3337-43
If it can't reach the support, it's still at 3260. If it breaks down, the US session will look for a position to fall back.

Price Action + Fundamentals Point to Dollar StrengthThe current market environment presents compelling evidence for a bullish move in the US Dollar Index (DXY). While some patience is required, the setup is increasingly favorable for the dollar to appreciate in the coming weeks and months.
Key Factors Supporting a Bullish Move:
Monthly Close Above 100.160:
A critical technical level to monitor is the monthly close above 100.160. If achieved, it would signal a strong bullish breakout, setting the stage for a continuation higher. Given current price action and market dynamics, this scenario looks highly probable. However, if the price fails to close above 100.160 and instead breaks below it, we could potentially start looking for short opportunities.
Bond Market Strength (30Y, 10Y, 5Y):
This past week, we witnessed notable strength across the US bond market. Yields declined as prices rose, typically a positive signal for the dollar as it reflects capital inflows into US assets.
COT Report Insights:
The Commitment of Traders (COT) report reveals a critical shift: commercial traders, often considered the "smart money," are beginning to accumulate long positions in the dollar. This change in positioning historically precedes significant bullish moves.
Seasonal Patterns:
Seasonality also favors the dollar during this period. Historically, the dollar tends to strengthen in the mid-year months, aligning perfectly with the current technical and fundamental landscape.
Targets:
Initial Target: 106.120
Given the accumulation signs and supportive macro backdrop, a move towards 106.120 seems very realistic.

Next week's ups and downs analysis and operation ideasGold closed with a long upper negative line in the weekly chart last week, and retreated to the lowest level of 3260 after being under pressure at the integer level of 3500. So can the decline continue next week?
First, let's look at a few weekend fundamental news: The Federal Reserve's financial report said that global trade wars and policy uncertainties are the biggest risks to financial stability, and have also led to concerns about the value of the US dollar in most countries. Secondly, the Federal Reserve officials made remarks that interest rates may be cut in June, and the geopolitical situation has become unstable, which has also provided some support for the price of gold in the short term.
Technical aspect: The bald positive line closed on Friday's 4-hour and 1-hour lines. If it opens flat at the beginning of the week, it is likely to continue the recent morning cycle recovery rhythm. Note: After the daily level suppressed the decline of 3500, it has been fluctuating in a large range for three consecutive trading days.
The upper and lower edges are relatively clear 3385-3260. According to the recent morning cycle recovery rhythm, the bullish momentum will basically be released before 10 o'clock. Therefore, if the market cannot continue to rise after 10:00 at the beginning of the week, the European session will continue to fluctuate downward. In particular, it cannot break through the upper edge of the daily oscillation cycle before 3385.
Operation: Open flat at the beginning of the week. Short-term support focuses on 3300. Strong support: 3260-70
Pressure level: Gains and losses of key pressure near 3385

Interpretation of ideas after gold opensTechnical pattern: This week, gold closed in a "shooting star" pattern, which is a common peak signal, indicating that the price of gold may face a correction or decline.
Influence of news: This week, affected by Trump's tariffs and dismissal of Powell, gold first hit a record high of 3500 due to its safe-haven properties. Then Trump's remarks changed, and the price of gold plunged from the high point to around 3260. Overall, it ended in a volatile situation under the uncertainty of tariffs, Powell's stay and interest rate cuts. If there are no new safe-haven factors in the market news, there is room for further decline in the price of gold.
Short-term trend analysis
Four-hour level: After the safe-haven, the price of gold rebounded at the low point of 3260, but was unable to continue near 3370. It is believed that the high-level selling repair and low-level buying intervention have affected it. The opening of the gold price next week may continue to fall.
Hourly level: Since the decline in the price of gold, the rebound strength has been insufficient. It rebounded twice near 3260 below, and the overall center of gravity was downward before crossing 3380. Next week, pay attention to the 3330-3346 range to determine the nature of the rebound at the end of this week. At the same time, pay attention to whether 3260 can be broken. If there is a break, you can look down to 3221.
Operational suggestions: Overall, the overall idea for next week will continue to be bearish. Pay attention to the resistance of the 3330-3346 range on the top, and try to go short if it is touched; the initial support below is 3260, and the bearish trend can continue to 3221-3219 if it breaks.
Suggestions for being stuck at high positions: For investors who are standing guard at high positions, if they can withstand the pullback of gold prices, they can continue to hold and wait for the return of their capital; if not, it is recommended to recognize the loss and leave the market first, and then enter the market after the gold price has adjusted to the right level.

DXY USD INDEX FORECAST Q2 W18 Y25DXY USD INDEX FORECAST Q2 W18 Y25
Professional Risk Managers👋
Welcome back to another FRGNT chart update📈
Diving into some Forex setups using predominantly higher time frame order blocks alongside confirmation breaks of structure.
✅ U.S. dollar index is a measure of the value of the dollar against a basket of six foreign currencies.
✅The currencies are the Euro, Swiss franc, Japanese yen, Canadian dollar, British pound, and Swedish krona.
💡Here are some trade confluences📝
✅ Break an d close below July 2023 key 100.00 levels.
✅ Foresee a pull back to, weekly imbalance, daily order block, daily 50ema, weekly order block and or weekly 50 ema.
✅ Awaiting to identify a significant break of structure bullish to use the DXY as confluence for our trading week 18 of Q2 toward key points of interest mentioned above.
✅ Forecasting continued bearish pressure long term.
✅Initially bullish outlook however upon price turn around. DXY to break 100.000 level again.
🔑 Remember, to participate in trading comes always with a degree of risk, therefore as professional risk managers it remains vital that we stick to our risk management plan as well as our trading strategies.
Pairs to look out for -
EURUSD
USDCHF
USDJPY
USDCAD
GBPUSD
📈The rest, we leave to the balance of probabilities.
💡Fail to plan. Plan to fail.
🏆It has always been that simple.
❤️Good luck with your trading journey, I shall see you at the very top.
🎯Trade consistent, FRGNT X

DXY TRADING SETUPDXY TRADING SETUP
Confirmation are in sight!
Get ready for a potential DROP!
Stay tuned for updates and confirmation signals!

The gold weekly line is about to close and the short position coThe downward trend remains unchanged!
At the same time, after the current decline in gold, traders who have positions above should pay attention that the early morning rebound cannot exceed the stage pressure of 3292-3300. The larger the rebound, the weaker the downward momentum. After a continuous decline, the 3260 position can be seen below. After breaking, the 3230 point needs to be paid special attention to below. This is the golden section position of 50% retracement since the rise from 2956 to 3500 in this round. It is also a multiple resonance area in the trading concentration area. After reaching this point, traders who hold short positions should consider being more cautious.

4.25 gold short-term operation technical analysis!Spot gold suddenly fell sharply during the Asian session on Friday (April 25). At the end of the session, the current gold price was around $3,307/ounce, a plunge of more than $40 during the day.
Gold prices turned lower on Friday as hopes of a trade deal between China and the United States weakened safe-haven assets. The positive risk tone weakened the demand for safe-haven assets. In addition, optimistic US macroeconomic data on Thursday supported the dollar, which also hit gold prices.
Cleveland Fed President Hammack made it clear in an interview on Thursday that the Federal Reserve has basically ruled out the possibility of a rate cut in May. But she also released key information that if there is clear evidence of the direction of the economy, there is room for policy action in June.
Gold prices are currently supported near the $3,300/ounce mark, which is also the 38.2% Fibonacci retracement level of gold prices from this month's low (around $2,950/ounce) The latest round of gains is located.
If gold price falls below the $3300/oz mark, the next support for gold price is the weekly low near the $3260/oz area; if it falls below the above area, gold price may accelerate its decline and fall to the 50% retracement level (i.e. the area near $3225/oz) and finally fall to the $3200/oz mark. Some follow-up selling will indicate that gold has peaked and turn the short-term bias in favor of bearish traders.
Gold price resistance is around the $3368-3370/oz area, which should be a key level now. If it breaks through the above area, gold price may return to the $3400/oz mark. The subsequent rise may push gold price further to the $3425-3427/oz barrier. Once this barrier is overcome, bulls may retry to conquer the psychological $3500/oz mark.

Confrontation between India and Pakistan pushes for risk aversioYesterday, the gold market opened at 3291.1 in the morning and then the market rose directly. The daily line reached a high of 3367.7 and then fell under pressure. The daily line finally closed at around 3345, and the daily line closed with a long upper shadow line. After this pattern ended, the short positions at 3496, 3468 and 3442 this week were reduced and the stop loss was followed up at 3400.
SELL: 3340 Stop loss: 58
TP1: 3330
TP2: 3320
TP3: 3305
BUY: 3300 Stop loss: 3295-92
TP1: 3320
TP2: 3335
TP3: 3360
We will update regularly every day to introduce how we manage active thinking and settings. Thank you for your likes, comments and attention. Thank you very much

USD Index: A Possible Reversal in Sight?Since early February, right after Trump’s inauguration, the USD Index (DXY) has been under pressure, falling sharply by over 10%.
However, after hitting the 98.00 level, things seem to have stabilized. We're seeing the early signs of a relief rally.
🔍 Technical Perspective:
- This week’s candlestick pattern suggests a bullish reversal.
- The dip on Wednesday was quickly bought, showing buyer interest.
- A minor correction occurred yesterday, but dips are being well supported.
- Currently, the DXY trades around 99.60, just under the psychological level of 100.
🎯 Outlook:
As long as 98 remains intact, the bias shifts towards a potential rebound.
First target: 102 – a logical resistance zone and prior support.
This is not yet a confirmed trend reversal, but the price action is shifting. The key now is how the market reacts around the 100 level. A break above could trigger further bullish momentum.
Gold fluctuates in a wide range, and the short-term trend is upwGold fell by $240 in two trading days, but the rebound was also very fierce, from yesterday's low of 3260 to 3367 in the early trading. The current volatility is still very large. The high and low points of $100 often appear, and it is normal to fluctuate by dozens of dollars. So pay attention to the market. There is no shortage of opportunities. Just grab what you can grasp.
The daily cycle has stepped back to the MA10 position. It has entered a critical stage. If the bulls recover, the strong rhythm is still there. It is too early to say that the peak has been reached. Pay attention to follow the market and don't be stubborn. The short-term resistance is 3386 and the 618 position of the decline and rebound is 3408. It is recommended to wait and see in the European session and look at the trend. Intervene in the US session.

DXY "Dollar Index" Market Bullish Heist Plan (Day or Swing)🌟Hi! Hola! Ola! Bonjour! Hallo! Marhaba!🌟
Dear Money Makers & Robbers, 🤑 💰💸✈️
Based on 🔥Thief Trading style technical and fundamental analysis🔥, here is our master plan to heist the DXY "Dollar Index" Market. Please adhere to the strategy I've outlined in the chart, which emphasizes long entry. Our aim is the high-risk ATR Line. Risky level, overbought market, consolidation, trend reversal, trap at the level where traders and bearish robbers are stronger. 🏆💸"Take profit and treat yourself, traders. You deserve it!💪🏆🎉
Entry 📈 : "The heist is on! Wait for the MA breakout (99.900) then make your move - Bullish profits await!"
however I advise to Place Buy stop orders above the Moving average (or) Place buy limit orders within a 15 or 30 minute timeframe most recent or swing, low or high level for Pullback entries.
📌I strongly advise you to set an "alert (Alarm)" on your chart so you can see when the breakout entry occurs.
Stop Loss 🛑: "🔊 Yo, listen up! 🗣️ If you're lookin' to get in on a buy stop order, don't even think about settin' that stop loss till after the breakout 🚀. You feel me? Now, if you're smart, you'll place that stop loss where I told you to 📍, but if you're a rebel, you can put it wherever you like 🤪 - just don't say I didn't warn you ⚠️. You're playin' with fire 🔥, and it's your risk, not mine 👊."
📍 Thief SL placed at the nearest/swing low level Using the 1H timeframe (98.900) Day / Swing trade basis.
📍 SL is based on your risk of the trade, lot size and how many multiple orders you have to take.
🏴☠️Target 🎯: 101.400 (or) Escape Before the Target
🧲Scalpers, take note 👀 : only scalp on the Long side. If you have a lot of money, you can go straight away; if not, you can join swing traders and carry out the robbery plan. Use trailing SL to safeguard your money 💰.
💰💵💸DXY "Dollar Index" Market Heist Plan (Swing/Day Trade) is currently experiencing a Bullish trend.., driven by several key factors.☝☝☝
📰🗞️Get & Read the Fundamental, Macro, COT Report, Geopolitical and News Analysis, Sentimental Outlook, Intermarket Analysis, Index-Specific Analysis, Future trend targets with Overall outlook score... go ahead to check 👉👉👉🔗🔗
⚠️Trading Alert : News Releases and Position Management 📰 🗞️ 🚫🚏
As a reminder, news releases can have a significant impact on market prices and volatility. To minimize potential losses and protect your running positions,
we recommend the following:
Avoid taking new trades during news releases
Use trailing stop-loss orders to protect your running positions and lock in profits
💖Supporting our robbery plan 💥Hit the Boost Button💥 will enable us to effortlessly make and steal money 💰💵. Boost the strength of our robbery team. Every day in this market make money with ease by using the Thief Trading Style.🏆💪🤝❤️🎉🚀
I'll see you soon with another heist plan, so stay tuned 🤑🐱👤🤗🤩

Gold profit taking continuesThe gold market opened at 3337.5 yesterday due to the profit-taking of the previous day. After the market fell back to 3315.6, the market rose strongly to fill the gap. The daily line reached a high of 3386.7 and then fell strongly. The daily line reached a low of 3259.6 and then the market consolidated at the end of the day. The daily line finally closed at 3287.9 and the market closed with a long upper shadow line. After this pattern ended, today's market continued to be empty. In terms of points, the short positions at 3496, 3468 and 3442 the day before were reduced and the stop loss was followed up at 3400.
SELL:3340 45 50 Stop loss: 55
TP1:3330
TP2:3320
TP3:3300
