"DXY Dollar Index" Market Bullish Heist Plan (Day/Swing Trade)🌟Hi! Hola! Ola! Bonjour! Hallo! Marhaba!🌟
Dear Money Makers & Robbers, 🤑 💰💸✈️
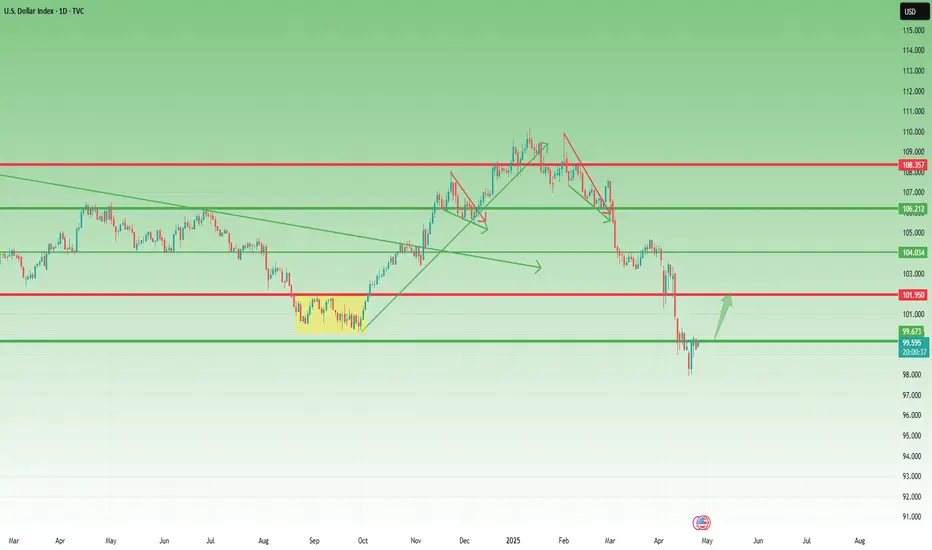
Based on 🔥Thief Trading style technical and fundamental analysis🔥, here is our master plan to heist the "DXY Dollar Index" Bank Heist. Please adhere to the strategy I've outlined in the chart, which emphasizes long entry. Our aim is to escape near the high-risk ATR Line Zone. It's a Risky level, overbought market, consolidation, trend reversal, trap at the level where traders and bearish robbers are stronger. 🏆💸"Take profit and treat yourself, traders. You deserve it!💪🏆🎉
Entry 📈 : "The heist is on! Wait for the Crossing previous high (100.400) then make your move - Bullish profits await!"
however I advise to Place Buy stop orders above the Moving average (or) Place buy limit orders within a 15 or 30 minute timeframe most recent or swing, low or high level for Pullback entries.
📌I strongly advise you to set an "alert (Alarm)" on your chart so you can see when the breakout entry occurs.
Stop Loss 🛑: "🔊 Yo, listen up! 🗣️ If you're lookin' to get in on a buy stop order, don't even think about settin' that stop loss till after the breakout 🚀. You feel me? Now, if you're smart, you'll place that stop loss where I told you to 📍, but if you're a rebel, you can put it wherever you like 🤪 - just don't say I didn't warn you ⚠️. You're playin' with fire 🔥, and it's your risk, not mine 👊."
📍 Thief SL placed at the nearest/swing low level Using the 2H timeframe (99.000) Day/swing trade basis.
📍 SL is based on your risk of the trade, lot size and how many multiple orders you have to take.
🏴☠️Target 🎯: 102.300
🧲Scalpers, take note 👀 : only scalp on the Long side. If you have a lot of money, you can go straight away; if not, you can join swing traders and carry out the robbery plan. Use trailing SL to safeguard your money 💰.
💰💵💸"DXY Dollar Index" Bank Money Heist Plan is currently experiencing a bullishness,., driven by several key factors. .☝☝☝
📰🗞️Get & Read the Fundamental, Macro Economics, COT Report, Geopolitical and News Analysis, Sentimental Outlook, Intermarket Analysis, Index-Specific Analysis, Future trend targets with Overall outlook score... go ahead to check 👉👉👉🔗🔗🌎🌏🗺
⚠️Trading Alert : News Releases and Position Management 📰🗞️🚫🚏
As a reminder, news releases can have a significant impact on market prices and volatility. To minimize potential losses and protect your running positions,
we recommend the following:
Avoid taking new trades during news releases
Use trailing stop-loss orders to protect your running positions and lock in profits
💖Supporting our robbery plan 💥Hit the Boost Button💥 will enable us to effortlessly make and steal money 💰💵. Boost the strength of our robbery team. Every day in this market make money with ease by using the Thief Trading Style.🏆💪🤝❤️🎉🚀
I'll see you soon with another heist plan, so stay tuned 🤑🐱👤🤗🤩
Dxyforecast

DXY LONG/BUYBy utilizing Fibonacci retracement levels, historical patterns, , we can formulate a hypothesis that the market might follow a similar trajectory if bullish sentiment prevails.

DXY weekly outlookWeekly analysis for DXY: the broader bias remains bullish. I expect price to respect the stacked 3‑hour demand zones, with the lower zone likely providing the stronger reaction.
After that bounce, a short‑term bearish pullback could unfold from the 4‑hour supply zone. Although I don’t trade the dollar directly, I track DXY for its correlations with other pairs to add confluence and strengthen my setups.

US DOLLAR Analysis: Bullish Momentum Building?TVC:DXY is finally showing signs of stabilization. The index has successfully rejected a key support level, an area where price has historically attracted strong buying interest. This level closely aligns with the psychological $100 mark, which has once again acted as a pivotal point for market participants, reinforcing its relevance as a key technical level.
The recent price action confirms bullish interest, as evidenced by a strong rejection pattern within the zone, with long lower wicks and bullish follow-through candles. The support zone held firm, and buyers have stepped in, initiating an upward move.
Now that price has bounced from this level, the probability of a continued rally increases. If the bullish momentum sustains, the price could move toward the 102.500 level, a logical near-term target based on previous structure and minor resistance.
However, a failure to maintain above the 100.00 handle or a sudden shift in sentiment could still pose downside risks. A confirmed breakdown below the green support zone would invalidate this bullish outlook and potentially open the door for further declines.
Remember, always confirm your setups and use proper risk management.

DXY Update – Bullish Correction in PlayAt the beginning of the month, I mentioned that the USD Index (DXY) could start a corrective move to the upside, with the 100 level being the critical line in the sand.
Indeed, the index managed to break and hold above this psychological and technical level, currently trading around 100.70, well above the former resistance now turned support.
My bullish outlook remains intact, and I expect the upside continuation to target the 102 zone in the coming sessions.
Conclusion: For pairs like EURUSD and GBPUSD, rallies should be sold as long as this bullish momentum holds. 🚀

US INDEX (DXY) TIME TO BUY !!!HELLO TRADERS
As i can see this chart created a harmonic pattren and it crystal clear showing the levels till it hold above our design Stop Loss Trade War Talks and NFP results with slowing down the inflation shows us that $ will recover from this zone if not break SL make a proper research befor taking any trade we appriciate your cooments and support us Stay Tuned for more updates ...

DXY Forecast: More Bearish OrderflowThis week, I anticipate further downside movement on the DXY, with price potentially reaching a key area of interest—a bullish order block. While the reaction at this level remains uncertain, my current bias remains bearish unless a break of structure to the upside signals a continuation of the bullish trend.

IMP update for all Forex Traders Expect the Dollar Index (DXY) to appreciate in the near future. However, a further decline into the green highlighted region is possible before this upward movement. The green zone represents a potential key reversal area. Monitor the following currency pairs for trading opportunities if the DXY begins to climb:
BUY - USDCAD, USDCHF, USDSGD;
SELL - EURUSD, GBPUSD

DXY USD INDEX FORECAST Q2 W18 Y25DXY USD INDEX FORECAST Q2 W18 Y25
Professional Risk Managers👋
Welcome back to another FRGNT chart update📈
Diving into some Forex setups using predominantly higher time frame order blocks alongside confirmation breaks of structure.
✅ U.S. dollar index is a measure of the value of the dollar against a basket of six foreign currencies.
✅The currencies are the Euro, Swiss franc, Japanese yen, Canadian dollar, British pound, and Swedish krona.
💡Here are some trade confluences📝
✅ Break an d close below July 2023 key 100.00 levels.
✅ Foresee a pull back to, weekly imbalance, daily order block, daily 50ema, weekly order block and or weekly 50 ema.
✅ Awaiting to identify a significant break of structure bullish to use the DXY as confluence for our trading week 18 of Q2 toward key points of interest mentioned above.
✅ Forecasting continued bearish pressure long term.
✅Initially bullish outlook however upon price turn around. DXY to break 100.000 level again.
🔑 Remember, to participate in trading comes always with a degree of risk, therefore as professional risk managers it remains vital that we stick to our risk management plan as well as our trading strategies.
Pairs to look out for -
EURUSD
USDCHF
USDJPY
USDCAD
GBPUSD
📈The rest, we leave to the balance of probabilities.
💡Fail to plan. Plan to fail.
🏆It has always been that simple.
❤️Good luck with your trading journey, I shall see you at the very top.
🎯Trade consistent, FRGNT X

USD Index: A Possible Reversal in Sight?Since early February, right after Trump’s inauguration, the USD Index (DXY) has been under pressure, falling sharply by over 10%.
However, after hitting the 98.00 level, things seem to have stabilized. We're seeing the early signs of a relief rally.
🔍 Technical Perspective:
- This week’s candlestick pattern suggests a bullish reversal.
- The dip on Wednesday was quickly bought, showing buyer interest.
- A minor correction occurred yesterday, but dips are being well supported.
- Currently, the DXY trades around 99.60, just under the psychological level of 100.
🎯 Outlook:
As long as 98 remains intact, the bias shifts towards a potential rebound.
First target: 102 – a logical resistance zone and prior support.
This is not yet a confirmed trend reversal, but the price action is shifting. The key now is how the market reacts around the 100 level. A break above could trigger further bullish momentum.
DXY "Dollar Index" Market Bullish Heist Plan (Day or Swing)🌟Hi! Hola! Ola! Bonjour! Hallo! Marhaba!🌟
Dear Money Makers & Robbers, 🤑 💰💸✈️
Based on 🔥Thief Trading style technical and fundamental analysis🔥, here is our master plan to heist the DXY "Dollar Index" Market. Please adhere to the strategy I've outlined in the chart, which emphasizes long entry. Our aim is the high-risk ATR Line. Risky level, overbought market, consolidation, trend reversal, trap at the level where traders and bearish robbers are stronger. 🏆💸"Take profit and treat yourself, traders. You deserve it!💪🏆🎉
Entry 📈 : "The heist is on! Wait for the MA breakout (99.900) then make your move - Bullish profits await!"
however I advise to Place Buy stop orders above the Moving average (or) Place buy limit orders within a 15 or 30 minute timeframe most recent or swing, low or high level for Pullback entries.
📌I strongly advise you to set an "alert (Alarm)" on your chart so you can see when the breakout entry occurs.
Stop Loss 🛑: "🔊 Yo, listen up! 🗣️ If you're lookin' to get in on a buy stop order, don't even think about settin' that stop loss till after the breakout 🚀. You feel me? Now, if you're smart, you'll place that stop loss where I told you to 📍, but if you're a rebel, you can put it wherever you like 🤪 - just don't say I didn't warn you ⚠️. You're playin' with fire 🔥, and it's your risk, not mine 👊."
📍 Thief SL placed at the nearest/swing low level Using the 1H timeframe (98.900) Day / Swing trade basis.
📍 SL is based on your risk of the trade, lot size and how many multiple orders you have to take.
🏴☠️Target 🎯: 101.400 (or) Escape Before the Target
🧲Scalpers, take note 👀 : only scalp on the Long side. If you have a lot of money, you can go straight away; if not, you can join swing traders and carry out the robbery plan. Use trailing SL to safeguard your money 💰.
💰💵💸DXY "Dollar Index" Market Heist Plan (Swing/Day Trade) is currently experiencing a Bullish trend.., driven by several key factors.☝☝☝
📰🗞️Get & Read the Fundamental, Macro, COT Report, Geopolitical and News Analysis, Sentimental Outlook, Intermarket Analysis, Index-Specific Analysis, Future trend targets with Overall outlook score... go ahead to check 👉👉👉🔗🔗
⚠️Trading Alert : News Releases and Position Management 📰 🗞️ 🚫🚏
As a reminder, news releases can have a significant impact on market prices and volatility. To minimize potential losses and protect your running positions,
we recommend the following:
Avoid taking new trades during news releases
Use trailing stop-loss orders to protect your running positions and lock in profits
💖Supporting our robbery plan 💥Hit the Boost Button💥 will enable us to effortlessly make and steal money 💰💵. Boost the strength of our robbery team. Every day in this market make money with ease by using the Thief Trading Style.🏆💪🤝❤️🎉🚀
I'll see you soon with another heist plan, so stay tuned 🤑🐱👤🤗🤩

Bearish sentiment on the USD index (DXY)TVC:DXY
On this trading week (April 14-18), we have not seen much volatility in the USD index, with its highest trading point at approximately 100.3 and lowest 99.2, partly due to a long bank holiday for Good Friday and Easter on the following Monday. On last week's Friday, price briefly tapped into the weekly demand zone and gave a quick reaction upwards to the 4-hour supply zone, which then quickly rejected and cooled price back down. Currently, price is still sitting at the lower point of the weekly range, we can expect DXY to have a very short-term push back to this strong 4-hour swap zone above, possibly creating a higher high, before pushing it back down. Price is very likely to take out the weekly lows and continue to push towards the bottom of the weekly demand zone.
On fundamentals, Bank of America's analysts had identified close relationship of its depreciating USD, with its falling US asset and equities values. Economic activities have also declined due to trade wars and huge uncertainty of the upcoming policy changes by the Trump administration; asset managers and central banks may also continue to sell USD. Besides, the US is very likely to continue reducing its interest rates in order to boost its economic activity. One of the reasons why Trump imposed high tariffs into many countries was to reduce international dependency on the manufacturing sector and trade deficits, and to attract foreign investments to set up factories in the US, in order to sell to consumers at the 'good price'. However, it is still very controversial on how effective it is, business owners abroad may perceive Trump's policies as bipolar, which changes depending on his mood, therefore, majority of businesses would rather partner elsewhere than to put themselves through this hassle. USD has also dropped 10% since the start of 2025 and has reached its lowest in three years.
References:
www.investing.com
www.cbsnews.com

Dollar index (DXY) Analysis DXY Analysis – General Outlook
This week’s analysis is more of a general overview, and it closely aligns with my view on EUR/USD. While I don’t trade DXY directly, I use it heavily as a confluence tool, so marking out its likely direction is key for aligning trades across other USD-related pairs.
At the moment, I’m favouring Scenario A, where I expect DXY to move a bit lower, accumulate, and then react from the 2-day demand zone. If that happens, we could see a bullish move on DXY, which would naturally result in bearish pressure for other pairs like EU and GU.
However, if price decides to retrace upwards first, there’s a clean supply zone that still needs to be mitigated. If that zone holds, DXY could continue its bearish structure for longer—meaning more bullish momentum across other major pairs.

DXY / Dollar Index Market Heist Plan (Scalping / Day Trade)🌟Hi! Hola! Ola! Bonjour! Hallo! Marhaba!🌟
Dear Money Makers & Robbers, 🤑 💰💸✈️
Based on 🔥Thief Trading style technical and fundamental analysis🔥, here is our master plan to heist the DXY / Dollar Index Market. Please adhere to the strategy I've outlined in the chart, which emphasizes long entry. Our aim is the high-risk Red Zone. Risky level, overbought market, consolidation, trend reversal, trap at the level where traders and bearish robbers are stronger. 🏆💸"Take profit and treat yourself, traders. You deserve it!💪🏆🎉
Entry 📈 : "The heist is on! Wait for the MA breakout (104.550) then make your move - Bullish profits await!"
however I advise to Place Buy stop orders above the Moving average (or) Place buy limit orders within a 15 or 30 minute timeframe most recent or swing, low or high level.
📌I strongly advise you to set an alert on your chart so you can see when the breakout entry occurs.
Stop Loss 🛑:
Thief SL placed at the recent/swing low level Using the 1H timeframe (103.800) Day trade basis.
SL is based on your risk of the trade, lot size and how many multiple orders you have to take.
🏴☠️Target 🎯: 105.400 (or) Escape Before the Target
🧲Scalpers, take note 👀 : only scalp on the Long side. If you have a lot of money, you can go straight away; if not, you can join swing traders and carry out the robbery plan. Use trailing SL to safeguard your money 💰.
DXY / Dollar Index Market Heist Plan (Scalping / Day Trade) is currently experiencing a bullishness,., driven by several key factors.
📰🗞️Get & Read the Fundamental, Macro, COT Report, Quantitative Analysis, Sentimental Outlook, Intermarket Analysis, Index-Specific Analysis, Positioning and future trend targets.. go ahead to check 👉👉👉
⚠️Trading Alert : News Releases and Position Management 📰 🗞️ 🚫🚏
As a reminder, news releases can have a significant impact on market prices and volatility. To minimize potential losses and protect your running positions,
we recommend the following:
Avoid taking new trades during news releases
Use trailing stop-loss orders to protect your running positions and lock in profits
💖Supporting our robbery plan 💥Hit the Boost Button💥 will enable us to effortlessly make and steal money 💰💵. Boost the strength of our robbery team. Every day in this market make money with ease by using the Thief Trading Style.🏆💪🤝❤️🎉🚀
I'll see you soon with another heist plan, so stay tuned 🤑🐱👤🤗🤩

DXY The Fake Dance- One of the most important barometers for global currencies and markets in the world.
- Most of the time DXY is a well used machine to supress markets (forex, stocks, cryptos, etc..)
- When they don't start the printing machine, DXY keeps is strength.
- When they start to print DXY starts to dip and markets boom up.
- it's really basic and based on "BRRR Machine".
- i had a hard time to decrypt this fake peace of resilience.
- actually there's none visible divergences on the 1M or 3M Timeframes.
- So i decided to push my analysis to 6M Timeframe and noticed few things :
- You can notice that from 2008 ( Post crises ), DXY was in a perma bullish trend.
- So now check MACD and will notice this fake move on January 2021 ( in graph the red ? )
- MACD was about to cross down, columns smaller and smaller, then a Pump from nowhere lol.
- i rarely saw that in my trading life on a 6M Timeframe.
- So to understand more this trend, i used ADX (Average Directional Index)
- ADX is used to determine when the price is trending strongly.
- In many cases, it is the ultimate trend indicator.
- So if you look well ADX columns, you will notice that a strong divergence is on the way.
- First check the Yellow Doted Line in July 2022 when DXY reached 115ish and look the size of the green columns.
- Now check today (red doted Line), and look again the ADX green columns is higher, but DXY diped to 105ish.
- So like always, i can be wrong, but i bet on a fast DXY dip soon or later.
- it's possible to fake pumps, but it's harder to fake traders.
Happy Tr4Ding !

DXYDXY Index
- Completed " 12345 " Impulsive Waves
- Break of Structure
- RSI - Divergence
- Bullish Channel as an corrective pattern in Short Time Frame
- Support Level

U.S. Dollar Index (DXY) – Key Resistance & Bearish Target Analys📊 Key Observations:
🔵 Resistance Zone (📍~103.5 Level)
A strong resistance area (🔵 blue box) is marked, indicating potential selling pressure if the price reaches this level.
The price is moving upwards (📈) towards this resistance, so watch for rejection or breakout.
🔵 Support/Target Zone (📍~101.5 Level)
A lower support zone (🔵 blue box) is marked as the bearish target 🎯.
If the price fails at resistance, it may head downwards (📉) to this level.
📉 Recent Price Action:
🚀 Sharp drop followed by a rebound (📈).
The price is currently moving back up (🔼), possibly forming a lower high before another drop.
📌 Exponential Moving Average (DEMA 9 - 102.488)
The price is hovering above the 9-period DEMA (📏), showing short-term bullish momentum.
If the price rejects resistance and falls below the DEMA, a bearish continuation (📉) is likely.
🚀 Potential Scenarios:
✅ Bullish Breakout: If price breaks above 🔵 resistance, it may continue rising (📈) to higher levels.
❌ Bearish Rejection: If price fails at resistance, expect a drop (📉) towards 101.5 🎯.

Gold continues to strengthen and fluctuates widely in the short Gold stabilized near the 200-period moving average at the beginning of this week, and the current upward trend is supported by the daily chart oscillator indicators. Both the daily RSI and MACD remain in the bullish range, with obvious momentum;
The upper target is concentrated in the 3167-3168 US dollar line, which is the historical high set at the beginning of this month; if it successfully breaks through this area, the gold price may enter a new upward channel.
In the short term, the support level below $3100 is concentrated in the 3065-3060 US dollar range, and a break below it will open a downward channel to $3000. The $3000 mark coincides with the 200-period moving average of the 4-hour chart, which is the key long-short dividing point;
If it falls below this point, it means that gold has entered the correction stage, and bulls need to remain vigilant; but the current fundamentals and market sentiment still strongly support the gold price to maintain high volatility.

Technical analysis of short-term operations in the US market on 4,9 US trading operation interpretation ideas:
Today, there was a bottoming out and rebound. In the morning, it first went south and then north. It fell sharply to 2970 and then quickly counterattacked 3000 after entering the Asian session! I emphasized in the morning that the gold short may be coming to an end! It will enter a short-term sharp decline and then rebound! But the current trend is obvious that today's increase has exceeded expectations!
We must beware of the possibility of a V-reversal in the US market! Although the large-scale purchase of gold caused by the selling of US bonds is still difficult to confirm the long position in the US market!
The intraday increase is close to 90 points! There may be two emotions.
1: The market impact after the tariffs are implemented has not been eliminated
2: If the bullish trend continues in the US market, it may retreat to around 3045 in the future, and continue to be bullish later!
Short-term support: 3045---3030----3000
Pressure level: 3075---3080---3100---3135

4.9 Gold price trend after the Fed meetingIn the early European session, spot gold maintained its amazing intraday gains, and the current price is around $3046/oz, up $64 on the day.
Gold's latest technical trading analysis:
Gold's recent sharp decline from its all-time high has stalled near the 61.8% Fibonacci retracement level of the February-April rally. The support level is around the $2957-2956/oz area, or the multi-week low hit on Monday, followed by the 50-day moving average (currently around $2952/oz). If gold falls below the latter, it will be seen as a new trigger by bearish traders and drag gold to the next important support level around $2920/oz, and then all the way down to $2900/oz.
On the other hand, the momentum of gold breaking through the overnight high (around the $3023/oz area) could push gold prices to the $3055-3056/oz barrier. Some follow-up buying should pave the way for gold to return to the $3,100/oz mark, with some intermediate barriers around $3,075-3,080/oz.
Support: 3,030 3,018 3,000
Resistance: 3,045 3,068 3,080
We will update regularly every day to introduce how we manage active thinking and settings. Thank you for your likes, comments and attention. Thank you very much

4.9 Technical analysis of short-term gold operations!Gold market analysis
Gold idea: We need to pay attention to whether the daily line will rise after reaching a low. The daily line is hovering at the bottom. In a volatile market, we must find a range of volatility. Finding the rhythm is the most important thing. Yesterday, the daily line formed a cross star again. Today, the white market is expected to fluctuate. In addition, there are many fundamentals in the near future. The market has been led by the rhythm. Gold rose well before. The sharp drop was also due to Trump’s tariff policy. The global tariff war is inevitable in the future. It will support the US dollar in the long term and suppress gold. The short-term top of the weekly line may be a long-term top.
Today’s idea: Let’s focus on the 2969-3022 volatility range. If the white market rebounds first and approaches 3022, go short first. On the contrary, if gold breaks and stands on 3022, it will also fluctuate, but the center of gravity of the volatility will rise to the 3000-3055 range. The volatility requires patience to wait for the position, and waiting is also part of the transaction.
Support level: 2990-2969,
Pressure: 3022 3035

4.9 gold rebound increases resistance level and continues shortiFundamentals:
On Tuesday (April 8), the price of gold fluctuated slightly higher in the early US trading. The market is currently expecting a continuous decline, and at the same time paying attention to the logic of short selling at resistance points. After briefly hitting a four-week low on Monday, the price of gold rebounded quickly and rebounded strongly to above $3,000 in the Asian and European trading on Tuesday.
Against this background, gold, as the ultimate safe-haven asset with "zero credit risk", has once again become the main allocation target of market funds. Every macro policy imbalance and external shock will bring cyclical buying to gold, and this time the intensity may be stronger. The current gold price has stabilized at the psychological level of $3,000 and is showing a short-term rising structure. From a technical perspective, the gold price in the daily chart quickly rose after stepping back on the Fibonacci 61.8% retracement level ($2,956), showing the resilience of buying. If the gold price breaks through the short-term resistance of $3,020, the upward target will be the $3,055 and $3,080 areas, and further may rise to the $3,100 mark. The key support level below is still around $2956. If it fails, it may test the 50-day moving average support (about $2947). Once this level is lost, it may trigger more technical selling pressure. The biggest variable facing the current market is no longer inflation data, but the destructive impact of Trump's tariff increase on the global trade pattern. The Fed's policy space is opening up rapidly. Driven by the expectation of interest rate cuts and risk aversion demand, gold not only stabilizes the $3,000 mark, but is also likely to re-enter the main upward trend.
Personal operation analysis:
Trend: shock trend
Support: 3000----2983------2965
Resistance: 3008-----3030-------3050
Strategy:
Viewpoint logic:
Short view near 3030, stop loss 3036, take profit near 3000----2970, and track stop loss 300 points.

4.8 Gold continues to run at a low point!Gold stabilized and rebounded on Tuesday (April 8), with an intraday increase of nearly 1%, successfully recovering the losses of the previous trading day. The rebound ended the three-day correction trend, and the gold price rebounded significantly from the key support level of $2,955. The current market focus is on the evolution of the Fed's policy path and the geopolitical trade situation. Under the interweaving of long and short factors, the short-term volatility of gold has risen significantly.
Fundamentals: The struggle between risk aversion and interest rate expectations
The rebound of gold at the beginning of this week was mainly driven by two factors:
1. The escalation of geopolitical trade risks
US President Trump's recent remarks on tariffs have triggered market concerns about the renewed tension in the global trade system.
2. The Fed's interest rate expectations fluctuated sharply
The interest rate futures market has undergone dramatic changes this week: On Monday, the market once bet that the Fed would cut interest rates five times in 2025, a significant shift from the expectation of "one or no interest rate cut" a week ago.
3. The coordination of the US dollar and capital flows
The US dollar index weakened slightly on Tuesday, reducing the cost of holding gold for non-US investors.
Technical aspect: Attack and defense of key support level
From the perspective of the market structure, the trend of gold this week showed typical "sharp drop and slow rise" characteristics:
Support confirmation: On Monday, the gold price accurately tested the support of $2955 and then rebounded. This position corresponds to the neckline of the platform that broke through in mid-March, and formed a double defense line with the 55-day moving average (US$2930). The intraday lows were densely bought, indicating that medium- and long-term investors viewed the correction as an opportunity to build positions.
Resistance distribution: The first resistance above is at US$3040 (daily line R1), and after breaking through, it may test US$3057 (March 20 pivot point) and US$3097 (R2). The historical high of US$3167 is still a psychological barrier, but it is difficult to challenge it directly in the short term.
In the short term, the trend of gold will depend on two major catalysts: 1. The minutes of the Fed's March meeting on Wednesday: If the minutes suggest an open attitude towards rate cuts, it may push gold prices to test the $3,050-3,070 range; conversely, if the emphasis is on inflation stickiness, it may trigger long profit-taking. 2. Progress in trade negotiations: Any substantive implementation or easing of tariff policies may trigger fluctuations of more than 5% in gold prices. In the medium term, the upward trend of gold has not been broken. Institutional research reports show that the current global central bank's demand for gold purchases is still at a historical high, and in the downward cycle of interest rates, the relative attractiveness of interest-free assets will continue to stand out. If the technical side breaks through $3,057, it will open up space for the impact of the previous high; the defense strength of the $2,950-2,930 area needs to be closely monitored below.
