DXY Dollar Index Next Move ?Pair : DXY Index
Description :
Divergence
Break of Structure
Rising Wedge as an Correction Pattern it will Reject from the Upper Trend Line
Completed " 12345 " Impulsive Wave
Bearish Channel with the Breakout of the UTL and Retracement
Dxyforecast

DOLLAR INDEX: Bullish context in short-medium term?Hi everyone!
There would be a lot to write about the fundamentals of the US dollar, but time is very precious so I'll just try to translate fundamental analysis into technical analysis with this hourly chart.
I hope it can be useful to someone anyway...
...trade with care! 👍
If you think that my analysis is useful, please...
"Like, Share and Comment" ...thank you! 💖
Cheers!
PS: I would also like to know your opinion about dollar index, what do you think? Post your opinion in the comments....
A.B.

dxy pull back much needed pull back here from the dollar and a retest of 104.6-104.9 would be nice for a continuation to the downside
now if thats broke we could see bulls back in play but as of now its still bearish

DXY H4 ZONE MARKINGWe have an analysis of DXY H4 zone marking
According to this analysis, we have found that Dollar is a bullish move because of price is moving above the (200MA & 50 EMA) golden cross-over price also tested the trendline 2 times for more information we marked the Demand & supply zone which is mentioned in the downside
Demand zone1@ 104.563 to 104.397
Demand zone2@ 103.676 to 103.492
Demand zone3@ 101.863 to 101.519
Demand zone4@ 100.962 to 100.761
Supply zone @ 105.536 to 105.738
With this analysis, you will be able to find your most profitable trade. EnclaveFX does not recommend that you buy or sell this assist. We do not take any responsibility for your profits & losses. EnclaveFX believes in enhancing the knowledge of our clients & followers

DXY Index Next Possible MovePair : DXY Index
Description :
Divergence
Rising Wedge as an Corrective Pattern with the Breakout of the Lower Trend Line
Break of Structure will Fall to Complete the Retest at the Previous Highs
Completed " 123 " Impulsive Waves

dxy !!dxy is here at a key level once again a break here we could see another push down to that 104.4 level first then 104.200 area and if it fails to break back up we could see continued downside
on the flip side if it holds here we could see the dollar get strong
but at the moment its still a bit bearish so there will be some nice usd trade setups

dxy deciding areai want to see how dxy plays out but if the 104.800 level holds we could see a nice move to the upside if not we will see a test of bigger time frame order block which would a nice pull back for a possible move up either way im waiting on price development market is getting ready for some nice size moves

DXY New Week SetupPair : DXY Index
Description :
Impulse Correction
Bearish Channel in Long Term as an Corrective Pattern
Break of Structure and Retracement at Daily Demand Zone
Fibonacci Level
Divergence
Bullish Channel as an Corrective Pattern in Short Time Frame
Completed " A - WXYXZ " Corrective Wave
DXY hitting resistance area & pullback (crypto rally?)Looking at my DXY zones of likely corresponding crypto effects...
At this resistance area for the DXY, I would expect some kind of short to medium term pullback over the coming days or weeks.
This would likely correspond to some level of bounce in Bitcoin, which I'm also expecting once it falls down to the $22,200 level, creating what looks like a Bull-Flag setting up.
The big question is whether we do get a deeper crash, and see the DXY push above the 105.50 range which would likely push BTC to re-test the recent lows between $15.5k and $15.5k
A DXY push above 106 would likely see Bitcoin and total crypto market cap hitting new lows, and finally see the kind of capitulation we would like to see at a true market bottom.
Thoughts and comments welcome below.

DXY - Febuary Price Action Analysis on the DailyHi guys. As everyone knows DXY is inversely related with all RIsk ASsets. We've seen the major markets and crypto start consolidating and falling in price. As the Dollar rallies.
This is on the Daily timeframe.
Ive drawn 3 trend lines which i followed closely to make sure i take profits in my trades across the boards.
First line we broke was the white trend line. Which pushed us to the next line, the red line. There was tremendous momentum seen with the size of the candles, especially the size of the one that broke out MASSIVE!
We fought that for a couple days and ended up breaking through to get to the last trend line, the Orange line which coincides with our downtrend from the September highs. This indicates we may have changed trends from downtrend.
Our next target is the white horizontal resistance line . Watch how DXY reacts here.
~Im in the camp that we will get rejected here in the short term when we reach.~
BUT if it consolidates around it, like price action did with the red line, it can break through.
ANd come down to test support on either:
1. On yellow horizontal line
2. Or the Orange slanted line
Indicator:
Also if you notice the RSI, as we were breaking the white trend line, it broke above the yellow moving average with force, and created a higher high from the previous high of the RSI. This also show cased that we would move further up in price and break the red trend line.
We are also getting to overbought terroritory on RSI marked by the 70 level or dashed line. And
We've been above the yellow MA for some time now, eventually to come back to test it and move below it which would possibly coincide with when the broader market stops consolidating. This can also coincide with not breaking the white trend line in the shorrt term. Lets see whats up!
Hope this made sense. Please comment, like and follow! Check out my other dxy ideas LINKED BELOW.
Let me know what you think and where the market is headed!
Thanks.
Disclaimer: This is not financial advice and i am not a financial advisor. This is my opinion based on TA.

DXY ( High Probability SELL Setup SOON )* Here we can see clearly the next moves for USD index ( DXY ),
* We can see clearly the Bearish Divergence on the RSI indicator,
* This shows us more confirmation for our U.S. indices Strop Bullish Move,
* We're using H2 time frame for a clearer view of our analysis, hence we can't predict the duration of our analysis to occur,
* Keep a close eye on U.S. indices coming days & weeks,
* Happy pip hunting traders,
* FX KILLA.

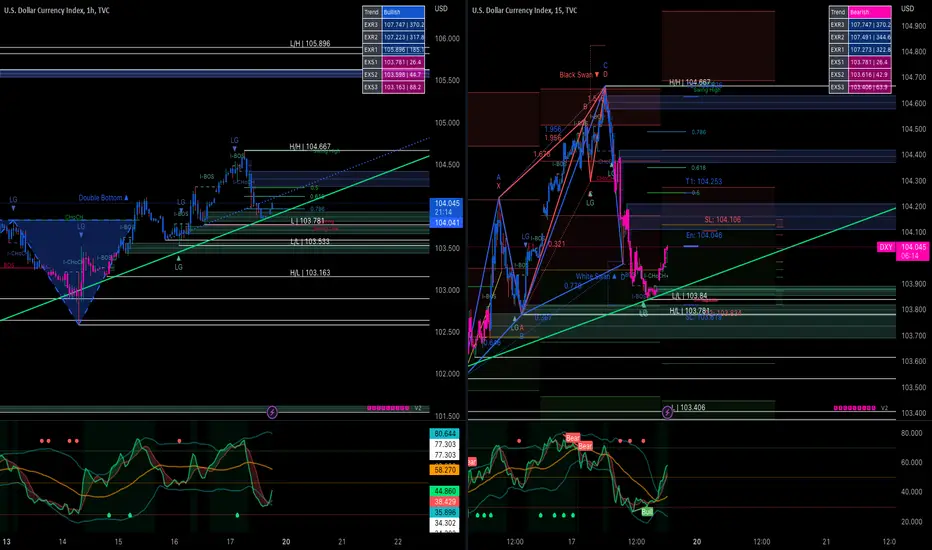
DXY updateDXY LTF update 🐨
Soon I expect a downward movement of US dollar index to sweep out FVG 4h... In parallel, BTC will move to its final destination towards 27k - 30k...

USD Index Targets 104.820 After US Federal Reserve Meeting?We have learned that almost all US Federal Reserve officials backed a 25-basis-points rate hike at the last FOMC meeting held on January 31 to February 1.
Only a few officials favored a larger 50-basis-points hike at the meeting or said they "could have supported" it. Even so, many more dovish sentences were spoken in the latest meeting than compared to the December meeting. Although, officials did not go as far to consider a pause in rate hikes. The only time this topic was broached was in reference to foreign central banks and their potential strategies.
Of course, the meetings also showed the obligatory note that, although the rate hikes have started to ease inflationary pressure, officials agreed that there was much more work to do to get inflation under control and were definitely aware of the risk of not doing enough, so the drip of dovish language will likely continue for some time before a dovish outlook overtakes a hawkish. Especially, because the meeting took place before the release of the hotter-than-expected jobs and retail sales data from January. This might go some way in supporting the USD in the short to medium term.
Looking at the DXY after the release of the minutes, it looks to have helped the USD index push into the mid 104s, where it is encountering some resistance. The index only has to break into 104.700 to eclipse its recent one week high and return to its month high. A target above this range could include 104.820, which aligns with the 200-EMA and some peaks reached in January.

DXY Chart Analysis....
DOLLAR INDEX MY VIEW-
N.B- In this situation DXY chart create Bullish Flag Pattern's breakout @104.360.
resistance level, then market Buy UP to 105:000; @ 105.500 and 106:000 resistance level.
Then market need seems sell correction to nearest Support 105.500 level.
AronnoFX will not accept any liability for loss or damage as a result of
reliance on the information contained within this channel including
data, quotes, charts and buy/sell signals.
If you like this idea, do not forget to support with a like and follow.
Traders, if you like this idea or have your own opinion about it,
write in the comments. I will be glad.

DXY- BULLISH LONG TERM!Hey Everyone, DXY has rejected at our identified area when we shared an update last time, since then we have been monitoring DXY closely and it seems like price have been holding up smoothly. If it fails we will update you all!!

DXY Index Next MovePair : DXY Index
Description :
Break of Structure
Short Sell Long Buy Divergence
Bearish Channel in Long Term and Breakout of the Upper Trend Line
Completed " 1234 " Impulsive and Making it " 5th " Wave
Rising Wedge in Short Time Frame as a Corrective Pattern

DXYWe see the breaking of the trend line with a higher slope, due to the breaking of the 102.2491 range
It can be expected to be touched around the second trend line with a lower slope.
1-102.7198
2-102.2491
3-101.3775
Objectives based on pivot points:
1-104.7767
2-105.3868
3-106.1712
It is not necessary to touch all the targets.
If you have the confirmation for the negative divergence and the above candle, you can get the confirmation of entering the upward trend from the bottom time.

dxy bulls pulling up for a little bit the 1hr dxy is still bullish and creating hh and hl right at that last bullish ob if 103.800 level is one to watch and also the last higher high level watch it as well dxy still looking bullish to me
Intraday Trading Sell DXY & Profit 1: 2 (17 FEB 2023)DXY intraday trading alert
3 simple steps to find a quality setup !
Risk Reward Ratio 1: 2
Anyone same idea with me?
SELL DXY
Good luck traders..

Watching the DXY for Bitcoin Direction...The DXY is at a pivotal point here, and potentially breaking higher into a new upward trend channel.
This would be bad for Bitcoin and crypto overall as the DXY has a strong inverse relationship.
If the DXY stays in this area and drifts lower we could see a short-term crypto rally including Bitcoin and Ethereum.
If it breaks up above the 103.5 to 104 level, then we're into a crypto pullback zone.
If we continue dropping back into the downward trending channel then we're in the crypto rally a zone, and possibly even down below 100 into the crypto super pump rally zone.
Hard to say here...

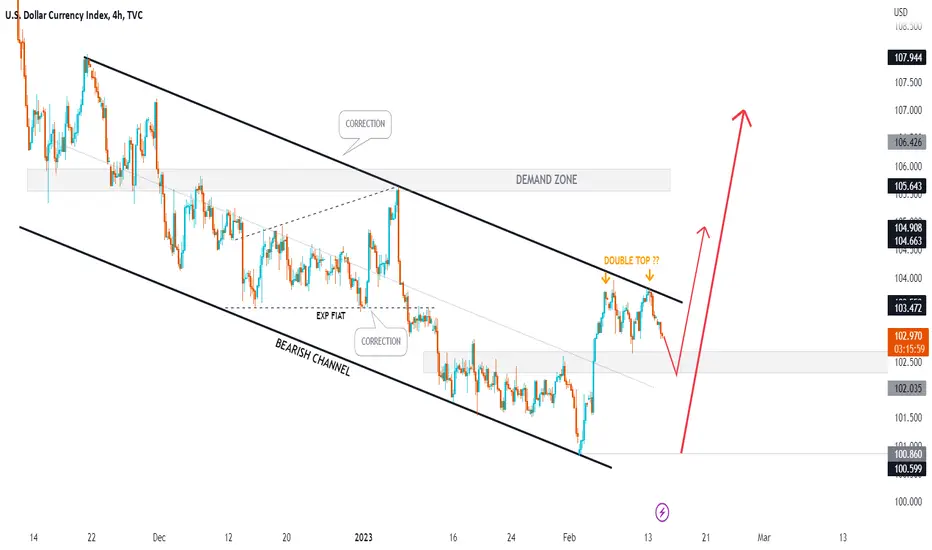
DXY INDEX Next Move Before CPI Pair : DXY Index
Description :
Bearish Channel as a Corrective Pattern and Rejecting from the Upper Trend Line #UTL
Double Top Pattern in Short Term
RSI Divergence
EMAs Crossing Each other and Indicating us the Sell in Short Time Frame
Break of Structure and Making its Retracement
Completed " 13245 " Impulsive Wave and Making " a " Corrective Wave
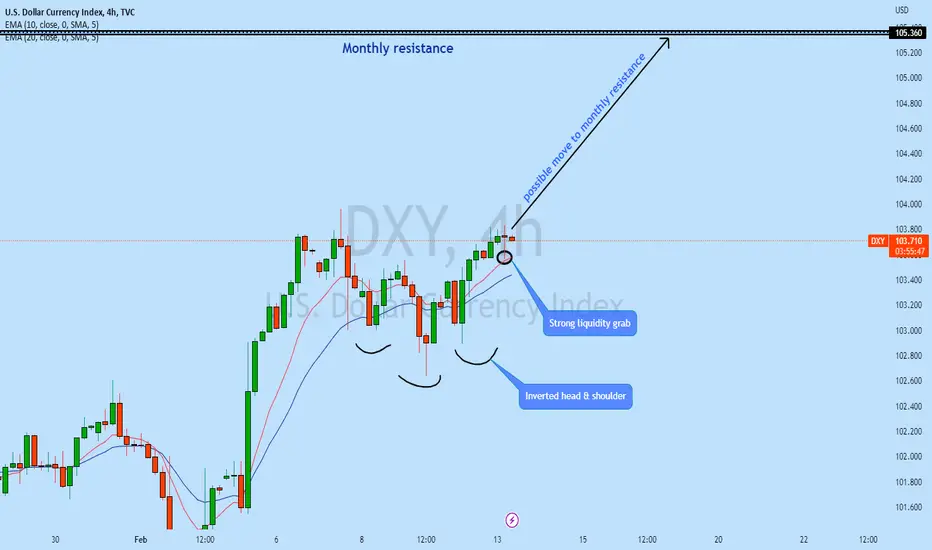
DXY is set for a rise!Currency Pair : DXY
Possible direction : Bullish
Technical Analysis : After market opening DXY has broken out the resistance with strong liquidity grab from the strong support zone. it is highly likely price will continue to rise as long term trend is bullish and we have seen multiple liquidity grab along the way
Possible trade recommendation : Bullish as per chart sketch
Press like button if you enjoy.
Risk Disclaimer: Trading foreign exchange on margin carries a high level of risk, and is not suitable for all investors. Past performance is not indicative of future results. The high degree of leverage is dangerous and can work against you as well as for you. Before deciding to invest in foreign exchange or any market you should carefully consider your investment goals, level of experience, and risk tolerance. It is EXTREMELY LIKELY that you will sustain a loss of some or all of your initial investment and therefore you should not invest money that you cannot afford to lose. No representation is being made that any account will or is likely to achieve profits or losses. Past performance is not indicative of future results. Individual results vary and no representation is made that clients will or are likely to achieve profits or incur losses comparable to those that may be shown. You acknowledge and agree that no promise or guarantee of success or profitability has been made between you, and Forex Trading Wizard. Do your own research and talk to a professional financial planner in order to be aware of all the risks associated with foreign exchange trading and investing and seek advice from an independent financial advisor before risking any capital.
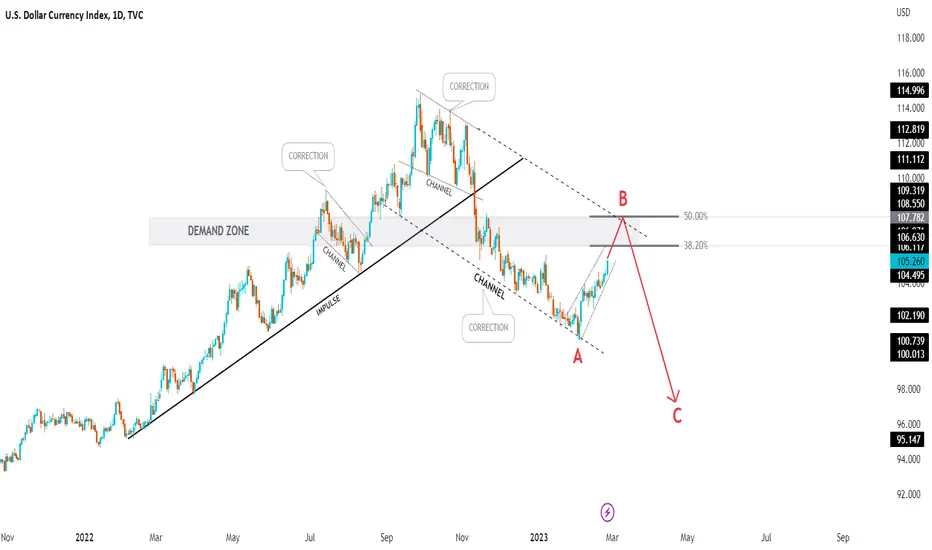
DXY Index Monthly Move ??Pair : DXY Index
Description :
Bullish Channel as a Corrective Pattern
Break of Structure
Breakout the Consolidation Phase and Completed the Retracement
Rejecting from the Fibonacci Level - 50.00%
Divergence
