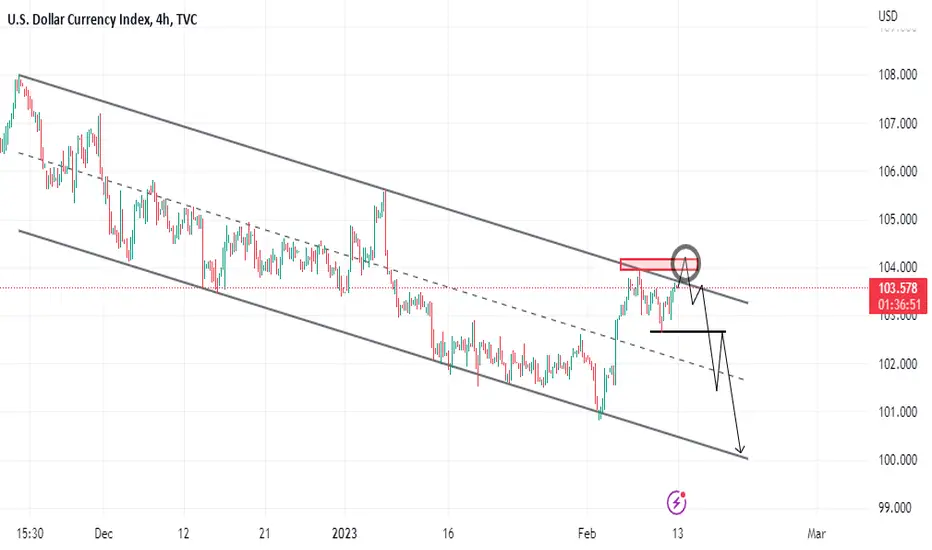
dxy sell limit orderdxy sell signal
It is located in the range of the ceiling of the descending channel and it seems that it will fall to the bottom of the channel after reaching the limit of losses
Dxyforecast
DXY Index Next Move ?Pair : DXY Index
Description :
Impulse Correction
Fibonacci Retracement
Bearish Channel as a Corrective Pattern in Short Time Frame
S / R Level
Rejecting from the Current Demand Zone
Divergence

#DXYWe are in a channelized space of a decreasing trend of daily time.
Currently, we are witnessing a negative reaction in dealing with the ceiling with a negative divergence. It is expected that by breaking the resistance zone of 102.808 based on a combination of static and pivot point, it can touch the target of 102.455, which is on the static ceilings from the previous wave. has it .
After that, if 102.455 breaks, you can expect to touch the midline of the channel.

DXY OUTLOOKDXY is currently correcting for another push to the downside that may happen tomorrow London session. This means that any sell opportunity in xxusd is a trap, until DXY has given us another leg down to the fvg.

DXY - understanding RISK ON or RISK OFFHi guys. Trying to get better at expressing what i see so This is for educational purposes. Ill try to express my take on the relation of DXY to either a RISK ON or RISK OFF scenario with my go to trading tools.
RISK ON = BULLISH
RISK OFF = BEARISH
DXY can be a powerful tool in TA when trading equities or crpyto currency. It is known to be inversely related to Equities and Crypto. Meaning when DXY goes up, mentioned assets go down & when DXY goes down, the assets go up.
I use it as such for my trades.
Okay so firstly:
Price Action:
As you can see current price action on the Daily time frame shows us trying to break the red trend line. This is the 4th touch point, which as me oogling heavy on this at the moment. For risk on situation, we would like to NOT break this trend line and rather have price action move back down. If so we would fall to the WHITE support line. Breaking this support would be even better for RISK ON.
Also notice the orange trend line this coincides with the top we had. If we break this, thats a major trend change, potentially to the upside. That may coincide with recession talks, S&P, Dow, Nasdaq, Crypto all going down to new lows (In my opinion).
Now Indcators:
1. RSI - We've clearly printed a higher high on the RSI. Notice the 2 Red horizontal lines, one above is resistance, one below is support. We want to stay below the resistance line and not breach it and let it flip support. That would indicate major trend shift in the RSI and could lead to RISK OFF. Ideally, we want to hit support and break down or move sideways to maintain the current situ in market.
2. MACD - Momentum indicator - we are picking up a little in omentum but its more or less just average power. For it to pick up, which would be RISK OFF situ, the blue/orange line would go above the 0 level. Ideal situ, to stay below 0 as long as we can, or if we breach 0 quickly come back down as drawn in red.
3. ADX & DI - Momentum indicator - When red line is above the green line it indicates bearishness and when green line above red line its bullish momentum. As you can see the gray rectangle i think we will be in a period highlighted by previous gray box. Where momentum just chops sideways with continuous overtakes by both colors (green & red).
4. STOCH RSI - Momentum indicator - Here we would like to see cross below the 80 level which would indicate RISK ON. If orange line catches up to blue and begins to go horizontal as shown by red arrow, that could indicate RISK OFF.
Please note we would like to see confluence among multiple indicators for the direction to be more probable. If one goes RISK OFF, other 3 RISK ON, it could be possible for RISK ON but i would like to see all 4 show one direction. For more clarity i would use other tools as well in my toolbelt. But i like these cuz there simple and works well for me countless times.
So keep a close eye on DXY! Great indicator of whats to come for the markets overall.
Thank you. If your into TA please join in and let me know what you think! Lets learn together!
***Btw this is not financial advice, i am not a financial advisor. Im just a student of the markets, wanting to reinforce my understanding.

DXY Possible scenario for the coming daysSince DXY is currently governing the markets. This is how I see it in the coming days.
Remember that when DXY goes down, the markets and crypto go up, and viceversa.
Trade safe!

DXY moving up to weekly resistance zoneDXY hit the monthly support and bouncing off of that. It is likely that it will reach to the weekly resistance 1 as marked on the chart and there it shall be pushed back down.

DXY Index 6 Jan -10 Jan Move Bullish ??Pair : DXY Index
Description :
Symmetrical Triangle Pattern as a Corrective Pattern in Monthly Time Frame and we have a Breakout and Retracement
Break of Structure
Divergence
Bullish Channel
Fibonacci Level

DXY LONG PLAY 06-02-23 (H1)
The weekly close was very bullish, this is my first target next week. I am targeting the daily FVG and equilibrium of the FVG. My long-term play is the weekly volume imbalance as it has been for a few weeks but it may take months to play out.

DXY LONG PLAY 06-02-23 (H4)The weekly close was very bullish , this is my first target next week. I am targeting the daily FVG and equilibrium of the FVG. My long-term play is the weekly volume imbalance as it has been for a few weeks but it may take months to play out.

DXY LONG PLAY 06-02-23 (Daily)The weekly close was very bullish, this is my first target next week. I am targeting the daily FVG and equilibrium of the FVG. My long-term play is the weekly volume imbalance as it has been for a few weeks but it may take months to play out.

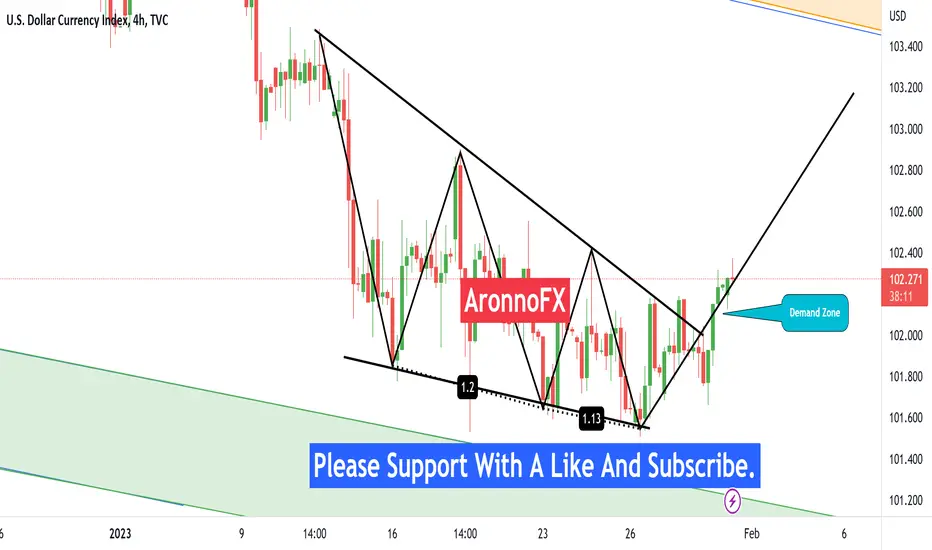
#DXY- LONG-After last week NFP data and recent CPI data has weaken DXY, however, we are expecting a smooth reversal at our area.
-The fear in the market has led DXY suffer heavily.


Dollar Index Chart Analysis....
DOLLAR INDEX MY VIEW-
N.B- In this situation DXY chart shorttime chart create higher high move.So, market need
seems buy correction @ 102.555 and 103:135 risistance level.If breakout this
resistance level, then market Buy UP to 104:000 resistance level.
Hello Traders, here is the full analysis for this pair,
let me know in the comment section below if you have any questions,
the entry will be taken only if all rules of the strategies will be
satisfied. I suggest you keep this pair on your watch list and see if
the rules of your strategy are satisfied.
Dear Traders,
If you like this idea, do not forget to support with a like and follow.
PLZ! LIKE COMMAND AND SUBSCRIBE.
DXY Short Play 30-01-23 Weekly TargetWeekly Volume imbalance is the target, this has been the target for a few weeks now. Major news events later in the week should help price to the target.

DXY LONG DXY will be wil trend higher.. look like need some push to higher.. there so maney factors are running economically , so no body cant control whats gonna happan..looks like major volume building up..if it reject higher price we short.. or we continue long dxy. once reach ITL level its easy to price go through it as trade location...

dxy weekUS DOLLAR INDEX
last GDP data was strong as compared to its prvevois but down trendline act as a resistance and push the price down again.If price goes up chance to get resist again from thats trendline which push the price to the support
F.O.M.C data Here give a clear direction of Dxy. For trade first find proper price action

DXY Short Play 23-01-23I'm expecting a bearish week for DXY, I believe we are heading for the weekly volume imbalance at 97.2.

DXY 23 Jan - 27 Jan Next MovePair : DXY Index
Description :
Impulse Correction Impulse - Completed " ABC " Corrective Wave after Long Impulse
Descending Triangle as a Corrective Pattern in Short Time Frame we need to Wait Until it Breaks the Upper / Lower Trend Line
Selling Divergence
If Breaks then Next Target Daily Support Level
Break of Structure

DXY- The chart show a lot of bottiming signsIf you read my analysis you know that I'm bullish USD and although so far the reversal keeps us waiting, my opinion remains the same.
Looking at the Dxy chart we can see that since Monday USD is showing some life with yesterday being a very agitated and volatile day.
Usually, big volatility is a sign of reversal, and yesterday's low could mark the bottom
Technically all the candles since Monday are reversal ones so a test of 103.50 resistance, in the short term, is very probable.
Anyway, I will remain bullish in the long run USD, and in my opinion, there is much more room for up than down.
I'm looking for good points to sell EurUsd and GbpUsd

DXY to 160?I think you can see where I copy and pasted this line bar from. At the end of 1981 / beginning of 1982, the DXY crossed over the 100 mark for the first time, then retested and held it as support.
The 100 level has served as rejection in 2016 and 2020. We blasted through it last year, and are now coming down to retest it. Will it hold? Or will it fall below, break down, and confirm as resistance again? If that happens, my idea is negated. But if the DXY holds this level as support, then I think higher is likely, especially due to the "mAcRoEcOnOmIc CoNdItIoNs" -- lol.
Since this is just a line bar copy and paste of the inflation of the 1980's, the timeframe is not the point of this prediction, only the target area. It's highly possible we could approach that area much sooner than depicted here. There will also likely be resistance in the 120 area, if we reject and confirm from there, my idea is also negated. If we go above and retest and hold as support, then the 160 is even more likely.
The DXY is also above the 20, 50, 100 and 200 MONTH moving averages. "Bullish"
Cheers!
None of this is financial advice. But it is fine and chill advice.

Plan A or Plan B on this index?Hello, my dear friends and fellow traders.
What we are going to look at today is the US dollar index. When looking at the daily chart this is a good setup for the price of this index to go up. if we see if this index can be taken long position, according to the daily time scale in this index, it is at the lower side. Very dangerous one to take a long position. But it has the potential to go up.
So, keep the trailing stop small in this. If you take it for a long time, there is a 1:2 RR chance of giving it. Also, it has a 1:8 chance of giving a good move to go up.
However, due to the current opposition, there are chances to stop this rally. So, the first profit target in this should be 1:2. Then if you want you can keep 1:8 but it depends on the system.
Till then wishing you a good luck on this strategy. See you in my next post.
It is wise to follow your risk management before taking entry.
I love to share my ideas. Feel free to revise the text and provide feedback. It makes it so personal and improve us in better ways.
CAPITALCOM:DXY
Thanks & regards,
Alpha Trading Station
Disclaimer: This view is for educational purpose only & any stock mentioned here should not be taken as a trading/investing advice. We may or may not have position in the stocks mentioned here. Please consult your financial advisor before investing. Because Price is the "King of Market".
