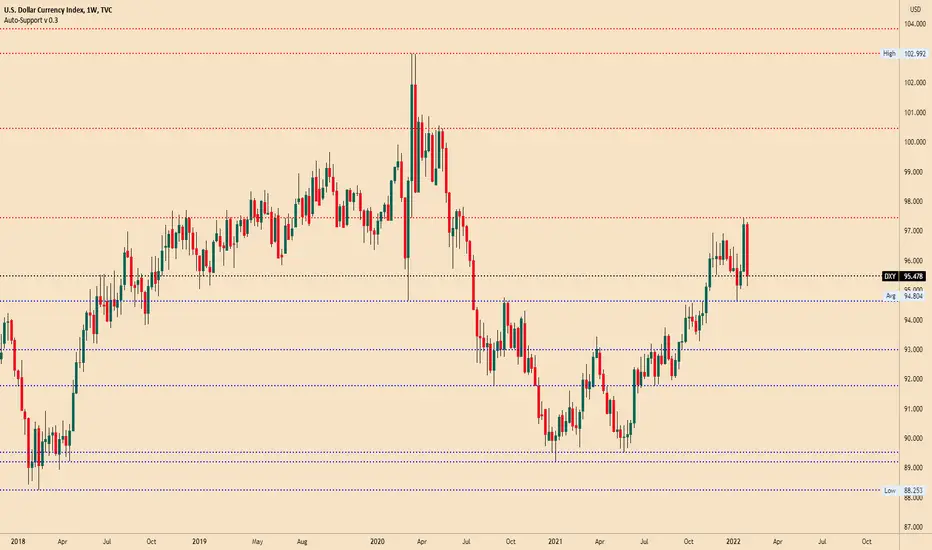
DXY- On its way to 102? (weekly outlook)Since 2008 low from 72, DXY has traded upwards, and after 2015 break of 90 resistance, this zone has become a strong support, with the price reversing from here in 2018 and twice in 2021.
Recently the price also has broken above 95 interim resistance and seems determined to challenge 102 resistance.
Looking at the "power" of USD this 4% rise is very probable to happen by summer and swing traders can look to sell USD pairs like EurUsd, GbpUsd, NzdUsd, and AudUsd.
P.S: This is a clear example of Gold positively correlated with USD. So, don't trade the correlation (or what you think it is), trade the asset!
Dxyforecast

DXY - DOLLAR INDEX + NFP DATA TODAY + WEDGE PATTERNDXY
- According to PRICE ACTION there is only one DOWNSIDE BIAS for DXY. However, NFP DATA is due to be released today.
- DXY 96.54 LEVEL can come to LONG TERM according to PRICE ACTIONS. You need JavaScript enabled to view it DXY SELL.
- NFP, UNEMPLOYMENT DATA, AVERAGE HOURLY EARNINGS DATA are very VOLATILE and can be MANIPULATIONS in DXY. Those who trade EURUSD beware.

DXY Bullish ?SXY has Been Following the trend line Since Long and I expect to See a little correction on the trend line and then DXY Bouncing up to 96.500 .

DXY US Dollar: Historical ComparisonToday I am charting the The US Dollar Index (DXY) on a monthly chart over a multi-year period.
I am showing a comparison of the DXY price from 1995-2002 with the Price, RSI and MACD resembling the current price, current RSI and current MACD. I circled and highlighted the areas of comparisons. Furthermore, I overlaid the historical price over the current price to see where the top may be before a reversal. Shockingly that price range is very close to my DXY price on the January 27, 2022 Idea I showed. Check that chart out as well!
When zooming out, the US Dollar price looks very bullish in the long-term. This is a monthly chart so please be patient with price action.
What are your opinions on this? I love reading your comments below.
Disclosure: This is just my opinion and not any type of financial advice. I enjoy charting and discussing technical analysis. Don't trade based on my advice. Do your own research! #cryptopickk

Break out rejected. DXY still trapped in the wave 4.The DXY made a run to break the top of the channel this week and failed. We are likely to see price spend some time in this consolidation channel before it builds up enough momentum to break to the upside. We are short term bias to the downside for the DXY but we will be only looking for long entries on the pair. A retest of the bottom of the channel at 95.7 will be a nice entry for our long.

DXY - DOLLAR INDEX FORMING A BAT PATTERN - DXY is currently forming a BAT PATTERN.
- If you BREAK the DXY DOWNSIDE CHANNEL TREND LINE you can definitely COMPLETE the BAT PATTERN.
- If the DXY price falls below 95.00 LEVELS the BAT PATTERN will be INVALID and it will change to the SHARK PATTERN. If so we will UPDATE
- DXY BREAKOUT is very important for USD CROSS PAIRS.
- Up to DXY 97.27 can be UP if the BAT PATTERN is COMPLETE. So stay tuned for MARKET UPDATES.

DXY chartif the US10Y comes down as much as i've marked in the previous chart, the DXY could possibly come down more and take out the equal lows?
remember USD pairs (E.G. EURUSD, GPYUSD) do the opposite to the DXY
These are longer term views on the DXY chart

DXY Chart H1Here is my view for DXY on H1. The price should go up, you can put a pending order on the Order block or find an entry on LTF within OB Zone. Trade Safe!

DXYI think it's ABCDE correction from big wave 4 of wave C. what do you think? share your idea with me please.

DXYas I said on last weeks .. DXY still keeps the premises of forming a pattern that it has been following since May 2020!
...as I analyzed ... DXY rejected from the 94500 area and closed over 95150 from where it climbed to the target proposed by me ... 96400!
THIS WEEK... as I analyzed last week, DXY hit my 96400 target from where it rejected!
In the next period I will try to play between 95100-96700 until the first closing outside this area
NOTE: Please, give a LIKE if you find this idea useful!
GREAT ATTENTION:
*This information is not a Financial Advice.

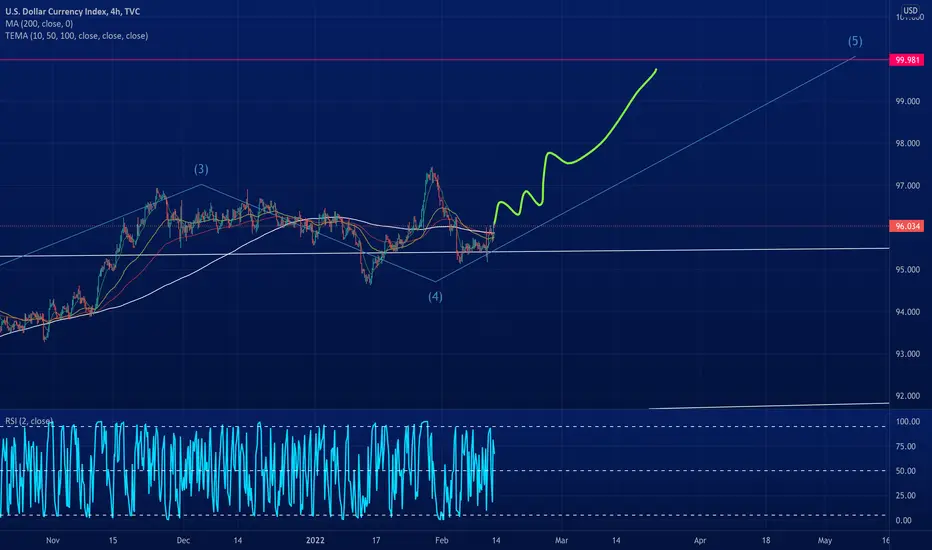
Clear skies ahead for the DXY.The DXY looks set to continue to trade in a ranging motion to the upside as this is a historically messy region. It is likely that the price will continue to trade in a random walk manner with no clear direction until it breaks out of the 95.8 to 97 range. My guess is that it will break to the upside for the final wave 5 impulse so look out for that. I'd cautiously long the DXY at these levels, otherwise a larger entry on a pullback or entry on a breakout would be much preferred.

DXY Chart H1Here is my view for DXY on H1. The price should go up, you can put a pending order on the Order block or find an entry on LTF within OB Zone. Trade Safe!

DOLLAR INDEX Update....SELL...NOW
This week DXY chart Hopefully Create ab=cd pattern. So, that
If breakout 95.858 support zone then market goes to 95.300 & 94.00
support level. If break 96.300 resistance level then market
seems buy to 96.888 resistance level.

DXYThe weekly price chart below shows the U.S. Dollar Index printed a small bullish pin bar last week, as the price continued its consolidation between the support level at 12086 and the resistance level at 12293. The price is obviously consolidating but there is still a long-term bullish trend in force, with the price higher than where it was 3 and 6 months ago.
If the support level at 12086 continues to hold, the long-term bullish trend will be likely to resume.
Overall, it seems clear we still have bullish picture in the USD over the long and medium terms, but in the Forex market the greenback may not be the main driver of prices right now. It may be a better time to trade currency crosses not involving the USD.

One more drop before Take Off??Hi Traders,
Friday's volatility caused some massive sell offs across the board, especially with JPY pairs. The US dollar gained some momentum but in my opinion, it's short lived. We had a strong Impulsive push down from the upper boundary of the ascending channel and now price has sinve been consolidating which I feel will drop to the previous low before heading to the mid 97.00 range.
Anything can happen, follow your trading plan and trade safe.
Comment below and share your view on this pair! Click the like button if this helps you!

Wave 5 impulse coming for the DXY.The final impulse move is incoming for the DXY, there will be pitfalls a long the way but once it breaks the 30 Jan 2022 top, it's clear skies ahead. We want to buy every dip before it breaks the top and start selling our positions at around 100.
DXY EXPLAINED 📉📉📉🎯 DXY - USD Index
USDINDEX - The U.S. Dollar Index (USDX, DXY, DX, or, informally, the "Dixie") is an index (or measure) of the value of the United States dollar relative to a basket of foreign currencies, often referred to as a basket of U.S. trade partners' currencies, this index helps us to understand if USD is bullish or bearish on a short term or long term perspective.
🎯 DXY has two correlations one of them is positive meaning the certain assets moves like DXY and negative corelation meaning certain assets move exactly vice-versa.
✅ DXY Positive Correlations
DXY ⬆️
USDCAD ⬆️
USDJPY ⬆️
USDCHF ⬆️
USDRUB⬆️
USD XXX ⬆️
✅ DXY Negative Corelations
DXY ⬆️
EURUSD ⬇️
GBPUSD ⬇️
AUDUSD ⬇️
NZDUSD ⬇️
From a technical standpoint to have a better probability in your trades try to find entries when both DXY and for example USDCAD are in long poi (point of interest) this will increase your chance of having profits as you use inter-market correlations

DXY Chart H1Here is my view for DXY on H1. The price should go up, you can put a pending order on the Order block or find an entry on LTF within OB Zone. Trade Safe!

DXY LONGS 📉📉📉📉 Expecting bullish price action on DXY as price is being in a bullish market strucuture on a HTF premise, if price rejects 95.000 instituional figure area + bullish orderblock on d1 we will see DXY bullish way above 97.000 / 97.500 this month.
What do you think? Comment below..

DXYIf you like this analysis, smash the "like button" and leave a comment below to share your thoughts
or let me know what crypto you want to see!
Trading is a reflection of yourself. Learn more daily and be ready for every opportunity.
Have a nice trading!

DXY Chart H1Here is my view for DXY on H1. The price should go up, you can put a pending order on the Order block or find an entry on LTF within OB Zone. Trade Safe!

DXY-U.S. Dollar IndexThe weekly price chart below shows the U.S. Dollar Index printed a large bearish candlestick last week, establishing new lower resistance levels at 12215 and 12257 (the latter looking more reliable). This represents a bearish retracement following last week’s highest weekly close seen in 18 months. The price is also potentially supported by the support level at 12174.
If the support level at 12174 continues to hold, the long-term bullish trend will be likely to resume.
Overall, it seems clear we have a very bullish picture in the USD over the long and medium terms, so it will probably be wise to trade in the direction of long USD over the coming week, at least in the Forex market. In other markets, it is likely that the USD will not be a key driver of price movements.
it's isn't just the future of the dollar, it's about all fiats0.61 5-i=99.18
0.78 5-i=108.4
butterfly harmonic pattern:
X=68.29
3-4=0.78 X-3
4-5=0.88 3-4
0.61 5-i=99.18
0.78 5-i=108.4
0.78 4-5=85.85
0.88 4-5=82.23
0.78 X-3=78.34
0.88 X-3=73.47
1.6 4-5=60
1.27 X-3=57.35
1.6 X-3=2.24 4-5=45.9
