DXY INDEXPair : DXY INDEX
Description :
Completed " 12345 " Impulsive Waves and " ABC " Corrective Waves
Break of Structure
RSI - Divergence
Bullish Channel as an Corrective Pattern in Short Time Frame
Demand Zone
Dxyindex

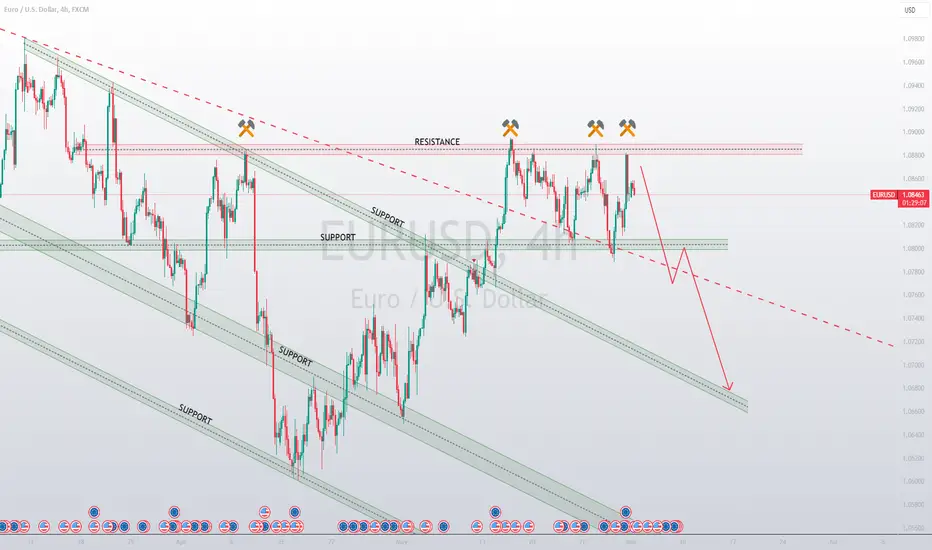
Sell EURUSDThe EURUSD pair has rejected the resistance zone at least four times and is now indicating a potential reversal to the downside. The price action on the EURUSD chart is showing signs of exhaustion as it struggles to break above the resistance zone. Traders are closely monitoring the key support levels for any potential breakdown, which could lead to a shift in market sentiment towards a bearish outlook.
DISCLAIMER
The signals provided by LeoDante_FX are for informational purposes only and do not constitute investment advice. We do not guarantee the accuracy, completeness, or timeliness of the signals, and we are not responsible for any losses or damages arising from the use of our signals.
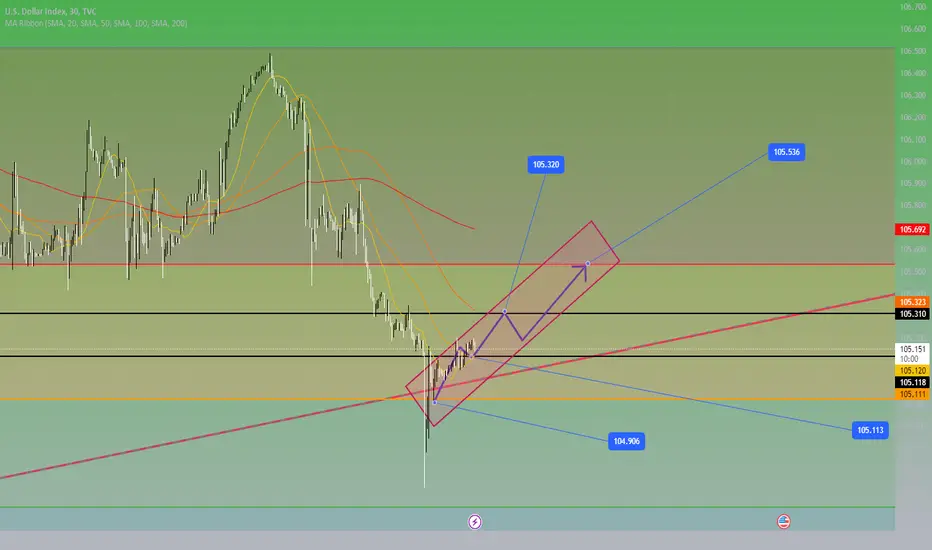
DXYDXY analysis
1 hour time frame
Now we are at the bottom of the 1-hour range, which I expect to move up to the top of the range


DXY IndexPair : DXY Index
Description :
Completed " 12345 " Impulsive Waves and " ABC " Corrective Waves
Break of Structure
Bullish Channel as an Corrective Pattern in Short Time Frame
RSI - Divergence
Demand Zone

DXY hits major resistanceDXY: The USD index this week is touching the susceptible help area round 104.60, so withinside the brief term, the USD is anticipated to get better barely today. Most of the marketplace will now no longer have lots fluctuation because of the financial institution holiday. Ace can refer to shopping for with USD

DXY Weekly outlook May 26 2024DXY Weekly, Daily, and H4 Chart Analysis
Weekly Bias: Bearish
Market Structure Shift (W-MSS): Confirmed two weeks ago, signaling a bearish trend.
iFVG-W: Last week, price tested and closed below the inverse Fair Value Gap on the weekly timeframe (iFVG-W), reinforcing the bearish outlook.
Target Level (DOL): 103.921, where the Weekly Fair Value Gap (W-FVG) and Weekly Swing Low (W-SSL) converge.
Confirmation Needed: Watch for a Bearish Market Structure Shift on the H4 timeframe (H4 Bearish-MSS) to confirm the bearish bias.
Daily Bias: Bearish
D-FVG-CE: On the daily chart, price has closed below the current Daily Fair Value Gap (D-FVG-CE).
D-LRLR & D-SSL: Daily Low Resistance Liquidity Run (D-LRLR) is aligned with the Daily Swing Low (D-SSL) and the Weekly Swing Low (W-SSL), indicating a target for low resistance liquidity.
Expectations: In the upcoming week, anticipate a move towards these lower levels, seeking liquidity.
H4 Bias: Bearish
H4-FVG: On the H4 chart, a Fair Value Gap (H4-FVG) has formed after rejecting from the weekly inverse Fair Value Gap (W-iFVG).
Key Level: 104.998 - 104.913 (H4-FVG).
Bearish Confirmation: If price moves upward and then rejects from the H4-FVG level, this will confirm the bearish bias. This will be an ideal point (H4-POI) to enter short positions targeting 104.009.
Key Levels:
Resistance: Recent iFVG-W (Weekly), H4-FVG (104.998 - 104.913).
Support/Target: 103.921 (W-FVG and W-SSL), 104.009 (H4 target).
In summary, the DXY shows a bearish bias across weekly, daily, and H4 timeframes. Watch for price movements towards 103.921 on the weekly and daily charts, with confirmation from a rejection at the H4-FVG level (104.998 - 104.913) to solidify the bearish trend and target 104.009.

DXY Index is Ready to Pump by 🌄Morning Candlestick Pattern🌄🏃♂️DXY Index is moving near the 🟢 Support zone($104.27-$103.90) 🟢, and 200_SMA(Daily) and 100_SMA(Daily) , and the lower line of the ascending channel .
💡Also, the Morning Candlestick Pattern is clearly visible.
🌊According to the theory of Elliott waves , it seems that the DXY Index has completed the Double Three Correction(WXY) in the support zone .
🔔I expect the DXY Index to rise to at least the Resistance line .
U.S.Dollar Currency Index ( DXYUSD ) Analyze, 4-hour time frame⏰.
Do not forget to put Stop loss for your positions (For every position you want to open).
Please follow your strategy; this is just my Idea, and I will gladly see your ideas in this post.
Please do not forget the ✅' like '✅ button 🙏😊 & Share it with your friends; thanks, and Trade safe.

DXY Dollar Looks Bearish to 104.080I'm bearish on DXY dollar down to 104.080 (previous 2 week candle low)
I view the current move up in price as a potential opportunity to short DXY.
Intermediate timeframe (h8) is delivering bullish (closing above the highs of down close candles). In this scenario, I watch for entries above fractal h8 swing highs, or if there is a bearish h8 cisd, enter on pullbacks into bearish arrays.


Dollar Index Triangle Formation 22.05.2024Triangle formation is now apparent for the dollar index (H1 Timeframe).
A breakout to the upside might trigger an upward movement towards the 105.
A breakout to the downside might trigger an downward movement towards the 104.4 or even at 104.10.
Fundamentals: Possible high interest rate differential in the future that could cause the dollar to gain strength now.
_________________________________________________________________________________
Risk Warning: Trading in CFDs is highly speculative and carries a high level of risk. It is possible to lose all of your invested capital. These products may not be suitable for everyone, and you should ensure that you fully understand the risks taking into consideration your investment objectives, level of experience, personal circumstances as well as personal resources. Speculate only with funds that you can afford to lose. Seek independent advice if necessary. Please refer to our Risk Disclosure.
BDSwiss is a trading name of BDS Markets and BDS Ltd.
BDS Markets is a company incorporated under the laws of the Republic of Mauritius and is authorized and regulated by the Financial Services Commission of Mauritius ( FSC ) under license number C116016172, address: 6th Floor, Tower 1, Nexteracom Building 72201 Ebene.
BDS Ltd is authorized and regulated by the Financial Services Authority Seychelles (FSA) under license number SD047, address: Suite 3, Global Village, Jivan’s Complex, Mont Fleuri, Mahe, Seychelles. Payment transactions are managed by BDS Markets (Registration number: 143350)

Expectations for the US Dollar Market from May to August 2024Expectations for the US Dollar Market from May to August 2024
May to Early July 2024:
The US dollar is anticipated to remain strong, with the market reaching a high of 108.459 by July 1, 2024.
First Three Days of July 2024:
After peaking, the dollar is expected to decline, potentially dropping to 105.785 by July 25, 2024.
Stay updated with our forecasts to navigate the US dollar market effectively.
Keywords: US dollar forecast, USD market trends, dollar strength 2024, USD predictions, currency market analysis, USD outlook May to August 2024, forex trading, financial forecasts, USD high and low, July 2024 USD predictions.
Feel free to share your thoughts and join the conversation on the US dollar market outlook.

Gold technical analysis: 21/5/2024The left chart suggests an equally-weighted gold basket of spot gold towards FX majors. It objectives to expose the underlying of energy of gold in general, and dilute the inverse dating among gold and americaA greenback – that is the maximum extensively observed gold market. On the proper we are able to see the gold futures (gold/USD) reached a document excessive on Monday along better buying and selling volume, even though it didn't keep onto profits above $2450 or the earlier document excessive and retraced lower.
It is likewise exciting to notice that the gold basket has stalled round $2800, simply below its very own document excessive set in April. A bearish divergence has additionally shaped at the gold basket and gold futures contract, each of that are withinside the overbought zone.
It can be tough to assemble a direct bearish case aside from gold stalling round key resistance levels. But that may be true sufficient for gold bulls to take notice and err at the facet of caution.
We`ve already visible as soon as fake damage of the April excessive for gold futures, so possibly bulls may also need to at the least see the gold basket damage to a brand new document excessive earlier than assuming gold futures will keep directly to profits. Of course, what ought to assist with the latter case is to look americaA greenback index damage and keep under 104. Otherwise, some other method is for bulls to await a retracement earlier than looking for proof of a better low for bullish swing change at a extra beneficial price, in anticipation of a damage to a brand new document excessive.

DXY IndexPair : DXY Index
Description :
Completed " 12345 " Impulsive Waves and " ABC " Corrective Waves
Break of Structure
RSI - Divergence
Demand Zone
Bullish Channel as an Corrective Pattern in Short Time Frame

DXY bull to bearshort term bullish, late summer / autum bearish. expecting a run to 10549-106 region before a decisive move, possibly to the low 102 region.

DXY Price analysis 4th May 2024Monthly : The price has already created the MSS(M) in monthly, & there is Monthly BSL situated in 107.354. So I'm Bullish In monthly.
If we have any bulish PDA in Daily our M-Bullish bias will be confirmed.
Monthly Bias: Bullish
Daily : In daily chart the price has been create the Daily MSS after taking W-FVG+ & the price has been tested the D-FVG+, so in the up coming week we are going towards 107.354.
So if we have any H1- Bulish PDA formed then our Bullish Bias will be confirmed.
Daily Bias: Bullish
H1: Price has been closed above the D-FVG+, there could be 2 scenarios in H1.
1. The price will be taking the resent low, 104.598, gives a closer above 105.159 with a decisive upside move.
2. From this point the price will go upside with decisive move & closed above 105.228. Then the bullish Bias will be confirmed.

DXY Price analysis 19 May 2024Monthly: The price come down after creating the M-Mss+, as there is no space left for M-FVG now so our bulish bias is invalid now.
Monthly Bias: Consolidation.
Weekly: The price has taken the W-FVG+ & closed bellow, Creating a W-MSS -, & there are 2 Target bellow situated in 103.921 level, so now our target is to go for the W-SSL.
Weekly Bias: Bearish.
Daily: The price has been rejected the W-FVG, now D-MSS- has been formed with a D-FVG- & the Price already rejected from that level, So the daily price is clearly showing that the we are going down, towards-103.921 level.
Daily Bias: Bearish
H4: In this level the price has been formed a h4 Cisd- from the daily FVG, so now we are confirmed that we are going towards down.
H4 :Bias Bearish.

DXY: DXY analysis todayThe dollar slid to a multi-month low on Thursday after U.S. core inflation hit a three-year low and retail sales were flat, raising expectations of lower interest rates in the economy. largest economy in the world.
The DXY index recorded its biggest decline of the year, falling 0.75% and penetrating below the MA 200 line. DXY is currently trading around its 5-week low at 104.17 at the beginning of the Asian session.

Fundamental Analysis of the US Dollar
The trend of the US dollar is as I predicted. This can be seen directly from the trend chart of the Asian market. The U.S. dollar index is currently showing an oversold rebound trend. The key thing to pay attention to is the pressure level above, which is around 105.3-105.5 to see if it can stand firm.
In trading, EURUSD and GBPUSD can be sold at a higher price first. Wait for the market to fall.
In the past, you always failed when trading alone.
But everything will change after you follow me.
Because we will be the ultimate winner!
DXY - USD Sinking To A Bottomless Pit The Fundamentals
When I think of U.S. Federal Reserve and U.S. Government infinite debt ceiling, the title of the movie, "The Gods Must Be Crazy" comes to my mind. What they are doing has only one end result, the destruction of the U.S. $ and its economy.
There are new sheriffs in town (BRICS - Economic Sheriffs, Russia, China, Iran - Military Sheriffs), the U.S. no longer has military nor economic hegemony, this is what's behind the power of the U.S. $, imagine being powerless to protect their interests in the red sea, where there's a new sheriff in town called Iran camouflaged as Houthis :D or being kicked out of Niger?
Some genius decades ago, had the bright idea that backing the U.S. $ by military power was a great idea, moving factories to China for the sake of increasing profits was also a bright idea, and at the same time antagonizing China.
The Technical Analysis
Counting the waves, looks like we've completed wave B of wave 5 which means wave C could take the USD below 92. Coincidently that's close to 0.5 and 0.618 Fibs. Wave 1 and 2 of wave C looks completed now brace for impact!
Mayday! Mayday!
The Bullish Scenario
Wave B of wave 5 could be an extended wave and take the USD all ze vay to 119 and crash afterwards.

Will the Dollar continue its Downtrend or change its Direction?The dollar index #DX1! respected its previous downtrend and the News about CPI (Consumer Prices) today helped with this movement to the downside.
Will the Dollar continue its Downtrend or will change its Direction to the Upside?
CPI m/m
Actual: 0.3%
Forecast: 0.4%
Previous: 0.4%
Empire State Manufacturing Index
Actual: -15.6
Forecast: -9.9
Previous: -14.3
"The dollar index, which measures the greenback against a basket of major currencies including the yen and the euro, fell to a one-month low at 104.41, but later pared losses to trade 0.25% lower at 104.77".
References:
-https://www.forexfactory.com/index.php
-https://www.reuters.com/markets/currencies/dollar-droops-ahead-crucial-cpi-test-yen-under-pressure-2024-05-15/

DXY IndexPair : DXY Index
Description :
Bullish Channel as an Corrective Pattern in Long Time Frame and Rejection from Upper Trend Line
RSI - Divergence
Break of Structure
Completed " 12345 " Impulsive Waves and " ABC " Corrective Waves

DXY(Dollar Index):🟢Possible scenarios🟢(Details on caption)Well hello, traders.
Here is my view on the DXY daily chart.
As you can see the price left the buy-side liquidity which formed as an equal high, and then respected to the 50% of bullish FVG which is internal range liquidity. In this condition usually, the price seeks to the external range liquidity.
So the first scenario is bullish and I follow this scenario (High probability scenario)
The second scenario is bearish, if the price respects the bearish order block or mean threshold of this order block we will see the price move down.
All in all, if the bearish order block can not hold the price we will see a bullish week, and if the price respects the bearish order block the weekly candle will be bearish.
💡Wait for the update!
🗓️01/05/2024
🔎 DYOR
💌It is my honor to share your comments with me💌
