Long Trade Idea / EURUSD / 21st FEB 2024 - I want to see a bullish session targeting PDH.
- I believe this is manipulation under MOP
- London Judas swing.
Dxyindex

DXY(US Dollar),🔴Can grab the sell-side liquidity?🔴
As you can see the price consolidating for a while and we should see what happens next.
By looking at the chart, we can figure out the price created the sell-side liquidity that formed as equal lows that can be smart money targets. In that case, I don't want to see the price go higher than the key level (107.675).
In addition, there is the hourly bearish FVG that can keep the price and act as a resistance.
So if the price can close below the liquidity void (104.280), we can expect to see a lower price.
💡Wait for the update!
🗓️20/02/2024
🔎 DYOR
💌It is my honor to share your comments with me💌

DXY at an important crossroadsSince the beginning of the year, the USD Index has risen 5% from its lowest point to its peak. However, trading USD pairs has proven to be quite challenging due to the choppy price action and significant volatility between support and resistance levels.
Upon analyzing the chart, the upward movement appears staggered and resembles a rising wedge pattern. This suggests that it may actually be a correction of the previous leg down from 107 to 100, indicating a potential impending decline.
Confirmation for this hypothesis lies around the 103.80-104 zone. If the price breaks below this level, we should pay close attention to the next support levels, including 103, 102, and the crucial psychological and technical support at 100.

DXY Technical Analysis and Trade IdeaTechnical Outlook:
- The DXY (US Dollar Index) maintains a bullish trajectory within its broader uptrend.
- Recent price action indicates a retracement to a significant daily (1D) support zone.
- This technical setup presents potential buy opportunities in line with the prevailing bullish bias.
Trade Suggestion:
- Entry: Consider long positions upon confirmation of bullish trend shifts on a lower time frame at the current support level.
- Targets: Aim for 105, 105.5, and 106 as price objectives.
- Stop-Loss: Strategically place stop-loss orders below the immediate support to manage risk.
Important Disclaimer:
This analysis reflects my individual market assessment for informational purposes. It does not constitute explicit financial advice. Independent research and comprehensive risk management are crucial before executing any trades.


SHORT IDEA 3RR / EURUSD / 15th FEB 2024- I believe the price will present a bearish session.
- Price has performed so far a London Judas Swing.
- Price has made the initial high at 25% of the PWR.
- Asia’s RELs are my first target.
- PDL is my target for the day.


EURUSD Trade Idea / 14th FEB 2024- I want to see a bullish session if the price finds support at Asia’s equilibrium.
- Price is within the monthly FVG, may use this as an IFVG to rebalance CPI’s range.
- 25% of the PDR is my target.
ONLY IF THE PRICE FINDS SUPPORT AT ASIA'S EQUILIBRIUM!

CPI SHORT EURUSD / 13th Feb 2024 The directional bias was perfect.
The price traded to the monthly FVG as expected

DXY - BULLISH MOVE 📈Hello Traders !
On The Daily Time Frame, The US Dollar Index Price Broke The Resistance Level (103.817 - 104.262).
This Key Level Becomes a New Support Level.
So, I Expect a Bullish Move.
-------
TARGET: 105.320🎯

DXY Dollar Index Technical Analysis and Trade IdeaThe #DXY is currently exhibiting range-bound behavior within a broader bullish trend on higher timeframes. While the overall bias remains positive, current price action does not present a compelling entry point for a long position. My strategy involves two potential scenarios:
1: Breakdown Scenario: A break below the current range support would provide a discounted long entry opportunity.
2: Breakout and Retest Scenario: A decisive break above the range high, followed by a retest and failure of that level as new resistance, would signal a potential long entry.
Key Technical Considerations:
- Trend Analysis: The higher timeframe bullish trend offers context for potential long setups.
- Market Structure: Understanding the current range structure guides entry and exit points.
- Price Action: Closely monitor price behavior around key support and resistance levels for trade signals.
Disclaimer: This analysis is strictly educational and does not constitute financial advice. Always conduct your own independent research and thoroughly evaluate your risk appetite before executing any trades.

Dollar to the moonWeekly outlook
Bullish on TVC:DXY : 1W +fvg, 1D +fvg, h4 +brkr
Bearish on NASDAQ:EU : 1W -fvg, 1D -ob, h4 -brkr
Focus is on MIL:EURO shorts since FX:EURGBP is bearish overall.
Won't trade Monday. Focus is on Tuesday post #cpi, Wednesday all day and Thursday NY.
#trading $forex

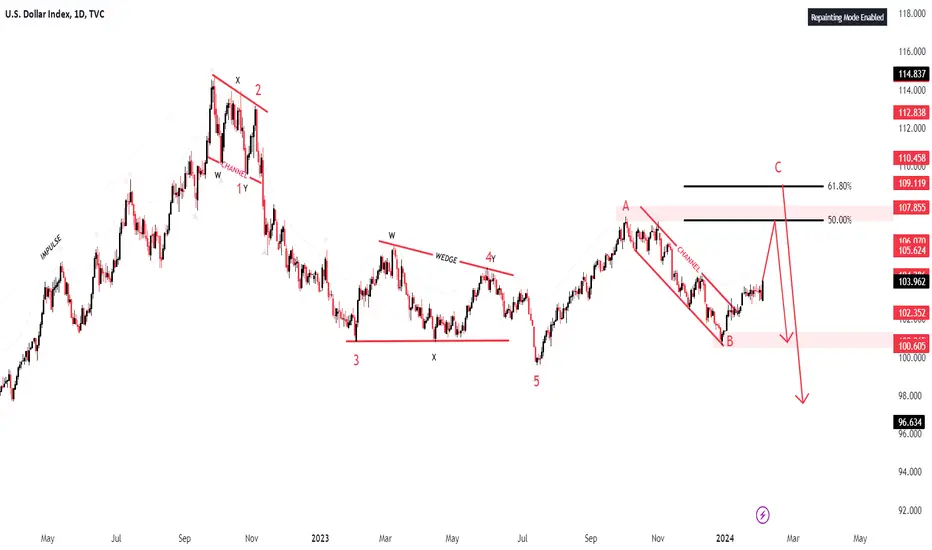
DXY IndexPair : DXY Index
Description :
ELLIOT WAVES - " 12345 " Impulsive Waves and " AB " Corrective Waves Completed
Retracement for BREAK OF STRUCTURE
BEARISH CHANNEL as an Corrective Pattern in Short Time Frame with the Breakout of the Upper Trend Line and Retracement
FIBONACCI LEVEL - 61.80%
Divergence in RSI

DXY 103.523 +0.06% LONG IDEA MTF BREAKDOWN 🐮🐮📌HELLO TRADERS
Hope everyone is doing great 🛑
A look at DXY ahead of the WEEK 📌
DXY WEEKLY TF
* Bulish sentiment still in play on the weekly TF
* Violated the bearish FVG
* Tested and rejected from this PD ARRAY
* POSIBLE BULLISH CLOSE FOR OUR WEEK
DXY D TF
* Looking at DXY from the DAILY TF we see a break BELOW (SSL) which are Monday lows.
* Swept SSL but traded back into the range with some bullish momentum.
* If we see momentum back into the range i would be looking for long.
* Looking for long on the DXY because we do not have a bearish body closure.
* & we are still in an indecisive state, in wick city as well.
DXY 4H TF
* On the 4h alike, indecisive momentum in play.
* Retracement into some of the internal LIQUIDITY .
* looking for some retracement into PD ARRAYS ( FVG + OB & balance price range)
* & should they hold looking for continuations with the bulls.
* Violation of the FVG signals bullish momentum and some confirmations
DXY 1H TF
* Monday LOWS taken.
* Possibly signaling a bullish week ahead.
* might see a SEEK & DESTROY PROFILE
1. IRL - ERL
2.Looking for LQ RUNS.
HOPE YOU ENJOYED THIS OUT LOOK, SHARE YOURS BELOW🛑
lets see how it goes.
IF THIS IDEA ASSISTS IN ANY OR IF YOU LIKE THIS ONE
SMASH THAT LIKE BUTTON & LEAVE A COMMENT.
ALWAYS APPRECIATED
____________________________________________________________________________________________________________________
* Kindly follow your entry rules on entries & stops. |* Some of The idea's may be predictive yet are not financial advice or signals. | *Trading plans can change at anytime reactive to the market. | * Many stars must align with the plan before executing the trade, kindly follow your rules & RISK MANAGEMENT.
_____________________________________________________________________________________________________________________
| * ENTRY & SL -KINDLY FOLLOW YOUR RULES | * RISK-MANAGEMENT | *PERIOD - I TAKE MY TRADES ON A INTRA DAY SESSIONS BASIS THIS IS NOT FINACIAL ADVICE TO EXCECUTE ❤
LOVELY TRADING WEEK TO YOU!

AUDUSD 0.66023 -0.13 % SHORT IDEA MTF BREAKDOWN 🐻🐻📌HELLO TRADERS
Hope everyone is doing great 🛑
A look at AUDUSD ahead of the WEEK 📌
LET'S LOOK AT THE DAILY DXY
DXY D TF
* Looking at DXY from the DAILY TF we see a break BELOW (SSL) which are Monday lows.
* Swept SSL but traded back into the range with some bullish momentum.
* If we see momentum back into the range i would be looking for long.
* Looking for long on the DXY because we do not have a bearish body closure.
* & we are still in an indecisive state, in wick city as well.
AUDUSD DAILY TF
* On the DAILY we are trading from IRL in a bearish FVG.
* We have a DRAW IN LQ in the form of equal lows ERL .
* looking for some retracement into PD ARRAYS ( FVG + OB & balance price range)
* & should they hold looking for continuations with the bears.
* Violation of the FVG signals bullish momentum and some confirmations that invalidates the trade.
AUDUSD 4H TF
* Looking to take BSL.
* This will possibly be signaling a bearish week ahead.
* Sweep of BSL and trading back in the range.
1. IRL - ERL
2.Looking for LQ RUNS.
AUDUSD 1H TF
* We are range bound on the HOUR TF
* looking for SHORT entries.
* Possible retracement before continuation.
HOPE YOU ENJOYED THIS OUT LOOK, SHARE YOURS BELOW🛑
lets see how it goes.
IF THIS IDEA ASSISTS IN ANY OR IF YOU LIKE THIS ONE
SMASH THAT LIKE BUTTON & LEAVE A COMMENT.
ALWAYS APPRECIATED
____________________________________________________________________________________________________________________
* Kindly follow your entry rules on entries & stops. |* Some of The idea's may be predictive yet are not financial advice or signals. | *Trading plans can change at anytime reactive to the market. | * Many stars must align with the plan before executing the trade, kindly follow your rules & RISK MANAGEMENT.
_____________________________________________________________________________________________________________________
| * ENTRY & SL -KINDLY FOLLOW YOUR RULES | * RISK-MANAGEMENT | *PERIOD - I TAKE MY TRADES ON A INTRA DAY SESSIONS BASIS THIS IS NOT FINACIAL ADVICE TO EXCECUTE ❤
LOVELY TRADING WEEK TO YOU!


Dollar Index Reversal Framed is due for a reversal after a health run-up. the 13th of February 2024 is the probable date for a reversal.

DXY Dollar Index Technical Analysis and Trade IdeaThe #DXY has been trending upwards, rallying late last week before pulling back. A potential long trade might emerge if the price finds support during this pullback. Higher timeframes show a consistent bullish trend with higher highs and higher lows. We're looking for a buy entry around the 50%-61.8% Fibonacci zone, but remember, trading is risky. This analysis is just my opinion, not financial advice.

Wave-by-Wave Adventure, US Dollar UnpluggedDecoding the US Dollar Index: Navigating Wave (V) with Thrills
Since the economic tumult of 2008, the US Dollar Index DXY (USDX) has been on a captivating journey, tracing significant waves on its chart. As of now, it stands on the precipice of unfolding the final leg of this larger movement, marked as the thrilling wave (V) on the weekly chart.
Weekly Chart Adventure:
Wave (I), (II), (III), and (IV): Conquered.
Wave (V): The adventure is just beginning.
Daily Chart Expedition:
Inside the thrilling wave (V), wave I, II, and III have been epic conquests.
Currently navigating the challenging wave IV, a terrain of correction.
4-Hourly Chart Odyssey:
Within the tumultuous wave IV, ((A)), ((B)), and the unfolding ((C)).
Inside ((C)), embarking on subdivisions: ((a)), ((b)), and the imminent thrill of ((c)).
Thrilling Wave Principles:
Witness a double correction, an unexpected twist in the daily chart's narrative.
The ongoing correction within wave IV on the 4-hourly chart involves a complex W-X-Y pattern, adding an unexpected thrill.
According to the pulse-pounding Elliott Wave Theory, wave (2) should not retrace more than 100% of wave (1).
Current Pulse:
((a)) of ((C)) is reaching its climax, with the suspenseful unfolding of ((b)) and the highly anticipated ((c)) yet to grip our attention.
Critical Invalidation Level: 107.335 (A point of no return, a daring move beyond 100% retracement of wave (1) inside ((C))).
Please Note:
This analysis is not just a journey; it's a heart-racing adventure crafted for EDUCATIONAL PURPOSES ONLY. Get ready for more twists and turns as we navigate the thrilling waves ahead...!!
I am not Sebi registered analyst.
My studies are for educational purpose only.
Please Consult your financial advisor before trading or investing.
I am not responsible for any kinds of your profits and your losses.
Most investors treat trading as a hobby because they have a full-time job doing something else.
However, If you treat trading like a business, it will pay you like a business.
If you treat like a hobby, hobbies don't pay, they cost you...!
Hope this post is helpful to community
Thanks
RK💕
Disclaimer and Risk Warning.
The analysis and discussion provided on in.tradingview.com is intended for educational purposes only and should not be relied upon for trading decisions. RK_Charts is not an investment adviser and the information provided here should not be taken as professional investment advice. Before buying or selling any investments, securities, or precious metals, it is recommended that you conduct your own due diligence. RK_Charts does not share in your profits and will not take responsibility for any losses you may incur. So Please Consult your financial advisor before trading or investing.

DXY Technical Analysis and Trade Idea for Week Beginning 5th FebGiven that the markets are either correlated or inversely correlated with the US dollar, I'm always looking at the DXY dollar index at the beginning of the week to see how it's shaping up. In this chart we can see that the DXY is bullish it has been range bound previously, however we saw quite a strong rally on Friday with the NFP data release. We can now see the break above the range and I'm looking at the retrace for a potential entry point. We can see similar opportunities presenting themselves with the EURUSD the AUDUSD etc. in the video we touch on how the market shaped up prior to the NFP release on Friday and we look at a potential trade opportunity. As always this information is intended for educational purposes only and not to be taken as financial counsel.

Saturn on the Dual Axis #Dxy MI use the date of the Nixon Shock to prepare the radix for the USD.
8/15/1971 21:00 Washington DC
Already aware of the similarity between USD and Sibley (USA birth/1776) on this issue, I pulled up the dates in which Saturn would transit
Gemini Virgo Sagittarius and Pisces
This is what you get.
Dollar bulls should get dusted by the end of 2024

DXY Next Week Possible MoveDXY first Take Buy side Liquidity and Fill Weekly FVG Then Go Down .
If Break FVG Then More Go Up

DXY Index New Week MovePair : DXY Index
Description :
Impulse Correction Impulse
Breakout the Upper Trend Line of the Corrective Pattern " BULLISH CHANNEL " in Short Time Frame
According to ELLIOT WAVES , It has completed " 12345 " Impulsive Waves and Corrective Waves " AB "
HEAD & SHOULDER as an Corrective Pattern in Long Time Frame