Major resistance level ahead?US Dollar Index (DXY) is rising towards the pivot and could reverse to the 1st support.
Pivot: 97.90
1st Support: 96.46
1st Resistance: 98.57
Risk Warning:
Trading Forex and CFDs carries a high level of risk to your capital and you should only trade with money you can afford to lose. Trading Forex and CFDs may not be suitable for all investors, so please ensure that you fully understand the risks involved and seek independent advice if necessary.
Disclaimer:
The above opinions given constitute general market commentary, and do not constitute the opinion or advice of IC Markets or any form of personal or investment advice.
Any opinions, news, research, analyses, prices, other information, or links to third-party sites contained on this website are provided on an "as-is" basis, are intended only to be informative, is not an advice nor a recommendation, nor research, or a record of our trading prices, or an offer of, or solicitation for a transaction in any financial instrument and thus should not be treated as such. The information provided does not involve any specific investment objectives, financial situation and needs of any specific person who may receive it. Please be aware, that past performance is not a reliable indicator of future performance and/or results. Past Performance or Forward-looking scenarios based upon the reasonable beliefs of the third-party provider are not a guarantee of future performance. Actual results may differ materially from those anticipated in forward-looking or past performance statements. IC Markets makes no representation or warranty and assumes no liability as to the accuracy or completeness of the information provided, nor any loss arising from any investment based on a recommendation, forecast or any information supplied by any third-party.
Dxyindex

DXYDXY still needs more correction upside, once we see more upside we will see if dollar is ready for one last drop.
Disclosure: We are part of Trade Nation's Influencer program and receive a monthly fee for using their TradingView charts in our analysis.

DXY Potential Bullish Reversal – Target 99.456 DXY Potential Bullish Reversal – Target 99.456 🎯
Technical Analysis Overview:
🔹 Trend Structure:
The chart illustrates a recent downtrend, which has been broken as price moved above the descending trendline, signaling a potential trend reversal.
🔹 Pattern Insight:
A bullish harmonic pattern is visible (possibly a bullish Bat or Gartley), with the price reacting from the PRZ (Potential Reversal Zone), aligning with key support near 96.500. The market has respected this zone multiple times, evident from the orange highlighted circles showing price rejections.
🔹 Support & Resistance:
Support Zone: ~96.500
Breakout Zone: ~96.985 (current consolidation near this resistance)
Target Zone: Marked at 99.456, which aligns with previous structure and fib projection.
🔹 Market Sentiment:
Price is consolidating after breaking the downtrend, forming a bullish rectangle (accumulation). The green arrows indicate bullish intent from buyers defending support levels.
🔹 Price Action Signal:
Formation of higher lows.
Break of structure and close above previous highs.
Possible breakout pending above consolidation box.
📊 Conclusion:
DXY shows bullish potential as it builds a base around strong support. A confirmed breakout above the rectangle could fuel a rally toward 99.456. Keep an eye on volume and confirmation candles for entry. ✅

WHy is everyone Freaking out over the DXY !?!?!Here is a chart of the DXY. with a linear regression channel plotted over it. Yes, we are close to the bottom of the channel. But we are no where near an all time low. Far from it. The DXY may be due for a push, but even if it was to drop more it would not be that big of a deal relative to historical patterns.
Could we see the price rise from here?US Dollar Index (DXY) has bounced off the pivot and could rise to the 1st resistance which is also a pullback resistance.
Pivot: 97.10
1st Support: 96.70
1st Resistance: 97.77
Risk Warning:
Trading Forex and CFDs carries a high level of risk to your capital and you should only trade with money you can afford to lose. Trading Forex and CFDs may not be suitable for all investors, so please ensure that you fully understand the risks involved and seek independent advice if necessary.
Disclaimer:
The above opinions given constitute general market commentary, and do not constitute the opinion or advice of IC Markets or any form of personal or investment advice.
Any opinions, news, research, analyses, prices, other information, or links to third-party sites contained on this website are provided on an "as-is" basis, are intended only to be informative, is not an advice nor a recommendation, nor research, or a record of our trading prices, or an offer of, or solicitation for a transaction in any financial instrument and thus should not be treated as such. The information provided does not involve any specific investment objectives, financial situation and needs of any specific person who may receive it. Please be aware, that past performance is not a reliable indicator of future performance and/or results. Past Performance or Forward-looking scenarios based upon the reasonable beliefs of the third-party provider are not a guarantee of future performance. Actual results may differ materially from those anticipated in forward-looking or past performance statements. IC Markets makes no representation or warranty and assumes no liability as to the accuracy or completeness of the information provided, nor any loss arising from any investment based on a recommendation, forecast or any information supplied by any third-party.

A Dollar in Freefall and a Bitcoin on the Brink
In the grand theater of global finance, narratives rarely align with perfect symmetry. The market is a complex ecosystem of competing forces, a cacophony of signals where long-term tectonic shifts can be momentarily drowned out by the piercing alarms of short-term volatility. Today, we stand at the precipice of one of the most profound and fascinating divergences in modern financial history, a story of two assets locked in an inverse dance, each telling a radically different tale about the immediate future.
On one side of this chasm stands the titan of the old world, the U.S. Dollar. The bedrock of global commerce, the world’s undisputed reserve currency for nearly a century, is in a state of unprecedented crisis. The U.S. Dollar Index (DXY), the globally recognized measure of the greenback’s strength against a basket of other major currencies, is in freefall. It is suffering its most catastrophic crash since 1991, and by some measures, is enduring its worst year since the historic turmoil of 1973. This is not a minor correction; it is a fundamental challenge to the dollar’s hegemony, a macro-level event driven by seismic shifts in U.S. economic policy, including aggressive trade tariffs and ballooning government deficits. For the world of alternative assets, a collapsing dollar is the loudest possible bullhorn, a clarion call to seek refuge in stores of value that lie beyond the reach of any single government.
On the other side of the chasm is the digital challenger, Bitcoin. Born from the ashes of the 2008 financial crisis as an answer to the very monetary debasement the dollar is now experiencing, Bitcoin should, by all fundamental logic, be soaring. The dollar’s demise is the very thesis upon which Bitcoin’s value proposition is built. And yet, while the long-term case has never looked stronger, the short-term picture is fraught with peril. A close reading of its technical chart reveals a market showing signs of exhaustion. A key momentum indicator, the stochastic oscillator, is flashing a stark warning, suggesting that the digital asset, far from rocketing to new highs, could be on the verge of a significant drop, a painful correction that could pull its price back below the psychological threshold of $100,000.
This is the great divergence. The macro-economic landscape is screaming for a flight to safety into hard assets like Bitcoin, while the micro-level technicals of Bitcoin itself are suggesting an imminent storm. It is a battle between the long-term fundamental signal and the short-term technical noise, a dilemma that forces every market participant to ask themselves a critical question: In a world where the old rules are breaking down, do you trust the map or the compass?
Chapter 1: The Fall of a Titan - Deconstructing the Dollar's Demise
To understand the magnitude of Bitcoin’s long-term promise, one must first dissect the anatomy of the dollar’s current collapse. The U.S. Dollar Index, or DXY, is not merely a measure of the dollar against a single currency; it is a weighted average of its value relative to a basket of six major world currencies: the Euro, the Japanese Yen, the British Pound, the Canadian Dollar, the Swedish Krona, and the Swiss Franc. Its movement is a reflection of global confidence in the U.S. economy and its stewardship. For this index to suffer its worst crash since 1991 is a historic event. To be on pace for its worst year since 1973 is a paradigm-shifting crisis.
The year 1973 is not a random benchmark. It was the year the Bretton Woods system, which had pegged global currencies to the U.S. dollar (which was in turn pegged to gold), officially died. Its collapse ushered in the modern era of free-floating fiat currencies. For the dollar’s current performance to be compared to that chaotic, system-altering period is to say that the very foundations of the post-1973 monetary order are being shaken.
The catalysts for this historic weakness are rooted in a dramatic shift in American economic policy, largely attributed to the actions of President Donald Trump’s administration. The two primary drivers are a protectionist trade policy and a fiscal policy of burgeoning deficits.
First, the tariffs. The implementation of broad tariffs on imported goods was intended to protect domestic industries and renegotiate trade relationships. However, such measures are a double-edged sword for a nation's currency. They create friction in the intricate web of global supply chains, increase costs for consumers and businesses, and often invite retaliatory tariffs from trading partners. This environment of trade conflict creates economic uncertainty, which can deter foreign investment. When international capital becomes wary of deploying in a country, demand for that country’s currency wanes, putting downward pressure on its value.
Second, and perhaps more fundamentally, are the rising deficits. The U.S. government has been running massive budget deficits, spending far more than it collects in revenue. This debt must be financed. When a country runs a large budget deficit alongside a large current account deficit (importing more than it exports), it becomes heavily reliant on foreign capital to purchase its government bonds. If the world’s appetite for that debt falters, or if the sheer volume of new debt issuance becomes too large to absorb, the nation’s central bank may be implicitly forced to monetize the debt—effectively printing new money to buy the bonds. This expansion of the money supply is the classic recipe for currency debasement.
The combination of trade protectionism and fiscal profligacy has created a perfect storm for the dollar. Global investors, looking at the rising deficits and the unpredictable trade environment, are beginning to question the long-term stability of the dollar as a store of value. This erosion of confidence is what is reflected in the DXY’s historic plunge. A weaker dollar makes U.S. exports cheaper and imports more expensive, but its most profound effect is on the global investment landscape. It forces a worldwide repricing of assets and sends a tidal wave of capital searching for alternatives that can preserve wealth in an era of fiat decay.
Chapter 2: The Digital Phoenix - Bitcoin's Long-Term Bull Case
In the world of finance, every action has an equal and opposite reaction. As the value of the world's primary reserve asset erodes, the value of its antithesis should, in theory, appreciate. Bitcoin is the dollar’s antithesis. Where the dollar’s supply is infinite and subject to the political whims of policymakers, Bitcoin’s supply is finite, transparent, and governed by immutable code. There will only ever be 21 million Bitcoin. This fundamental, mathematically enforced scarcity is the core of its value proposition.
The inverse correlation between the DXY and Bitcoin is one of the most powerful and intuitive relationships in the digital asset space. When the DXY falls, it signifies that the dollar is losing purchasing power relative to other major currencies. For investors around the globe, this means that holding dollars is a losing proposition. They begin to seek out assets that are not denominated in dollars and cannot be debased by the U.S. Federal Reserve. Bitcoin stands as the prime candidate for this capital flight. It is a non-sovereign, globally accessible, digital store of value that operates outside the traditional financial system. A falling dollar is therefore the strongest possible tailwind for Bitcoin, validating its very reason for existence.
This relationship transcends simple price mechanics; it is a philosophical and macroeconomic hedge. Owning Bitcoin is a bet against the long-term viability of the current debt-based fiat monetary system. The dollar’s crash, driven by deficits and monetary expansion, is not a flaw in the system; it is a feature of it. Bitcoin offers an escape hatch. It is a lifeboat for investors who see the iceberg of sovereign debt on the horizon.
This narrative is what has fueled the wave of institutional adoption that has defined the current market cycle. Sophisticated investors and corporations are not allocating to Bitcoin because they are speculating on short-term price movements. They are buying it as a long-term strategic reserve asset, a hedge against the very macroeconomic turmoil that the dollar’s crash represents. They see a world drowning in debt and a global reserve currency being actively devalued, and they are making a calculated, multi-generational bet on a system of verifiable digital scarcity. From this perspective, the long-term bull case for Bitcoin has never been clearer or more compelling. The dollar’s historic weakness is the ultimate validation of the Bitcoin thesis.
Chapter 3: The Ghost in the Machine - Bitcoin's Short-Term Technical Warning
If the story ended with the macro-economic picture, the path forward would be simple. But markets are not simple. They are a reflection of human psychology, a tapestry of fear and greed woven in real-time. While the fundamental, long-term story points resolutely upward, the short-term evidence, as read through the language of technical analysis, is painting a much darker picture.
Technical analysis operates on the principle that all known information, including the bullish macro fundamentals, is already reflected in an asset's price. It seeks to identify patterns and gauge market momentum to predict future movements. One of the most trusted tools for measuring momentum is the stochastic oscillator. It does not measure price or volume itself, but rather the speed and momentum of price changes. Think of it like a car's tachometer: it tells you not how fast you are going, but how hard the engine is working to maintain that speed.
The stochastic oscillator operates on a scale of 0 to 100. A reading above 80 is considered "overbought," suggesting the asset has moved up too quickly and the rally may be running out of steam. A reading below 20 is considered "oversold," suggesting a decline may be exhausted. The current technical analysis of Bitcoin’s chart reveals a deeply concerning signal from this indicator.
Despite the overwhelmingly bullish news of the dollar’s collapse, Bitcoin’s price momentum is reportedly waning. The stochastic oscillator is likely showing what is known as a "bearish divergence." This occurs when the price of an asset pushes to a new high, but the oscillator fails to do so, creating a lower high. This is a classic warning sign. It’s the market’s equivalent of a car’s engine sputtering and revving less intensely even as the driver pushes the accelerator to the floor. It suggests that the underlying buying pressure is weakening, that the rally is becoming exhausted, and that a reversal or significant correction may be imminent.
The technical forecast of a potential drop below the $100,000 level stems directly from this type of signal. It implies that the recent price strength is not supported by genuine momentum and that the market is vulnerable. Why would this happen when the fundamental news is so positive? There are several possibilities. Short-term traders who bought at lower prices may be taking profits. The market may be flushing out over-leveraged long positions, triggering a cascade of liquidations. Or, it could simply be the natural rhythm of a market. No asset moves up in a straight line. Even the most powerful bull trends require periods of consolidation and correction to shake out weak hands, build a stronger base of support, and gather energy for the next major advance. A pullback to below $100,000, while painful for those who bought at the top, could be a perfectly healthy and necessary event in the context of a much larger, multi-year bull market.
Chapter 4: Reconciling the Irreconcilable - The Investor's Dilemma
This great divergence presents every market participant with a profound dilemma, forcing a clear-eyed assessment of their own investment philosophy and time horizon. The market is speaking in two different languages simultaneously, and the message you hear depends on the language you choose to listen to.
For the long-term investor, the individual or institution with a five, ten, or twenty-year outlook, the story is clear. The historic crash of the U.S. dollar is the signal. It is the fundamental, world-altering event that confirms their thesis. The debasement of the world’s reserve currency is a generational opportunity to allocate capital to a superior, non-sovereign store of value. From this vantage point, the bearish reading on a short-term stochastic oscillator is, at best, irrelevant noise. It is the momentary turbulence felt on a flight destined for a much higher altitude. The strategy for this investor is one of conviction. They may choose to ignore the short-term dip entirely, or more likely, view it as a gift—a final opportunity to accumulate more of a scarce asset at a discount before the full force of the dollar’s crisis is felt in the market. Their actions are guided by the macro map, not the short-term compass.
For the short-term trader, the world looks entirely different. Their time horizon is measured in days, weeks, or months, not years. For them, the bearish divergence on the stochastic oscillator is the signal. The macro story of the dollar’s decline is merely the background context. Their primary concern is managing risk and capitalizing on immediate price swings. A warning of a potential drop below $100,000 is an actionable piece of intelligence. It might prompt them to take profits on existing long positions, hedge their portfolio with derivatives, or even initiate a short position to profit from the anticipated decline. Their survival depends on their ability to react to the compass of market momentum, regardless of the map’s ultimate destination.
The most sophisticated market participants, however, attempt to synthesize these two perspectives. They recognize that the long-term macro trend provides the overarching directional bias, while the short-term technicals provide the tactical roadmap for navigating that trend. Such an investor would maintain a core long position in Bitcoin, acknowledging the powerful tailwind of the dollar’s collapse. However, they would use the technical signals to actively manage their position and optimize their entries and exits. They might trim their position when the stochastic indicator signals overbought conditions, taking some profit off the table to reduce risk. They would then stand ready to redeploy that capital and add to their core holding when the technicals signal oversold conditions after the very correction they anticipated. This approach allows them to maintain their long-term conviction while respecting the short-term risks, blending the art of the trader with the discipline of the investor.
Conclusion: The Signal and the Noise
The financial markets are standing at a historic crossroads. The U.S. dollar, the sun around which the global monetary system has orbited for generations, is dimming. Its historic crash is a signal of the highest order, a fundamental warning that the era of unchallenged fiat dominance is facing its most serious test. This decay is creating a powerful gravitational pull toward assets defined by scarcity and sovereignty, with Bitcoin as the undisputed digital leader. This is the signal.
Simultaneously, the internal mechanics of the Bitcoin market are showing signs of short-term fatigue. The warnings from technical indicators like the stochastic oscillator are a reminder that no market is immune to the laws of gravity, that periods of profit-taking and consolidation are a natural and healthy part of any long-term advance. This is the noise.
The great challenge, and the great opportunity, for every investor today is to learn to distinguish between the two. The collapse of the dollar is a paradigm shift, while the potential drop in Bitcoin’s price is a cyclical correction. The former defines the destination; the latter describes the terrain along the way. The current divergence is a test of thesis, of timeframe, and of temperament. Those who are shaken out by the short-term noise will likely miss the long-term signal. But those who understand that the dollar’s fall is the very reason for Bitcoin’s rise, and who have the conviction to see the short-term turbulence for what it is, will be best positioned to navigate this great divergence and witness the dawn of a new financial landscape.

Gold may collapse again, don't get buried in it!In the past two trading days, gold began to rebound from a low of around 3245, and has now rebounded to around 3358, with a rebound of up to $113. Moreover, there has been no significant retracement during this rebound, indicating that gold has little intention to fall, and may even continue to rise.
But for me, gold rebounded from 3245. Even if a double bottom structure with 3275 as the secondary low was constructed on the technical level, it should not be enough for gold to rebound more than $113 in just two days as it fell below many supports in the early stage and bullish confidence suffered a serious blow. Moreover, it happened before the uncertain news of the NFP market.
So I have to consider that the market did it deliberately, and its primary purpose was to kill a large number of short chips in the market and lure more attracted long chips; secondly, the sharp rise before the NFP market may be to reserve room for the NFP market to fall in advance; in addition, I have to consider that the US dollar has fallen to a three-year low. If it continues to fall, there may be a global crisis of confidence in the US dollar, and the oversold rebound demand for the US dollar will also suppress gold.
Therefore, I still will not advocate chasing the rise of gold for the time being; on the contrary, I will actively seek opportunities to short gold in the 3350-3370 area; and once gold turns to a downward trend again, it may at least test the 3325-3315-3305 area downward in the short term.

DXY Game Plan - USD IndexIt is important to watch the DXY to understand the strength of the USD across global markets.
The DXY is a key index that reflects the U.S. dollar’s dominance in foreign exchange. Therefore, tracking it can provide valuable insights into the potential direction of all major asset classes.
In this post, I’ll break down both technical and fundamental expectations.
Technical Analysis
DXY has been in a retracement phase (bearish) since January 2025. During this time, we’ve seen EUR and other major forex pairs form strong bullish trends.
Currently, the DXY is approaching a weekly bullish trendline, where I expect a potential bounce.
Additionally, DXY is trading within a discount zone (below the 0.5 Fibonacci level, also known as equilibrium). Personally, I’m watching for a deeper move into the maximum discount zone (around the 0.75 Fib level).
This area also aligns with key liquidity concepts. Ideally, I want to see a deviation below the bullish trendline, with a sweep of one of the weekly liquidity levels marked on the chart (two black horizontal lines).
I'm not relying on a clean triangle trendline retest, but it's a possibility.
Game Plan
DXY taps the bullish trendline
Deviates below it, running weekly liquidity (black lines)
Hits the max discount zone (~0.75 Fib)
Then shows signs of reversal and strength
Once that setup completes, I’ll be expecting strong USD performance, and will look to short risk assets — including stocks and major forex pairs.
Fundamental Analysis
The Federal Reserve is currently resisting pressure to cut interest rates, while Trump is vocally pushing for rate cuts.
The market is already pricing in a 79% probability of a September rate cut (source: CME FedWatch Tool), so if that happens as expected, I don’t anticipate major market reaction.
However, a surprise rate cut in July would likely trigger a flash crash in DXY/USD — though based on my game plan, I would expect a V-shaped recovery shortly afterward.
EUR, GBP, AUD, and CAD have also hit key resistance zones, so I believe we're likely to see USD strength for a while.

Economic Red Alert: China Dumps $8.2T in US BondsThe Great Unwinding: How a World of Excess Supply and Fading Demand Is Fueling a Crisis of Confidence
The global financial system, long accustomed to the steady hum of predictable economic cycles, is now being jolted by a dissonant chord. It is the sound of a fundamental paradigm shift, a tectonic realignment where the twin forces of overwhelming supply and evaporating demand are grinding against each other, creating fissures in the very bedrock of the world economy. This is not a distant, theoretical threat; its tremors are being felt in real-time. The most recent and dramatic of these tremors was a stark, headline-grabbing move from Beijing: China’s abrupt sale of $8.2 trillion in U.S. Treasuries, a move that coincided with and exacerbated a precipitous decline in the U.S. dollar. While the sale itself is a single data point, it is far more than a routine portfolio adjustment. It is a symptom of a deeper malaise and a powerful accelerant for a crisis of confidence that is spreading through the arteries of global finance. The era of easy growth and limitless demand is over. We have entered the Great Unwinding, a period where the cracks from years of excess are beginning to show, and the consequences will be felt broadly, from sovereign balance sheets to household budgets.
To understand the gravity of the current moment, one must first diagnose the core imbalance plaguing the global economy. It is a classic, almost textbook, economic problem scaled to an unprecedented global level: a glut of supply crashing against a wall of weakening demand. This imbalance was born from the chaotic response to the COVID-19 pandemic. In 2020 and 2021, as governments unleashed trillions in fiscal stimulus and central banks flooded the system with liquidity, a massive demand signal was sent through the global supply chain. Consumers, flush with cash and stuck at home, ordered goods at a voracious pace. Companies, believing this trend was the new normal, ramped up production, chartered their own ships, and built up massive inventories of everything from semiconductors and furniture to automobiles and apparel. The prevailing logic was that demand was insatiable and the primary challenge was overcoming supply-side bottlenecks.
Now, the bullwhip has cracked back with a vengeance. The stimulus has faded, and the landscape has been radically altered by the most aggressive coordinated monetary tightening in modern history. Central banks, led by the U.S. Federal Reserve, hiked interest rates at a blistering pace to combat the very inflation their earlier policies had helped fuel. The effect has been a chilling of economic activity across the board. Demand, once thought to be boundless, has fallen off a cliff. Households, their pandemic-era savings depleted and their purchasing power eroded by stubborn inflation, are now contending with cripplingly high interest rates. The cost of financing a home, a car, or even a credit card balance has soared, forcing a dramatic retrenchment in consumer spending. Businesses, facing the same high borrowing costs, are shelving expansion plans, cutting capital expenditures, and desperately trying to offload the mountains of inventory they accumulated just a year or two prior.
This has created a world of profound excess. Warehouses are overflowing. Shipping rates have collapsed from their pandemic peaks. Companies that were once scrambling for microchips are now announcing production cuts due to a glut. This oversupply is deflationary in nature, putting immense downward pressure on corporate profit margins. Businesses are caught in a vise: their costs remain elevated due to sticky wage inflation and higher energy prices, while their ability to pass on these costs is vanishing as consumer demand evaporates. This is the breeding ground for the "cracks" that are now becoming visible. The first casualties are the so-called "zombie companies"—firms that were only able to survive in a zero-interest-rate environment by constantly refinancing their debt. With borrowing costs now prohibitively high, they are facing a wave of defaults. The commercial real estate sector, already hollowed out by the work-from-home trend, is buckling under the weight of maturing loans that cannot be refinanced on favorable terms. Regional banks, laden with low-yielding, long-duration bonds and exposed to failing commercial property loans, are showing signs of systemic stress. The cracks are not isolated; they are interconnected, threatening a chain reaction of deleveraging and asset fire sales.
It is against this precarious backdrop of a weakening U.S. economy and a global supply glut that China’s sale of U.S. Treasuries must be interpreted. The move is not occurring in a vacuum. It is a calculated action within a deeply fragile geopolitical and economic context, and it carries multiple, overlapping meanings. On one level, it is a clear continuation of China’s long-term strategic objective of de-dollarization. For years, Beijing has been wary of its deep financial entanglement with its primary geopolitical rival. The freezing of Russia’s foreign currency reserves following the invasion of Ukraine served as a stark wake-up call, demonstrating how the dollar-centric financial system could be weaponized. By gradually reducing its holdings of U.S. debt, China seeks to insulate itself from potential U.S. sanctions and chip away at the dollar's status as the world's undisputed reserve currency. This $8.2 trillion sale is another deliberate step on that long march.
However, there are more immediate and tactical motivations at play. China is grappling with its own severe economic crisis. The nation is battling deflation, a collapsing property sector, and record-high youth unemployment. In this environment, its primary objective is to stabilize its own currency, the Yuan, which has been under intense downward pressure. A key strategy for achieving this is to intervene in currency markets. Paradoxically, this intervention often requires selling U.S. Treasuries. The process involves the People's Bank of China selling its Treasury holdings to obtain U.S. dollars, and then selling those dollars in the open market to buy up Yuan, thereby supporting its value. So, while the headline reads as an attack on U.S. assets, it is also a sign of China's own domestic weakness—a desperate measure to defend its own financial stability by using its vast reserves.
Regardless of the primary motivation—be it strategic de-dollarization or tactical currency management—the timing and impact of the sale are profoundly significant. It comes at a moment of peak vulnerability for the U.S. dollar and the Treasury market. The dollar has been extending massive losses not because of China’s actions alone, but because the underlying fundamentals of the U.S. economy are deteriorating. Markets are increasingly pricing in a pivot from the Federal Reserve, anticipating that the "cracks" in the economy will force it to end its tightening cycle and begin cutting interest rates sooner rather than later. This expectation of lower future yields makes the dollar less attractive to foreign investors, causing it to weaken against other major currencies.
China’s sale acts as a powerful accelerant to this trend. The U.S. Treasury market is supposed to be the deepest, most liquid, and safest financial market in the world. It is the bedrock upon which the entire global financial system is built. When a major creditor like China becomes a conspicuous seller, it sends a powerful signal. It introduces a new source of supply into a market that is already struggling to absorb the massive amount of debt being issued by the U.S. government to fund its budget deficits. This creates a dangerous feedback loop. More supply of Treasuries puts downward pressure on their prices, which in turn pushes up their yields. Higher Treasury yields translate directly into higher borrowing costs for the entire U.S. economy, further squeezing households and businesses, deepening the economic slowdown, and increasing the pressure on the Fed to cut rates, which in turn further weakens the dollar. China’s action, therefore, pours fuel on the fire, eroding confidence in the very asset that is meant to be the ultimate safe haven.
The contagion from this dynamic—a weakening U.S. economy, a falling dollar, and an unstable Treasury market—will not be contained within American borders. The cracks will spread globally, creating a volatile and unpredictable environment for all nations. For emerging markets, the situation is a double-edged sword. A weaker dollar is traditionally a tailwind for these economies, as it reduces the burden of their dollar-denominated debts. However, this benefit is likely to be completely overshadowed by the collapse in global demand. As the U.S. and other major economies slow down, their demand for raw materials, manufactured goods, and services from the developing world will plummet, devastating the export-driven models of many emerging nations. They will find themselves caught between lower debt servicing costs and a collapse in their primary source of income.
For other developed economies like Europe and Japan, the consequences are more straightforwardly negative. A rapidly falling dollar means a rapidly rising Euro and Yen. This makes their exports more expensive and less competitive on the global market, acting as a significant drag on their own already fragile economies. The European Central Bank and the Bank of Japan will find themselves in an impossible position. If they cut interest rates to weaken their currencies and support their exporters, they risk re-igniting inflation. If they hold rates firm, they risk allowing their currencies to appreciate to levels that could push their economies into a deep recession. This currency turmoil, originating from the weakness in the U.S., effectively exports America’s economic problems to the rest of the world.
Furthermore, the instability in the U.S. Treasury market has profound implications for every financial institution on the planet. Central banks, commercial banks, pension funds, and insurance companies all hold U.S. Treasuries as their primary reserve asset. The assumption has always been that this asset is risk-free and its value is stable. The recent volatility and the high-profile selling by a major state actor challenge this core assumption. This forces a global repricing of risk. If the "risk-free" asset is no longer truly risk-free, then the premium required to hold any other, riskier asset—from corporate bonds to equities—must increase. This leads to a tightening of financial conditions globally, starving the world economy of credit and investment at the precise moment it is most needed.
In conclusion, the abrupt sale of $8.2 trillion in U.S. Treasuries by China is far more than a fleeting headline. It is a critical data point that illuminates the precarious state of the global economy. It is a manifestation of the Great Unwinding, a painful transition away from an era of limitless, debt-fueled demand and toward a new reality defined by excess supply, faltering consumption, and escalating geopolitical friction. The underlying cause of this instability is the deep imbalance created by years of policy missteps, which have left the world with a glut of goods and a mountain of debt. The weakening U.S. economy and the resulting slide in the dollar are the natural consequences of this imbalance. China’s actions serve as both a symptom of this weakness and a catalyst for a deeper crisis of confidence in the U.S.-centric financial system. The cracks are no longer hypothetical; they are appearing in the banking sector, in corporate credit markets, and now in the bedrock of the system itself—the U.S. Treasury market. The tremors from this shift will be felt broadly, ushering in a period of heightened volatility, economic pain, and a fundamental reordering of the global financial landscape.

Bearish drop?US Dollar Index (DXY) has reacted off the pivot, which has been identified as a pullback resistance and could drop to the 1st support.
Pivot: 97.80
1st Support: 95.40
1st Resistance: 99.36
Risk Warning:
Trading Forex and CFDs carries a high level of risk to your capital and you should only trade with money you can afford to lose. Trading Forex and CFDs may not be suitable for all investors, so please ensure that you fully understand the risks involved and seek independent advice if necessary.
Disclaimer:
The above opinions given constitute general market commentary, and do not constitute the opinion or advice of IC Markets or any form of personal or investment advice.
Any opinions, news, research, analyses, prices, other information, or links to third-party sites contained on this website are provided on an "as-is" basis, are intended only to be informative, is not an advice nor a recommendation, nor research, or a record of our trading prices, or an offer of, or solicitation for a transaction in any financial instrument and thus should not be treated as such. The information provided does not involve any specific investment objectives, financial situation and needs of any specific person who may receive it. Please be aware, that past performance is not a reliable indicator of future performance and/or results. Past Performance or Forward-looking scenarios based upon the reasonable beliefs of the third-party provider are not a guarantee of future performance. Actual results may differ materially from those anticipated in forward-looking or past performance statements. IC Markets makes no representation or warranty and assumes no liability as to the accuracy or completeness of the information provided, nor any loss arising from any investment based on a recommendation, forecast or any information supplied by any third-party.

“The Dollar Job: Break-In Strategy for 99+ Profits”💸 “DXY Heist Blueprint: Thieves’ Bullish Breakout Play” 🏴☠️
🌟Hi! Hola! Ola! Bonjour! Hallo! Marhaba!🌟
Welcome, Money Makers & Silent Robbers 🕶️💼✨
This is our next big Thief Trading Heist Plan targeting the 💵 DXY Dollar Index Vault. Armed with both technical precision 🔍 and fundamental insight 📊, we're ready to strike smart — not just fast.
🎯 THE MASTER HEIST PLAN:
🟢 ENTRY POINT – “Heist Entry Protocol”
🎯 Wait for price to break above Resistance @ 99.000 and candle to close ✅
💥 Plan A: Place Buy Stop Orders just above breakout
📥 Plan B: For Pullback Pros, use Buy Limit at recent swing low/high (15m–30m TF)
📌 Tip: Set alerts — don’t get caught napping while the vault opens! ⏰🔔
🛑 STOP LOSS – “Thief’s Escape Hatch”
🧠 Use 4H swing low at 98.100 as SL
⚖️ Adjust based on your lot size and number of open positions
🚨 Don't rush to set SL for Buy Stop entries before confirmation! Patience is part of the plan. 😎
🎯 TARGET – “Mission Objective”
💰 First Exit Target: 100.000
🏃♂️ Optional: Escape earlier near high-risk zones (Blue MA Line Trap Area)
⚔️ SCALPERS' CODE – Stay Sharp!
Only scalp on the Long side.
🔐 Use Trailing SL to guard your loot!
💸 Big wallets? Jump early.
🧠 Smaller stack? Follow the swing crew for coordinated execution.
🌐 MARKET OUTLOOK: WHY THE VAULT’S OPENING
💡 Currently seeing bullish momentum in the DXY
📈 Driven by macroeconomics, sentiment shifts, and intermarket pressure
📰 Want the full debrief? Check our analysis across:
COT Data
Geopolitics & News
Macro Trends & Sentiment
Fundamental Forces
📎🔗 See full breakdown
⚠️ TRADE MANAGEMENT ALERT
🚫 Avoid opening new trades during high-impact news
🔁 Always use Trailing Stops to lock in profits
❤️ Support The Heist – Boost the Plan!
Every boost powers our underground crew 🐱👤.
We rob the markets, not the people. 💼💰
Like & Boost to help grow the Thief Trading Gang 👊💥
Stay tuned, robbers – more heist plans dropping soon.
💸🚀📈🤑

DXY BANK VAULT BREAK-IN: Your Dollar Index Profit Blueprint🚨 DXY BANK HEIST: Dollar Index Breakout Robbery Plan (Long Setup) 🚨
🌟 Hi! Hola! Ola! Bonjour! Hallo! Marhaba! 🌟
Attention, Market Robbers & Dollar Bandits! 🏦💰💸
Using the 🔥Thief Trading Style🔥, we’re plotting a DXY (Dollar Index) bank heist—time to go LONG and escape near the ATR danger zone. Overbought? Yes. Risky? Absolutely. But the real robbery happens when weak hands panic. Take profits fast—you’ve earned this loot! 🏆💵
📈 ENTRY: BREAKOUT OR GET LEFT BEHIND!
Wait for DXY to cross 99.300 → Then strike hard!
Buy Stop Orders: Place above Moving Average.
Buy Limit Orders: Sneak in on 15M/30M pullbacks (swing lows/highs).
Pro Tip: Set a BREAKOUT ALARM—don’t miss the heist!
🛑 STOP LOSS: DON’T GET LOCKED UP!
For Buy Stop Orders: Never set SL before breakout—amateurs get caught!
Thief’s Safe Spot: Nearest swing low (2H chart).
Rebels: Place SL wherever… but your funeral! ⚰️
🏴☠️ TARGET: 102.300 (Bank Vault Cracked!)
Scalpers: Long only! Trail your SL like a pro thief.
Swing Traders: Ride this heist for maximum payout.
💵 MARKET CONTEXT: DXY IS BULLISH (But Traps Await!)
Fundamentals: COT Reports, Fed Plays, Geopolitics.
Intermarket Sentiment: Bonds, Gold, Stocks—all connected.
Full Analysis: Check our bio0 linkks 👉🔗 (Don’t trade blind!).
⚠️ ALERT: NEWS = VOLATILITY = TRAP ZONE!
Avoid new trades during high-impact news.
Lock profits with trailing stops—greed gets you caught!
💥 SUPPORT THE HEIST (OR GET LEFT BROKE!)
Smash that Boost Button 💖→ Stronger team = bigger scores!
Steal profits daily with the Thief Trading Style. 🎯🚀
Next heist coming soon… stay ready! 🤑🐱👤🔥

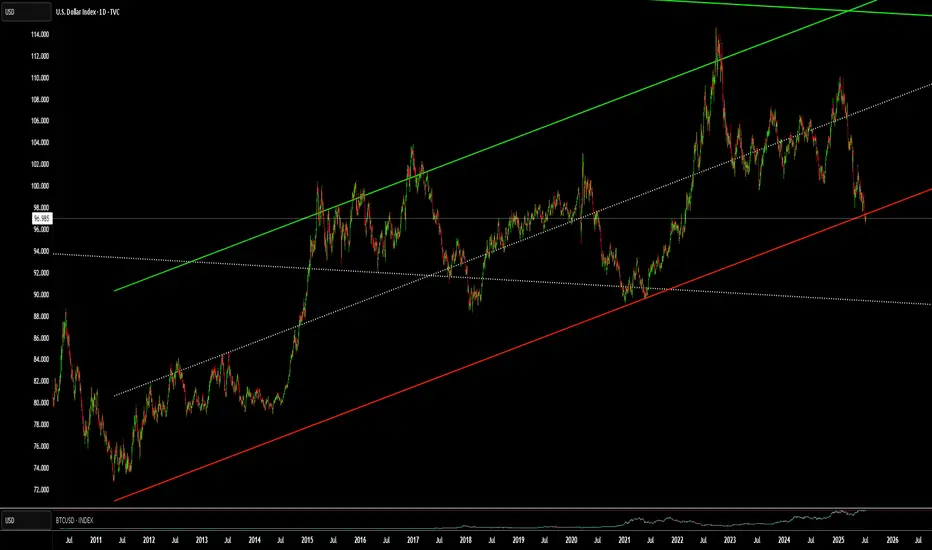
Make Dollar Great AgainDXY Big Picture
While looking at other DXY charts to use a clean chart for HTF, I saw that it touched historical trend support. It didn't touch only on the TVC chart, so I am adding it with the other charts and accepting that it touched the trend.
According to the fractal I added in August last year, the price is moving very well.
I expect a correction from these areas. I think we have reached the reversal areas due to both the momentum in the declines and the oversold.
The decline fatigue I mentioned is more evident in LTF charts. The price cannot reach the EQ zone of the decline channel that has been going on since February on the daily chart. Although it is a very inclined channel on the 4h chart, it can no longer reach the channel bottom. For this reason, I think this region is where reversal should be sought. After the first 0.38 of this decline, I think a pullback to 0.5 is possible.

Free fall on DXY?With gap open at 97.66 level before the monthly close price has broken the monthly support and started to drop. We may see the price to drop to long term monthly support at 96.622 or further below to 95.66 as with the increased bearish pressure we may see the price to continue to drop to this longer term support level.
As with upcoming USD news we may see the price to move to this level with high probability bearish trend.

Potential bulllish reveresal?The US Dollar Index (DXY) is falling towards the pivot, which aligns with the Fibonacci confluence and could reverse to the 1st resistance.
Pivot: 97.08
1st Support: 96.44
1st Resistance: 98.10
Risk Warning:
Trading Forex and CFDs carries a high level of risk to your capital and you should only trade with money you can afford to lose. Trading Forex and CFDs may not be suitable for all investors, so please ensure that you fully understand the risks involved and seek independent advice if necessary.
Disclaimer:
The above opinions given constitute general market commentary, and do not constitute the opinion or advice of IC Markets or any form of personal or investment advice.
Any opinions, news, research, analyses, prices, other information, or links to third-party sites contained on this website are provided on an "as-is" basis, are intended only to be informative, is not an advice nor a recommendation, nor research, or a record of our trading prices, or an offer of, or solicitation for a transaction in any financial instrument and thus should not be treated as such. The information provided does not involve any specific investment objectives, financial situation and needs of any specific person who may receive it. Please be aware, that past performance is not a reliable indicator of future performance and/or results. Past Performance or Forward-looking scenarios based upon the reasonable beliefs of the third-party provider are not a guarantee of future performance. Actual results may differ materially from those anticipated in forward-looking or past performance statements. IC Markets makes no representation or warranty and assumes no liability as to the accuracy or completeness of the information provided, nor any loss arising from any investment based on a recommendation, forecast or any information supplied by any third-party.

Gold breaks down and moves downward, focus on the 3300 markWith the official ceasefire between Iran and Israel, although there are some repeated frictions in the middle, under Trump's mediation, both parties are relatively tolerant. It seems that the war has been declared over. Gold has also fallen sharply. In the early trading, it fell sharply to around 3333 and stabilized. After rebounding to around 3357, it fell again under pressure. During the European trading session, it broke the low and continued. It repeated around 3317/8 and fell again under pressure around 3332. This position has become the key pressure point for the current top and bottom conversion. In the evening, the testimony of Federal Reserve Chairman Powell was also relatively cautious. He believed that inflation had declined, but it was still far from the 2% target. He tended to adjust interest rates after inflation achieved the target. Therefore, the double pressure caused gold to rebound weakly and repeatedly run weakly. At present, the lowest level reached 3304, which is one step away from the 3300 mark. Judging from the current trend, the overall weak pattern continues. In the evening, relying on the 3300 mark, try a long order for the last time, and then do a good job of continuing defense after the break.
6/24 Gold Evening Reference Ideas
Gold is long near 3303/05, defend 3298, target 3320/3330, short at 3298, defend 3305, target near 3276, short at 3330, defend 3337, watch 3316/08

Bearish drop?US Dollar Index (DXY) has reacted off the pivot and could drop to the 1st support.
Pivot: 98.59
1st Support: 97.69
1st Resistance: 99.25
Risk Warning:
Trading Forex and CFDs carries a high level of risk to your capital and you should only trade with money you can afford to lose. Trading Forex and CFDs may not be suitable for all investors, so please ensure that you fully understand the risks involved and seek independent advice if necessary.
Disclaimer:
The above opinions given constitute general market commentary, and do not constitute the opinion or advice of IC Markets or any form of personal or investment advice.
Any opinions, news, research, analyses, prices, other information, or links to third-party sites contained on this website are provided on an "as-is" basis, are intended only to be informative, is not an advice nor a recommendation, nor research, or a record of our trading prices, or an offer of, or solicitation for a transaction in any financial instrument and thus should not be treated as such. The information provided does not involve any specific investment objectives, financial situation and needs of any specific person who may receive it. Please be aware, that past performance is not a reliable indicator of future performance and/or results. Past Performance or Forward-looking scenarios based upon the reasonable beliefs of the third-party provider are not a guarantee of future performance. Actual results may differ materially from those anticipated in forward-looking or past performance statements. IC Markets makes no representation or warranty and assumes no liability as to the accuracy or completeness of the information provided, nor any loss arising from any investment based on a recommendation, forecast or any information supplied by any third-party.

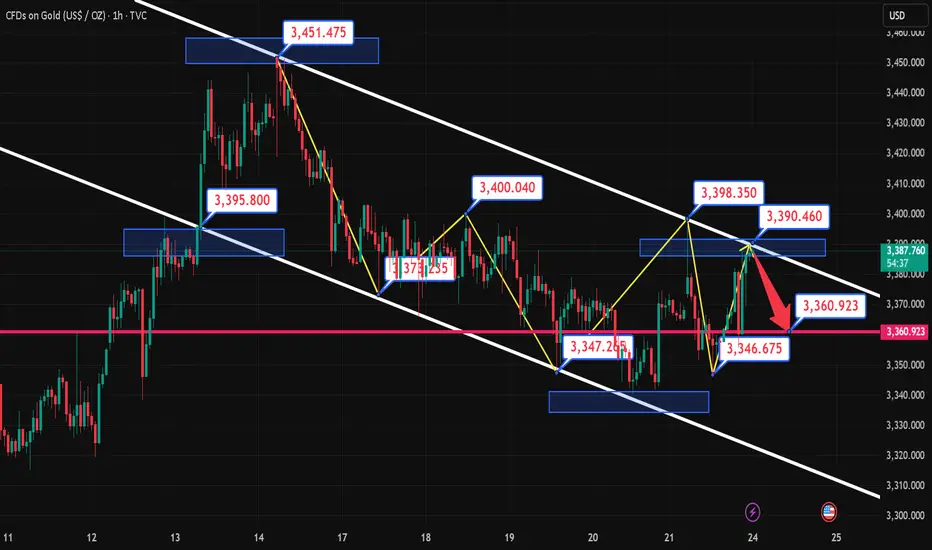
6.24 Gold resistance strengthens + kinetic energy exhaustionGold prices have fallen under pressure near $3,380 several times, and this area gathers three technical resistances:
1. The daily Bollinger band middle track 3,375 and the upper track 3,450 form a suppression.
2. The previous high of $3,400 plus the Fibonacci 38.2% retracement level constitutes a concentrated selling pressure area.
3. The previous high of $3,451 failed to break through effectively, forming a bearish structure with the second highest point moving down.
Risk of breaking the shock range: Gold continues to trade sideways in the 3,300-3,450 range, but the K-line continues to close in a small real body alternating yin and yang pattern, indicating that the long and short momentum is exhausted. If it falls below 3,350 , a technical sell-off will be triggered, with the target pointing to 3,300-3,330!
SELL: 3,388\3,393 Stop loss: 3,398
Target: 3,360
Profit point: 30
6.23 Gold Short-term Technical GuidanceThe current price is in the double-line interval of 3350-3375 on the hourly chart. Please note that the four-hour lifeline 3368 is also the resistance point determined by the last rebound in the Asian session.
The Asian session fell under pressure and returned to the sweeping range. It was treated as a sweep. The European session was able to hold the 3350 mark. Look up to find the 3368 area, followed by 3375 and 3385-3388.
If the European session falls below and closes below 3350, the short-selling forces are dominant. The four-hour lifeline 3368 is used as suppression. Look down to find 3333-3331, followed by 3320-3315

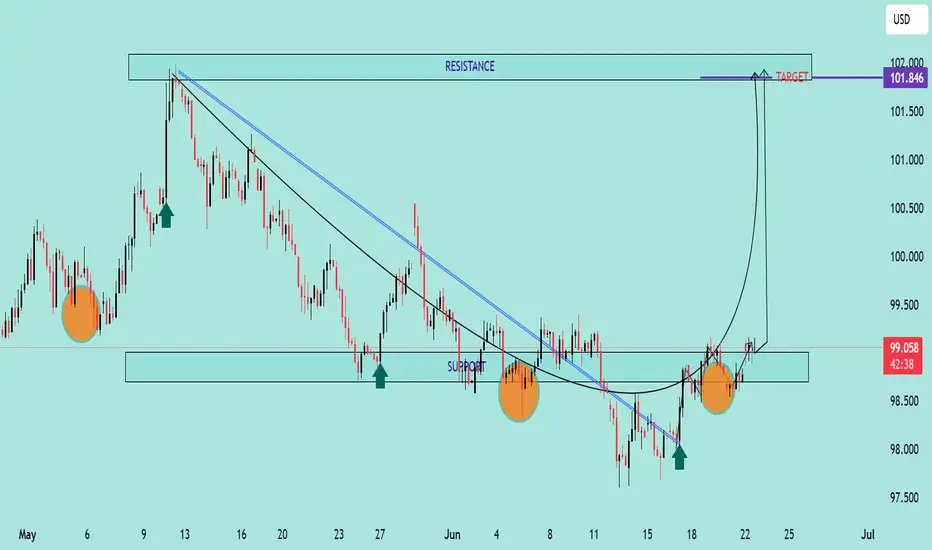
DXY Bullish Reversal & Cup Formation The DXY (US Dollar Index) is exhibiting a strong bullish reversal pattern, with multiple technical signals suggesting upward momentum:
🔍 Technical Analysis Summary:
✅ Support Holding Strong:
Price has respected the horizontal support zone around 98.00–98.50 on multiple occasions (highlighted by orange circles and green arrows), forming a solid base.
✅ Breakout from Downtrend:
A clear breakout above two descending trendlines (black and blue) indicates a shift from bearish to bullish sentiment.
✅ Cup Pattern Formation ☕:
A textbook Cup pattern is visible, where price formed a rounded bottom — a bullish continuation formation. The handle is minor and price has broken above the neckline (around 99.00), signaling a potential continuation toward the target.
✅ Bullish Target 🎯:
Based on the cup pattern and prior resistance, the projected target is around 101.846, aligning with previous major resistance.
📌 Key Levels to Watch:
Support Zone: 98.00 – 98.50
Immediate Resistance: 99.50 – 100.00
Major Resistance/Target: 101.846
🧭 Outlook:
As long as the price remains above the 98.50 zone, the bullish scenario remains intact. The cup breakout indicates strong buying pressure, and momentum could push DXY toward the 101.846 target in the coming sessions.
The DXY eince 1979 and Rate Rises / Cuts & the Crucial point NOW
What i want to draw your attention now, more than anything is simplay that DXY PA is on the line of Support created in the 2008 Crash
Thisis Crucial as if it drops belwo, that is the $ on the international stage loosing the strongest line of support it has ever had
If we look at the stage now, you will also see that the DXY was loosing traction BEFORE the FED began cutting Rates.
This is due to many things on the internationa stage, Like BRICS gaining momentum.
If we look closer, at the weekly chart since around 2017
We can see how the DXY has been Ranging, with a Few Peaks and Drops, the deepest being in 2021, just before the Bitcoin ATH that year.
It bounced well and hit a Peak in late 2022, when Bitcoin was in its Deep Bear.
DXY has ranged ever since j a tight range...
Untill this year
And now, we find DXY on that line of support once moew, Bitcoin maybe heading to a New ATH
But this time we have the serious threat of Global Mayhem
So, the thing to watch here, Like a HAWK, is if DXY can hold this line of support.
Can the $ regain international support and bounce OR will it Fall through this line of support ?
Or Range on it as in 2021
I am not going to pretend to know the answer but I certainly recommend we all pay attention to this- This could take a while................

DXYDXY needs some correction and further upside as upside isn't done yet.
Disclosure: We are part of Trade Nation's Influencer program and receive a monthly fee for using their TradingView charts in our analysis.

DXY US DOLLAR INDEXAs we can see on the chart, there’s a clear pattern emerging. The current movement of the index closely resembles the price action we saw between April 2015 and August 2018.
Assuming this fractal continues to play out, we could see more sideways movement until the end of the year — before a potential trend reversal kicks in.
