3.11 Gold’s short-term signal resistance levels are mixedSpot gold rebounded slightly in the Asian session on Tuesday (March 11) and is currently trading around $2,896.52 per ounce.
The technical signals of spot gold are a bit mixed. It has successfully stabilized near the support level of $2,879 per ounce and started to rebound. The focus on the resistance near 2,915 is on the top.
Between March 4 and March 7, a temporary top was formed in the range of $2,894 to $2,927. This indicates that the target is $2,861. However, after a brief confirmation, the top became invalid as the price of gold climbed above the neckline of the pattern at $2,894.
The rebound increases the possibility of resuming the upward trend from $2,832. A breakthrough of $2,909 will be seen as a strong signal to resume the upward trend.
Before the price of gold climbs above $2,915, the price of gold may still be biased to the downside, as the current rebound may just be a correction to the top, and the correction is a bit excessive.
On the daily chart, gold is also neutral in the range of $2891 to $2934, similar to the situation on the hourly chart.
When gold moves out of the range, the signal will become clearer. The wave pattern suggests that the market may experience a small decline first, followed by a strong rebound.
Dxyindex

Bearish drop?US Dollar Index (DXY) is rising towards the pivot which has been identified as a pullback resistance and could drop to the 1st support which is an overlap support that aligns with the 161.8% Fibonacci extension.
Pivot: 104.42
1st Support: 102.65
1st Resistance: 105.26
Risk Warning:
Trading Forex and CFDs carries a high level of risk to your capital and you should only trade with money you can afford to lose. Trading Forex and CFDs may not be suitable for all investors, so please ensure that you fully understand the risks involved and seek independent advice if necessary.
Disclaimer:
The above opinions given constitute general market commentary, and do not constitute the opinion or advice of IC Markets or any form of personal or investment advice.
Any opinions, news, research, analyses, prices, other information, or links to third-party sites contained on this website are provided on an "as-is" basis, are intended only to be informative, is not an advice nor a recommendation, nor research, or a record of our trading prices, or an offer of, or solicitation for a transaction in any financial instrument and thus should not be treated as such. The information provided does not involve any specific investment objectives, financial situation and needs of any specific person who may receive it. Please be aware, that past performance is not a reliable indicator of future performance and/or results. Past Performance or Forward-looking scenarios based upon the reasonable beliefs of the third-party provider are not a guarantee of future performance. Actual results may differ materially from those anticipated in forward-looking or past performance statements. IC Markets makes no representation or warranty and assumes no liability as to the accuracy or completeness of the information provided, nor any loss arising from any investment based on a recommendation, forecast or any information supplied by any third-party.

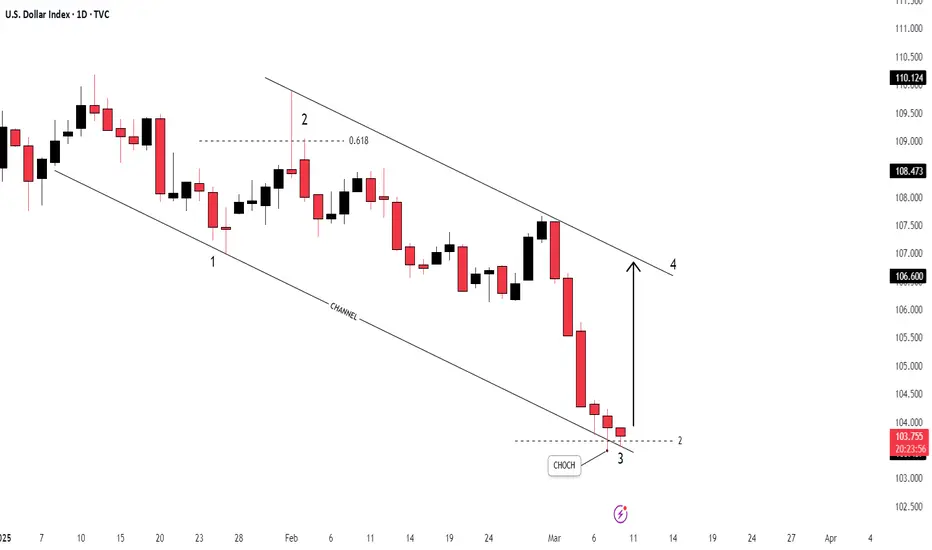
dxyDXY - U.S Dollar Index
Key Points in this Chart :
1. Change of Characteristics ( CHOCH )
2. Bearish Channel
3. Elliot Waves
4. RSI - Divergence
5. Support / Resistance
DXY|LONG UPDATEHello to everyone checking out this post!
Drop your thoughts in the comments! My outlook on the Dollar Index (DXY) is bullish. I believe it could start its upward move from the current level and continue its rally over the next few weeks. 📈🔥
Let me know what you think! 👇

DXY ( US dollar ) $ In my opinion, the index will continue to fall from 101.474 to 100.938, and then start to move up from that area to 107.255.

DXY (Dollar Index) Ready to BUY? | Monthly FVG in Focus! 💰 Smart Money Preparing for a Bullish Move on DXY!
The US Dollar Index (DXY) is approaching a key Monthly Fair Value Gap (FVG), which could act as a strong demand zone. If price reaches this level, we will look for confirmation on lower timeframes (H4/M15) before entering buys.
🔍 Why is this Important?
✅ Monthly FVG as a High-Probability Buy Zone
✅ Institutional Order Flow Aligning for a Bullish Reversal
✅ Strong Demand Expected at FVG
✅ DXY Strength = Bearish Pressure on Gold & Majors
📊 Key Market Levels:
🔹 Monthly FVG Buy Zone:
🔹 First Target:
🔹 Breakout Confirmation Above:
🔹 Invalidation Below:
⚡ Trading Plan:
📌 Wait for price to reach the Monthly FVG
📌 Look for Bullish Confirmation on H4/M15 (BOS, CHoCH, Liquidity Grab)
📌 Enter Buys Once Institutional Reversal is Confirmed
📌 Manage Risk – Watch CPI & FOMC Events
💥 Stronger DXY = Weak Gold & Bearish Pressure on Majors!
💬 Are you buying DXY at the Monthly FVG? Drop your thoughts below! 👇
#DXY #DollarIndex #Forex #SmartMoney #ICT #SMC #Liquidity #TradingView #OrderFlow

DXY will be fine (95)The dollar index expects to fall into the 95 area. Regardless of who wins tomorrow, the dollar will fall until 2025. The new government's realization of how sad everything is now will delay the process of a sound market. Vote!

Dollar idex is ready to drop next week are you ready ?This week, the market was slow with little movement. However, starting next week, keep an eye on the dollar. The order flow is showing a strong sell, and the daily chart reveals an FVG that indicates a sell from this level. Additionally, the current low aligns with the monthly FVG level. Trading next week should be exciting!

USD index $DXY to 100In this blog space we have discussed the FX:EURUSD and TVC:DXY index on 9th Feb. We said it looks like the FX:EURUSD is forming a local bottom, and the chart was showing lot of resilience. And we said that the next stop on FX:EURUSD will be 1.062 which it has recently surpassed. We also prophesized that because 60% of the TVC:DXY is EUR we might see more weakness in USD.
And now we see the TVC:DXY is below its 0.612 Fib retracement level @ 105. In the short term it is heading to 0.5 in the short term @ 102. We have seen that the index always bounced back when TVC:DXY is @ the psychological level of 100. If the TVC:DXY breaks below the support level @ 100 then it might go to 99 and eventually to 95.
But this USD weakness is not bringing any good news to the Stocks and Crypto. We have to wait until we see a final capitulation in $DXY.
If TVC:DXY goes to 95 then FX:EURUSD above 1.15.

DXY on high time frame
"Hello traders, focusing on DXY on high time frames, as per my previous analysis, the price has shifted towards a bearish direction. The price has reached the 110 zone, and candle formations are indicating a downtrend. I anticipate further pullback towards the 108 zone and potentially lower prices thereafter."
If you have any specific questions or need further assistance with your message, feel free to let me know!

US Dollar Index Short Term Sell IdeaH4 - Strong bearish momentum
Lower lows
Until the two strong resistance zones hold my short term view remains bearish here.

DXY will go first to 95 and then 86.Hi, another dollar index DXY chart today.
You can make many predictions about how the world will be in the future, I have all just cycles + structures and charts.
At this point, that opinion may not be in line with those policy statements by world leaders. But we're not here to discuss politics.
Best regards EXCAVO

Euro/Usd (Mar/06) for rest of the weekHello eveyone.
as you can see price at golden pocket (high to low).alos near cpr Monthly R3 .
I know it's scary to sell at thi moment but this is what i see in chart.
......................................
( This is an idea and entry-tp-sl placed for my own trade , you can change entry-tp-sl depends on your risk management )

DXY, About to rally upwardHello guys,
A short quick update on dollar index, we are going to see a temporary upward rally in the dollar index, I am just posting the low hanging fruit target which is very high probability to achieve. and we will defiantly see the momentum changing from bearish to bullish.
NFP protocol: Keep the risk low
3.5 Technical Analysis of Short-term Gold OperationsThe non-farm payrolls (NFP) and consumer price index (CPI) data to be released this week will be the focus of market attention. If the data is strong, especially the inflation data is higher than expected, the market may reduce the bet on the Fed to cut interest rates. The market currently expects the Fed to cut interest rates by 75 basis points this year, an increase from the 44 basis points expected last week.
Gold Technical Analysis - Daily Chart
From the daily chart, gold received support near $2,832 last Friday and rebounded to $2,900 driven by tariff concerns. However, from this time frame, market information is limited, so it is necessary to further zoom in on the analysis period to get more details.

Eur/Usd Mar/05 Daily biasHello eveyone.
i closed all my longs.last 2 days was great ( check my posts )
price is up almost 3% this week.price above cpr weekly 3rd res . so in this situation i think we will see a pullback.
i'm using tight stop loss.( today ADP...be carefull )
..............................
( This is an idea and entry-tp-sl placed for my own trade , you can change entry-tp-sl depends on your risk management )

DxyThis is a technical analysis of the U.S. Dollar Index (DXY) on a 2-hour timeframe. The chart indicates a bearish outlook, with price currently at 105.166 and showing signs of a downtrend.
Key Observations:
1. Downtrend Confirmation:
The price has been consistently forming lower highs and lower lows, suggesting bearish momentum.
2. Supply Zone (Red Box):
A red zone is marked at the top, indicating a possible resistance or supply zone.
This suggests that if the price moves back up into this area, it could face selling pressure and drop again.
3. Projected Price Action (White Box & Arrow):
The gray box below represents a potential target zone for the bearish move.
The zigzag pattern inside the box suggests a possible minor retracement before continuing downward.
Conclusion:
The analysis suggests a sell scenario if the price respects the supply zone and rejects it.
A break above the red zone would invalidate this bearish outlook.
The target area appears to be around 103.866, which aligns with a previous support level.
Would you like any modifications to this analysis?

Eur/Usd (Mar/04) Weekly biasHello everyone...
as you can see 1.05 to 1.054 is major resistance and if you go to monthly-weekly chart you can see that + weekly 21 ema + D 100 ema-ma
.............
but i think price can go above that area...
Monthly Open above Monthly pivot also right now price is above weekly pivot and euro attacked this area so many times...
( but if price can't close above 1.054 is bad for euro )
.......................................................
( This is an idea and entry-tp-sl placed for my own trade , you can change entry-tp-sl depends on your risk management )

3.5 Technical analysis of short-term gold operationsOn the first trading day of March, the US dollar index fell sharply. Data released by ISM showed that the US ISM manufacturing index in February was 50.3, lower than the expected 50.8, and the previous value in January was 50.9. 50 is the dividing line between prosperity and recession. Although the ISM manufacturing PMI continued to expand in January, the amplitude was small and tended to stagnate. Both new orders and employment shrank. At the same time, the material purchasing price index soared to the highest level since June 2022. After the data was released, the US dollar index fell further.
Gold rebounded sharply, challenging the 10-day moving average. The 5-day and 10-day moving averages still showed a dead cross. The daily RSI rebounded and reached the key pressure zone of 2900-10 in 4 hours. The short-term trend turned to bullish, but it was still not a strong bull market. You can wait for the opportunity to stabilize and go long near 2875.

Eur/Usd buy Idea Friday Feb/28going to buy euro at golden pocket...TP1 RR:2- TP2 RR:3
( check my last trades )
..............................................
( This is an idea and entry-tp-sl placed for my own trade , you can change entry-tp-sl depends on your risk management )

Dollar IndexWe are seeing Dollar strength this week, Seasonality and structure are playing in the favour of bulls this week.

DXY|LONG SETUPHello, I hope you have a great week ahead. This is my outlook for the Dollar Index, and please feel free to leave your comments and share your own perspective with me.
Initially, on the lower timeframes, I expect a rise to the 108.570 level and a potential breakout into this resistance zone. Afterward, I anticipate a drop to 105.888, which could mark the start of a sharp upward trend from this level. This is just my analysis, not a signal.

"Bearish Pressure on DXY: Key Levels to Watch"🔹 Technical Analysis of U.S. Dollar Index (DXY) - 4H Chart
▪️Market Structure & Trend Analysis:
- The chart shows a clear downtrend in the U.S. Dollar Index (DXY), with a series of lower highs and lower lows.
- The price is trading below the 200-period moving average (blue line) and 50-period moving average (red line), reinforcing bearish sentiment.
🔹Key Levels:
1. Strong Resistance Area ( 107.300 - 107.400)
- This is a significant supply zone where sellers have aggressively pushed the price down in the past.
- The price recently tested this area and failed to break higher, indicating strong resistance.
2. Resistance Level for Further Downside ( 106.700 - 106.800)
- The price is struggling to stay above this level, which has now become a short-term resistance zone.
- If price stays below this level, further downside is likely.
3. Target Area ( 105.453)
- This is the next major support level, where price could find buying interest and potentially reverse or consolidate.
▪️Market Expectation:
- Bearish Continuation:
- If price remains below the 106.700 resistance level, it is likely to continue downward towards the 105.453 target zone.
- Invalidation of Bearish Bias:
- If price breaks and closes above 107.400, it could signal a trend reversal or deeper retracement.
🔹Conclusion:
- Bias: Bearish
- Trading Plan: Look for sell opportunities below resistance zones and target 105.453 for a potential move lower.
😊Don't Forget To Hit The Like Button & Share Your Thoughts In Comments.
