The dollar suddenly increased after favorable news for America'sThe Fed has raised interest rates 11 times since March 2022, but inflation remains well above target and U.S. central bank officials are taking more aggressive action than in the past. This is thought to be due to a lack of monetary policy adjustment.
When Federal Reserve officials say their long-term inflation target is 2%, they are referring to the percentage growth in the Core Personal Consumption Expenditures Price Index (Core PCE) compared to the same period last year.
The more popular and often cited inflation figure is the year-over-year growth rate of the Consumer Price Index (CPI).
In fact, from May 2023 to the present, the six-month Treasury yield has been consistently above 5.3% and even above 5.5%. Additionally, approximately $1 trillion has been withdrawn from the reverse repo facility since May.
In other words, the U.S. federal government is pumping trillions of dollars previously siphoned out of the financial system by the Fed back into the economy through bonds with attractive yields.
The higher the yield, the more money flows into the financial system. This is one of the strange phenomena in the fight against inflation. The clearest evidence is that M2 money supply fell to a two-year low in April 2023, then stopped declining and even increased slightly in the following four months. Without a reduction in the money supply, it will be difficult to reduce inflation. The Fed tried to tighten monetary policy by raising interest rates and withdrawing money, while the U.S. government increased debt and injected more money into the economy to cover budget deficits. No matter how strong your hands are, you cannot clap loudly. No matter how hard the Fed tries, it will be difficult to control inflation if monetary policy runs counter to monetary policy.
Dxylong

DXY still shows no signs of breaking out of the trendlineThere has been little change in the market since the minutes of the Fed's monetary policy meeting were released in September. This highlighted concerns about U.S. economic growth and caused the Fed to become cautious about raising interest rates.
Dallas Fed President Rory Logan and Fed Director Christopher Waller have argued that rising U.S. Treasury yields in recent months could prompt the Fed to hold off on raising interest rates. Waller said on October 11 that higher market interest rates could help the Fed control inflation and allow policymakers to consider whether further rate hikes are necessary.
"Overall, the minutes indicate that Fed officials are increasingly concerned about recession risks to the U.S. economy," said Carl Schamotta, chief market strategist at Kopay in Toronto.
The recent weakness in the US dollar is due to a decline in US Treasury yields, with bond prices rising due to the Fed's "loose" stance on future interest rate hikes. Investors are now awaiting the release of the main inflation report today, October 12th, for further guidance on the future direction of interest rates. Additionally, the market is closely monitoring the conflict between Israel and the Islamic organization Hamas.
Conversely, the euro rose to $1.0634, its highest level since September 25th. Meanwhile, the pound rose to a three-week high of $1.2337.
Dutch central bank board member Klaas Nott said on October 11 that the ECB has made "important progress" in bringing inflation down to its target level, but there is still a long way to go and rules out the possibility of inflation rising. He said he could not. Interest rates may rise further in the future.

DXY Index will Go Down to 🟢Heavy Support zone🟢(1-Hour)⏰✅The DXY index managed to break the Uptrend line and 🟢 Support zone 🟢.
💫Currently, DXY reacted well to the Resistance line and formed a 💫Shooting Star Candlestick Pattern💫 near this line in the 1-hour time frame ⏰.
🔔I expect the DXY to trend lower in the coming hours , enter the 🟢 Heavy Support zone 🟢, and fall to at least the 🟡 Price Reversal Zone(PRZ) 🟡.
U.S.Dollar Currency Index ( DXYUSD ) Analyze, 1-hour time frame⏰.
Do not forget to put Stop loss for your positions (For every position you want to open).
Please follow your strategy; this is just my Idea, and I will be glad to see your ideas in this post.
Please do not forget the ✅' like '✅ button 🙏😊 & Share it with your friends; thanks, and Trade safe.

USD is showing positive signals amid tensions in the Middle EastEarlier this week, the safe-haven dollar strengthened against the euro as military clashes between Israel and the Palestinian Islamic militant group Hamas raised concerns that the conflict could spread beyond Gaza. However, the dollar weakened against other major currencies.
Yesterday, Israeli Prime Minister Benjamin Netanyahu said Israel's response to the multi-pronged attack by Palestinian armed groups from Gaza would "transform the Middle East." Risk sentiment is fragile as Israel announces it is mobilizing 300,000 reservists and imposing a complete blockade of Gaza amid potential attacks in response to weekend attacks by Hamas.
Fed member Bostic told the American Bankers Association that even if the Fed raises interest rates to slow the economy while keeping inflation in check, there is no prospect of a recession. Joseph Trevisani, a senior analyst at FX Street in New York, said Bostic's response comes amid the eruption of conflict in the Gaza Strip.
Analysts also said the decline in U.S. yields initially reflected comments from Fed officials that there may not be a need for further rate hikes given the rise in long-term yields, and the port sector becoming a safe-haven asset following a monetary policy clash. He said this was due to comments from traders who were looking for. Hamas and Israel.
Traders are currently waiting for key US inflation figures to be released today, October 11th. Investors are also keeping an eye on developments surrounding the conflict between Israel and the Palestinian Islamic group Hamas.

Dollar Index -> Plain And SimpleMy name is Philip, I am a German swing-trader with 4+ years of trading experience and I only focus on price action and market structure 🖥️
I am trading the higher timeframes because this allows me to massively capitalize on the major market swings and cycles without getting caught up in the short term noise.
This is how you build real long term wealth!
In today's anaylsis I want to take a look at the bigger picture on the Dollar Index.
Over the past couple of years, the Dollar Index has been trading in a quite solid rising channel and jusr recently perfectly retested and already started to reject the psychological $102 level. I do expect more continuation towards the upside to retest the upper resistance trendline.
- - - - - - - - - - - - - - - - - - - -
When the market moves where, and how, and if - these are all unknown.
The only thing which you can control is your risk.
- Philip Basic Trading -
Keep the long term vision🫡

DXY will Fall by Head and Shoulders Pattern⏰(1-Hour)⏰✅The DXY Index has managed to form a Head and Shoulders Pattern in the 🔴Resistance zone🔴.
🔨DXY broke the 🟢 Support zone 🟢 and Neckline hours ago.
🔔I expect DXY to start falling again to 🟡 Price Reversal Zone(PRZ) 🟡and Uptrend line after completing the pullback to Neckline .
U.S.Dollar Currency Index ( DXYUSD ) Analyze, 1-hour time frame⏰.
Do not forget to put Stop loss for your positions (For every position you want to open).
Please follow your strategy; this is just my Idea, and I will be glad to see your ideas in this post.
Please do not forget the ✅' like '✅ button 🙏😊 & Share it with your friends; thanks, and Trade safe.

Potential for Continued Rise in US Dollar as Bond Yields SpikeBond yields have been on the rise lately, and this trend may continue in the near future. As a result, it is crucial to approach the situation with caution and consider the potential opportunities it presents.
The correlation between bond yields and the US dollar is well-established. When bond yields increase, it often attracts foreign investors seeking higher returns, leading to an appreciation in the value of the US dollar. Given the recent spike in bond yields, it is reasonable to anticipate a continued rise in the US dollar's value.
However, it is important to note that market dynamics can be unpredictable, and various factors can influence currency movements. Therefore, I encourage you to exercise prudence and conduct thorough analysis before making any trading decisions. Here are a few factors to consider:
1. Monitor Economic Data: Keep a close eye on economic indicators such as inflation rates, employment figures, and GDP growth. These data points can provide insights into the overall health of the US economy and its potential impact on the currency.
2. Central Bank Policies: Stay informed about any shifts in monetary policies by the Federal Reserve. Changes in interest rates or quantitative easing measures can significantly influence the US dollar's trajectory.
3. Global Events and Geopolitical Risks: Consider geopolitical developments and their potential impact on the US dollar. Factors such as trade tensions, political instability, or unexpected events can create volatility in the currency markets.
Considering the potential for the US dollar to continue its rise, it may be prudent to explore long positions on the currency. However, I strongly urge you to conduct thorough research and consult with your financial advisors before making any investment decisions. Remember, trading involves inherent risks, and it is crucial to carefully assess your risk tolerance and financial goals.
As always, it is essential to stay updated with the latest market news and trends. By staying informed and adopting a cautious approach, you can navigate the currency markets more effectively.
Wishing you successful trading ahead!

Celebrating the Bright Future of the US Dollar! 🌞I bring you fantastic news that will surely make your day even brighter. The upcoming job report expect to have an impressive addition of 150,000 new jobs, coupled with a lower unemployment rate. This remarkable achievement will set the stage for an exciting journey ahead for the US dollar!
The US economy continues to demonstrate its resilience and strength, and these latest figures are a testament to that fact. With each passing day, the US dollar is becoming an even more attractive investment opportunity. As traders, it is essential to recognize and seize the potential this brings to our portfolios.
So, what does this mean for you? It's time to consider a long position on the US dollar! The positive job report signals a favorable market sentiment and reflects the growing confidence in the US economy. By taking advantage of this upward trend, we can position ourselves to reap the benefits of a strengthening US dollar.
Here are a few compelling reasons why you should consider going long on the US dollar:
1. Economic Growth: The addition of 150,000 new jobs indicates a robust and expanding economy. This growth is likely to fuel increased consumer spending and business investments, further bolstering the value of the US dollar.
2. Lower Unemployment: The decrease in the unemployment rate signifies a healthier labor market, which translates into higher wages and increased consumer confidence. As disposable incomes rise, so does the demand for goods and services, ultimately benefiting the US dollar.
3. Global Safe Haven: In times of uncertainty, the US dollar has historically been a safe haven for investors. With its strong economic fundamentals and stable political environment, the US dollar is likely to attract capital flows, driving its value higher.
Now is the time to act! As traders, we have the opportunity to capitalize on this positive news and optimize our investment strategies. By going long on the US dollar, we position ourselves to potentially unlock substantial gains in the future.
Remember, successful trading requires staying informed and making well-informed decisions. Keep a close eye on market trends, economic indicators, and geopolitical events that may impact the US dollar's performance.
Let's embark on this exciting journey together, riding the wave of optimism and prosperity that lies ahead. Long live the US dollar!

The future of the Dollar - EllisonCapitalThe dollar is very important to understand through 2024 because it is your primary market driver on dollar pairs with its position as the world reserve currency.
During times of economic global turmoil, even though the US economy may be facing weakness, if global economies are facing weakness then the dollar will still hold appeal from a market perspective as a safe haven currency and as the world reserve currency as it is still backed by the largest economy in the world. 90% of business transactions are held in the dollar and it's still the only currency that oil is denominated by.
Now when you look at the dollar you can see it had a very short downside at the start of the pandemic. Why? Obviously, interest rates were dropped to zero and the money supply was exponentially increased. This meant less demand for the dollar because all of the demand was in risk assets in the stock market. After all, the FED was pumping the market, meaning more supply of the dollar. But the price only pulled back into the support and demand zone at 90.
Then in late 2021s when we had Russia invading Ukraine, you started to see some more appeal in the dollar as a safe haven currency. But more importantly, in 2022 feds began the most aggressive rate hike cycle ever seen, this saw the dollar with excessive upside volatility.
This is dangerous as it creates a lot of negative implications for global debt obligations on other country's currency values and global business activity. When the dollar goes up too fast, it has a lot of downsides for other global countries. Hence during this period, we saw major countries such as China, Japan and the UK perform currency interventions because their currency is already devaluing on top of the dollar being so strong. Especially on the macro rate differential between the Bank of Japan and the Federal Reserve.
Nonetheless, we can see we had this large rally/ impulsive bullish moves/ new higher timeframe highs being printed that we haven't seen since the 2000s. So still maintaining a beautiful macro bullish structure from a technical perspective too, Now we've had this aggressive correction and pullback phase.
This is due to inflation starting to drop because of the Fed's front loading of rate hikes and inflation starting to come back into a tricky zone. The majority of rate hikes were priced in and the price seemed to be setting up for 2023, but that pullback is still a 50% correction of this overall rally from late 2021. It also is conveniently retesting that area we broke above.
Inflation is still seeing trouble at the 2% point and to maintain that the feds are going to keep rates up and if geopolitical tensions are going to continue to escalate on a global stand and we don't trade above the 101s we could easily see the dollar trending back to these highs. Just not as impulsive, but slowly and more steadily. We could easily see the dollar from a macro perspective going into the 120s. Why is this so important? Well if this occurs, especially going into 2024 and we don't see the dollar breaking below 101, US inflation will still have trouble hitting that precious 2% target they want so badly.
It's going to be a lot easier playing Eur/USD sells with this dollar bullishness.
Simply put on EUR/USD there will be less demand for the Euro versus the Dollar. If the EU can't trade back above 1.13, overall I'm going to be expecting the price to return back down to those parity points 1.0 and potentially lower in a slow and steady fashion.

What about DXY and the effect on BTC?There are several factors that could contribute to a sharp increase in the value of the US dollar in the future:
Strong economy: If the US economy is doing well compared to other economies, it can boost confidence in the US dollar and attract investors. Strong GDP growth, low unemployment, high investment and innovation may be factors contributing to increased demand for dollars.
Higher interest rates: An increase in interest rates by the US central bank (Federal Reserve) may increase the attractiveness of the US dollar. Higher interest rates can attract capital from other countries and boost demand for dollars, which could lead to dollar growth.
Geopolitical instability: In the event of political or geopolitical uncertainties, such as conflicts, trade disputes or global crises, the US dollar can be seen as a safe haven. In such situations, the demand for dollars could increase, which could result in an increase in its value.
Dominance of the dollar in the international market: The US dollar is still the most used reserve currency in the world and the main currency for international trade. If this dominance continues, it may strengthen the dollar's position and contribute to its growth.
A rise in the value of the dollar can affect the price of cryptocurrencies, including Bitcoin (BTC), in several ways:
Inverse relationship: There is a tendency for the value of the dollar and the price of cryptocurrencies to have an inverse relationship. This means that if the value of the dollar increases, it can result in a decrease in the price of cryptocurrencies, including Bitcoin. This is because investors may turn to stronger traditional currencies such as the dollar and leave riskier assets such as cryptocurrencies.
Currency Pairs: If the dollar strengthens against other currencies, it may affect trading between cryptocurrencies and those other fiat currencies. For example, if the value of the dollar increases against the euro, then the value of Bitcoin in the BTC/EUR exchange rate may decrease.
Global Economic Factors: A rise in the value of the dollar may be a result of a strong US economy, which may signal the risk of lower volatility and less uncertainty. This may cause some investors to prefer traditional assets such as the dollar instead of cryptocurrencies, which are considered riskier.
So what friends? are you still going to feed this money machine?
Try my indicator for trading and generally keep an eye on things

DXY MOMENTUM 108The dollar is keep on the rise while the FED Pause there Hikes.
So we wait this zone 108 for filling its 4hr GAPS. But tonight More FEDs member speech. ISM later 10pm asia .
This is my view and my top of the DOLLAR. only this month ranging around 108.
Trade at your own risk.
Follow for more ...This idea is base

$DXY Quarter 3 (Q3) AnalysisThe U.S. Dollar Index had a bullish Q3 and has been bullish month after month. There is a bullish bounce off the EMA ribbon with $101 acting as a strong support level. I believe DXY is headed towards the top of the Bollinger Band with wicks forming above at approximately $112-114 (marked by the white circle).

🏆Holy Grail🏆 Shows the DXY Index will increase🚀🏃♂️The DXY index has been moving above the Uptrend line for more than 2 months .
✅ The DXY index managed to break the 🔴 Resistance zone($105.8-$104.5) 🔴 last week.
↘️ In the last week, we saw the DXY pull back to the 🔴 Resistance zone($105.8-$104.5) 🔴.
🏆Today, I analyzed the possible trend of the DXY Index for the coming week using the 🏆Holy Grail Strategy🏆 .
📚Getting to know the 🏆Holy Grail strategy🏆
Holy Grail is one of the strategies described by Linda Raschke and Laurence Connors in their book “Street Smarts”. The name of the strategy is mocking because it is super simple. It suits timeframes from M1 to MN and any instrument in Forex, futures, and stock markets.
The desktop of the strategy consists of one simple Exponential Moving Average (20), applied to Close prices, and the ADX indicator with standard parameters and the marked level 30.
The idea of the strategy is that ADX shows the strength of the trend on a certain period. Some traders think that a reversal of this indicator top-down signals a trend reversal but this is not always true, the correctness of this idea depends on whether we are trading in a flat or trend. We do not care about flats, so this is what the EMA (20) is necessary for: its slope shows the direction of the current trend.
📚A signal to buy
A signal to buy by the Holy Grail forms when ADX rises above 30, following the growth of the price; after that, the price must pull back to the EMA (20) and touch it. When the candlestick that has touched the EMA closes, place a buying order above the high of the candlestick with the initial Stop Loss below its low. As for the Take Profit, place it slightly below the highest local high that formed after the price pulled back to the EMA (20). If the next candlestick does not trigger the buying order, and its high turns out below the preceding candlestick, place the order above this candlestick. And if its low renews the low of the previous candlestick, place the SL below the former. Of course, ADX will be falling alongside the price. However, for the signal to be valid, ADX must not fall below 30.
🔔According to the Holy Grail strategy and the Hammer Candlestick Pattern, which indicates the completion of the pullback to the broken 🔴 Resistance zone($105.8-$104.5) 🔴, I expect DXY to have an upward trend in the coming week and can increase to the 🔴 Resistance zone($109.3-$107.7) 🔴.
U.S.Dollar Currency Index ( DXYUSD ) Analyze, Daily time frame⏰.
Do not forget to put Stop loss for your positions (For every position you want to open).
Please follow your strategy; this is just my Idea, and I will be glad to see your ideas in this post.
Please do not forget the ✅' like '✅ button 🙏😊 & Share it with your friends; thanks, and Trade safe.

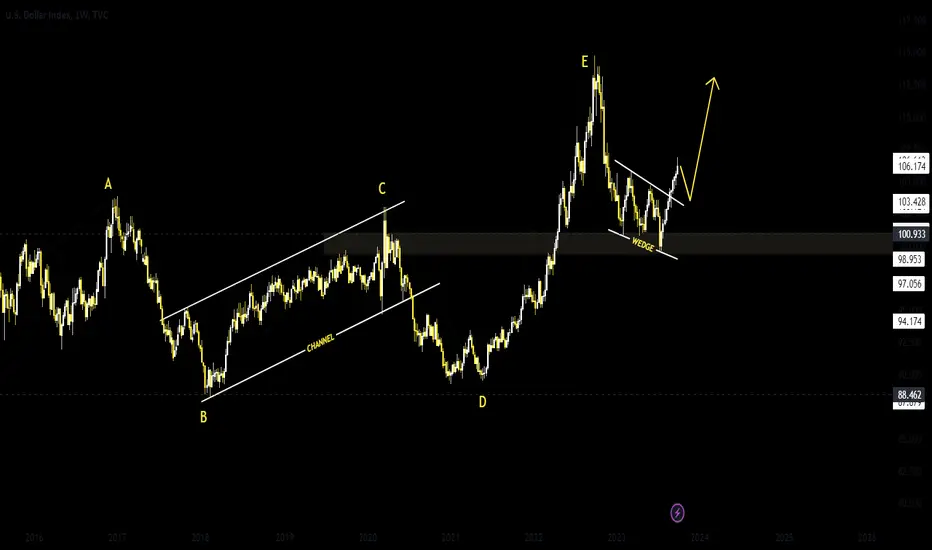
DXY Index New Week MovePair : DXY Index
Description :
Breakout the Upper Trend Line of the Consolidation Phase and Completed the Retracement. Completed Impulse and Corrective Waves " ABC ". It has Breakout the Upper Trendline of the Corrective Pattern Falling Wedge in Short Time Frame
DXY AnalysisThe dollar index still bullish and I'm still expecting it to head higher next week to take the highs 106.840 and maybe even higher from a long term perspective,
we are maybe going to see a retracement into the FVG and then a push higher .

Dollar Breaks above a 2023 HighThe US dollar index remains bullish as the price closes above the 105.883, 2023 high. The bias will likely draw the market towards the 21 November 2022 high, at 107.993, buy-side Liquidity. The 11-month high coincides with a weekly Fair Value Gap. The uncertainty of the US government shutdown will trigger risk aversion along the seasonal shifts as 3rd quarter comes to a close.

DXY BULL ContinuationsOn 30min, looking for pullback on DXY, to take out last trading day low's liquidity before continue to buys again till 107 zone

"DXY's Upward Trajectory Amid September Caution"In the upcoming week, my optimism remains steadfast. The DXY continues to exhibit an upward trajectory, with its target poised in that direction. The recent Break of Structure (BOS) formation on a higher time frame solidifies my conviction in the DXY's potential for further up move. However, a measure of caution stems as approaching month of September. It's worth noting that historical DXY seasonality contradicts the current chart dynamics.
My focus will be keenly set on the upcoming week, particularly post Wednesday. The release of Non-Farm Payrolls (NFP) news will undoubtedly steer market sentiments, presenting us with intriguing opportunities. To me, Tuesday and Wednesday hold significance, as these days dedicated to capitalize on potential market moves. In case the circumstances do not align favorably, I will sit and wait for good opportunity

DXY Analysis - Weekly Timeframe (ICT)How convenient it was to stop right at the descending trendline for the week. In my eyes, this is giving time for traders to formulate their "predictions" on where DXY is going to go. I expect some funny business to happen to shake out any support & resistance, as well as breakout traders, culminating with an explosive movement to the upside.
I really like the Weekly Bearish Breaker Block residing above as a point of interest for trades, which may take a while to get there. I will also be observing how price moves towards that area, if it even does.
Next week, keep your guard up. Don't take the bait. Wait for the sheep to get slaughtered, and once you see that already come to past on the charts, that is the time to strike.

DXY By HesamUNThey traders
Let's take a look at U.S Dollar Index
DXY is playing at the Weekly Swap area, Also confirmed By Golden Ratio
Golden Ratio always worth it 2 Risk
What u think about DXY ?
Share your chart and Leave a comment

AUD/USD clean 4H Technical setupAUDUSD currently has a score of -10, or a Strong Sell rating after adding up all categories. First, let's look at what institutional traders are buying/selling. We can see that theAUD has a long percentage of 35.19%, and we see that the USD has a long percentage of 69.73%. This category receives a -2, as institutional traders favor the USD.
Taking a look at AUDUSD, we see that retail traders are 88% long, and 12% short. We consider this information most useful when a market is at an extreme reading from retail traders. If the retail crowd is 60% or more positioned to one side, we get a +1 or -1. Currently, theAUDUSD gets a reading of -1 in this category. Remember, if the retail crowd is very long, we will look to short, and vice versa.
Taking a look at seasonality, we get a score of -1. What this tells us is that based on historical data, this market tends to fall during this month.
Trend reading is based on the daily chart, using the 5, 8, and 21 Exponential Moving Average. The more 'aligned' they are, the stronger the trend up or down. In this case, we have a score of -2.
Finally, let's look at fundamentals. GDP growth favors the USD, inflation favors the USD, unemployment favors the USD and interest rates favor the USD
Check my other USD ideas in mmy profile and follow for more!

DXY Index New Week MovePair : DXY Index
Description :
Completed Impulsive Waves " 12345 " and " a " can Possibly Reject from Fibonacci Level - 38.20% / 50.00%. We have Bearish Channel as an Corrective Pattern in Short Time Frame with the Breakout of the Upper Trend Line and Retracement

Celebrating the Soaring US Dollar and Its Impact on Oil and the The US dollar has been on an impressive rise, leading to a remarkable domino effect on the oil market while simultaneously lowering the Euro. Let's dive into the details and explore the exciting opportunities this presents for all of us!
First and foremost, let's celebrate the recent surge in the US dollar. This upward trajectory has been fueled by a combination of robust economic indicators, positive investor sentiment, and the Federal Reserve's commitment to maintaining a stable currency. As traders, we understand the significance of a strong US dollar, and it's time to capitalize on this favorable trend!
The rising US dollar has an immediate impact on the oil market, as it becomes more expensive for countries with weaker currencies to purchase oil. This translates into increased demand for the US dollar in oil transactions, further driving up its value. So, let's keep an eye on the oil market and identify potential trading opportunities that can be leveraged to our advantage.
Simultaneously, the Euro has experienced a decline against the US dollar. This can be attributed to various factors, including economic uncertainties, political developments, and the divergence in monetary policies between the European Central Bank and the Federal Reserve. As traders, we can seize this opportunity to capitalize on the Euro's weakness and further strengthen our positions in the US dollar.
Now, let's move on to the call-to-action! I encourage each and every one of you to continue to long the US dollar, as it shows no signs of slowing down. By strategically aligning our trading decisions with this ongoing trend, we can maximize our profits and achieve extraordinary success in the currency markets.
Remember, timing is crucial in the world of trading, and the current market conditions are ripe for us to make a significant impact. Stay informed, keep a close eye on the latest economic news, and utilize the tools at our disposal to make well-informed trading decisions.
As always, I am here to support and guide you on this exciting journey. If you have any questions, need assistance, or simply want to share your success stories, please don't hesitate to comment. Let's make the most of this golden opportunity and continue to thrive in the world of trading!
Wishing you fruitful trades and abundant profits!
