DXY PREDICTION ON 18.08.2023The DXY, also known as the U.S. Dollar Index, measures the value of the U.S. dollar relative to a basket of six major world currencies: the Euro, Japanese Yen, British Pound, Canadian Dollar, Swedish Krona, and Swiss Franc. When we say that the DXY is going up, it signifies that the U.S. dollar is strengthening against these other currencies. There are several reasons that could contribute to a rising DXY:
Economic Strength: If the U.S. economy is performing better than other major economies, it can lead to an appreciation in the dollar. Indicators of economic strength include GDP growth, employment figures, manufacturing output, and consumer confidence.
Interest Rates: Central banks around the world adjust interest rates as a way of controlling inflation and influencing their domestic economies. A rise in the U.S. Federal Reserve's interest rates (or expectations of a rise) can lead to an increase in foreign capital inflows, as investors seek higher returns. This can drive up demand for the dollar.
Geopolitical Stability: In times of global uncertainty or geopolitical tensions, investors often flock to what are considered "safe-haven" assets. The U.S. dollar, due to the size and stability of the U.S. economy, is often seen as such an asset. So, during turbulent times, demand for the dollar can increase.
Trade Balances: If the U.S. exports more than it imports, there will be higher demand for the dollar. Similarly, if there are changes in global trade dynamics or policies that favor U.S. exports, it could strengthen the dollar.
Speculation: Forex markets, where currencies are traded, are highly speculative. Traders' perceptions and strategies can drive short-term movements in the DXY, even if they aren't always based on economic fundamentals.
Relative Monetary Policies: If other central banks are pursuing more aggressive monetary easing policies than the U.S. Federal Reserve, their respective currencies may weaken relative to the dollar, leading to a rise in the DXY.
Debt and Fiscal Policy: Confidence in a country's fiscal policy and its ability to manage its debt can influence its currency strength. If investors have faith in the U.S. government's ability to manage its fiscal affairs, it can boost the value of the dollar.
Dxylong

Will DXY USD Rise Due to BRICS Alternative Currency Credibility?
Introduction:
Traders are often on the lookout for potential opportunities and risks that can impact the forex market. Recently, the credibility of the BRICS alternative currency has come under scrutiny, leading many to wonder if this could fuel a rise in the US Dollar Index (DXY). In this article, we explore current affairs and discuss why traders may consider longing for the dollar amidst these uncertainties.
The BRICS Alternative Currency Credibility:
The BRICS (Brazil, Russia, India, China, and South Africa) nations have been exploring the possibility of establishing an alternative currency to reduce their dependence on the US dollar. This move aimed to challenge the dollar's dominance in international trade and finance. However, recent developments have raised concerns over the credibility of this alternative currency.
Factors Affecting BRICS Alternative Currency:
1. Economic Disparities: The BRICS nations vary significantly regarding economic growth, political stability, and fiscal discipline. These disparities can undermine the credibility of the proposed alternative currency, as it requires a solid foundation to gain trust and acceptance in the global market.
2. Political Challenges: The BRICS countries face differing political ideologies, hindering their ability to maintain a unified front. Disagreements over economic policies, trade practices, and geopolitical tensions can weaken the credibility of the alternative currency, potentially favoring the US dollar.
3. Global Economic Uncertainty: The ongoing COVID-19 pandemic and its aftermath have caused economic uncertainties worldwide. In such times, investors often seek refuge in safe-haven currencies such as the US dollar, further bolstering its value.
Why Consider Longing the Dollar?
Given the potential challenges faced by the BRICS alternative currency, traders may find it prudent to consider longing the US dollar. Here are a few reasons to support this stance:
1. Safe-Haven Status: The US dollar has historically been considered a haven currency during economic uncertainty. As market participants seek stability, the dollar strengthens, making it an attractive option for traders.
2. Global Reserve Currency: The US dollar is the world's primary reserve currency. This position grants it significant influence and liquidity, making it a preferred choice for international transactions. Any threat to the credibility of the BRICS alternative currency could further solidify the dollar's dominance.
3. Market Sentiment: Traders often base their decisions on market sentiment. If doubts surrounding the BRICS alternative currency persist, it could lead to a loss of confidence among investors. This shift in opinion may drive them towards the US dollar, potentially causing an upward movement in the DXY.
Call-to-Action: Long the Dollar
Considering the uncertainties surrounding the credibility of the BRICS alternative currency, traders are urged to evaluate the potential risks and rewards carefully. In light of the factors discussed, longing the US dollar could be a prudent strategy to consider. However, conducting thorough research, analyzing market trends, and consulting with financial advisors to make informed decisions are essential.
Conclusion:
As the credibility of the BRICS alternative currency faces threats, traders are left wondering about the potential impact on the US dollar. While uncertainties persist, the dollar's safe-haven status, global reserve currency position, and market sentiment may strengthen it. Traders are encouraged to closely monitor market developments and consider longing the dollar as a potential strategy in these uncertain times.

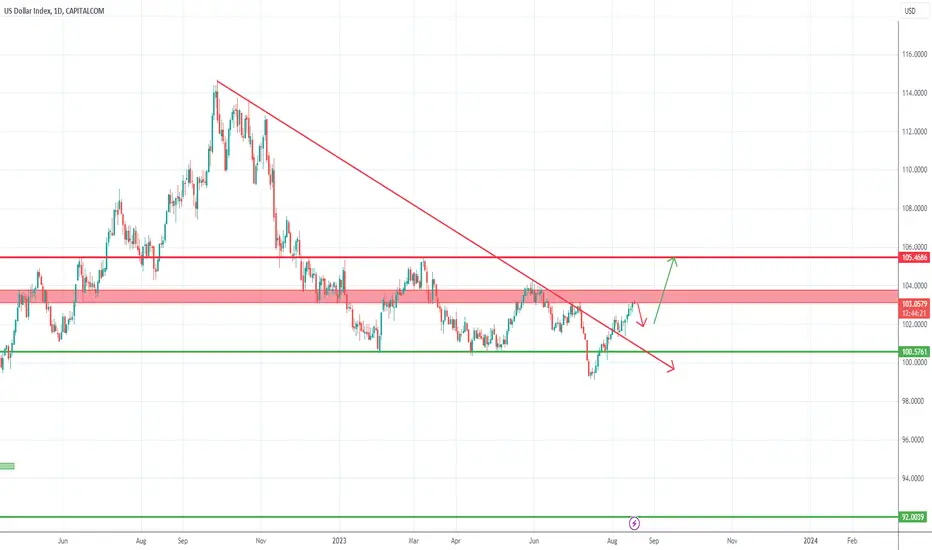
DXY- New leg up after correction?In my previous DXY analysis, I said that, after the false down break, DXY could reach 103.50 zone and also break above the falling trend line.
The target zone was reached and now, considering the importance of this resistance, a correction could follow.
However, in my opinion, the medium to long term trend for USD has changed back to bullish and this correction should be used for selling pairs like: EurUsd, GbpUsd, AudUsd and NzdUsd
DXY swing long - back into the rangeDXY took out a key low at 101 with strong reaction back up into the range established in August-September 2022.
Idea: DXY will strengthen in upcoming months, pushing the risk on lower.
Target for lower highs is around 50% of established range, which for fans of Fibonacci retracement tool is around 0,618-0,705 of current range.
Target Price: 110-111
If we see strength around these levels, top of range or new highs will be on the cards.

DXY IndexDXY Index
On his way to 101.2 , after that he continues to climb to 107
US Dollar Currency Index (DXYUSD) Analysis, timeframe 1 day .
Don't forget to place a stop loss order for your trades (for each position you want to open).
Please follow your strategy, this is just my idea, I will be glad to see your thoughts in this post.
Please don't forget the "Like" button 🙏 and share it with your friends; Thanks, trade safely.

🔔DXY is ready for Pull Back🔔As I expected, DXY broke the resistance lines , and now DXY is moving near the 🔴 resistance zone($103.80-$103.38) 🔴.
🌊According to Elliott wave theory , DXY completed 5 impulse waves at the resistance zone.
🔔I expect DXY to drop to at least the uptrend line in the next few hours.
U.S.Dollar Currency Index ( DXYUSD ) Analyze, 1-hour time frame⏰.
Do not forget to put Stop loss for your positions (For every position you want to open).
Please follow your strategy, this is just my Idea, and I will be glad to see your ideas in this post.
Please do not forget the ✅' like '✅ button 🙏😊 & Share it with your friends; thanks, and Trade safe.

DXY Analysis H1Here is my analysis for DXY on H1 using Order Block. The price could go bullish, you can put a pending order on the Order block or find an entry on LTF within OB Zone. Trade Safe!

Increase of DXY index after breaking the Resistance Line🚀Hi everyone👋.
💡The DXY Index is ready to break the resistance lines; one of the signs is Bullish Marubozu Candlestick Pattern .
🌊If we look at the DXY from the theory of Elliott waves , we will find that DXY is on the way to completing wave 5 (📚If DXY breaks the resistance lines, we can confirm the end of wave 4 📚).
🔔I expect DXY to break the resistance lines and at least go UP to the 🔴 resistance zone($103.80-$103.38) 🔴 in the coming hours.
U.S.Dollar Currency Index ( DXYUSD ) Analyze, 4-hour time frame⏰.
Do not forget to put Stop loss for your positions (For every position you want to open).
Please follow your strategy, this is just my Idea, and I will be glad to see your ideas in this post.
Please do not forget the ✅' like '✅ button 🙏😊 & Share it with your friends; thanks, and Trade safe.

📈DXY daily chart pattern📉TVC:DXY
CAPITALCOM:DXY
Hello Traders, please check out my previous ideas.
✌💥If you are satisfied with my analytical content, please share my ideas💥✌
✍🐱👤Otherwise, make sure you leave comments and let me know what you think.🐱👤✍
🤑🍾Thank you for your support. I hope you will gain profit by following my analyses.🍾🤑
CrazyS✌

DXY closing in on key price point. My overall view on DXY is bullish, I think the month of August will show continued growth.
We are nearing the 103 price point which we could see a pullback from. If we break and close above the 103 price point and the wedge we could see a strong dollar for the future.
Keep an eye on the price in the coming weeks.

DXY nest possible moveLooking for up 103 and testing 104. looking long in indices so that also looking short in gold below 1900

DXY LONG TERM TRADE SELLING
Hello Traders
In This Chart DXY HOURLY Forex Forecast By FOREX PLANET
today DXY analysis 👆
🟢This Chart includes_ (DXY market update)
🟢What is The Next Opportunity on DXY Market
🟢how to Enter to the Valid Entry With Assurance Profit
This CHART is For Trader's that Want to Improve Their Technical Analysis Skills and Their Trading By Understanding How To Analyze The Market Using Multiple Timeframes and Understanding The Bigger Picture on the Charts

DXY Analysis - Weekly Timeframe (ICT)On the weekly timeframe it is more convincing that the last spike down was a sellside liquidity grab in order to start reaching towards the buyside liquidity, starting with the descending trendline.
I will be anticipating further movement higher over the weeks/months to reach for the weekly Bearish Breaker Block. I also expect a measure of using a previous FVG/iFVG as support before heading higher. If price pushes higher into a weekly Orderblock residing above, then I would consider that the last line of defense before the DXY potentially making new highs.
I am excited about the possible setups based on DXY in the near future.

GOLD / XAUUSD LONGHi
We are seeing GOLD/XAUUSD going higher.
This is taking in mind that we see DXY Dollar Index moving down in next week.
Follow to keep updated with our trade ideas.

DXY looks Bearish DXY looks bearish for me
TVC:DXY looking weak with rejection off the 50D SMA
Short the dollar, long everything else.
If we get this pullback its for usdxxx longs/xxxusd shorts
Favorite for shorts = GBPUSD
Favorite for longs = USDCAD

DXY 30Min Support and Resistance ZoneIn the realm of trading, every move matters, and the DXY 30-minute chart holds vital clues. Join us as we delve into the technical intricacies, uncovering the critical support and resistance levels that can shape trading decisions.
Support Levels:
101.7016: The primary foundation. A bounce from here could trigger a potential upward move.
101.5525: A step deeper into support. Watch closely for possible shifts around this level.
101.3313: The lowest support. If breached, it might hint at a more significant trend change.
Resistance Levels:
102.4500: The immediate challenge. A breakthrough here could pave the way for further upward momentum.
As always, keep in mind that markets are dynamic and can change rapidly. These levels are guides, not guarantees. Consider broader market factors, and use these technical levels wisely in your trading strategy. Stay vigilant and happy trading!

DXY Analysis H1Here is my analysis for DXY on H1 using Order Block. The price could go bullish, you can put a pending order on the Order block or find an entry on LTF within OB Zone. Trade Safe!

75: DXY's Reclaimed 102.6: Eyes on Long Positions around 102.4Greetings, traders! 📊📈
A new chapter is unfolding in the world of the DXY (US Dollar Index) as it resurfaces above the 102.6 mark. This resurgence has ignited discussions about potential long opportunities near the 102.4 region, presenting an intriguing prospect for those closely monitoring this market movement.
🔀 Shift in Dynamics:
With the 102.6 level now back in play, the landscape is shifting. This pivotal juncture, now functioning as a support-turned-resistance, signals a renewed bullish sentiment. Coupled with the proximity to the 102.4 zone, previously holding as a support, the stage seems set for potential long positions to come into play.
📉 Analyzing the Context:
For those considering a long play, it's essential to stay attentive to the prospect of a pullback toward the 102.4 area. This could be an opportune entry point, especially if accompanied by encouraging bullish confirmations such as robust candlestick patterns or indicators signaling an upward trajectory.
🎯 Strategizing for Profits and Risks:
As you craft your long strategy, mapping out profit targets around significant resistance levels or recent highs is prudent. Pair these targets with a well-placed stop-loss, likely positioned below the 102.2 level, to mitigate risk and cushion against potential adverse market movements.
📆 Event Sensitivity:
Maintain vigilance over forthcoming economic events or announcements that might sway the DXY's course. These factors, combined with the broader market sentiment, can play a pivotal role in shaping the outcome of your long-trade scenario.
🚧 Ready for Contingencies:
In the unpredictable realm of trading, having a contingency plan is a must. Should the DXY falter and dip beneath the 102.4 support, being prepared to reassess and recalibrate your trading approach is crucial.
📖 Unending Learning Journey:
Remember, the path of a trader is one of perpetual learning and adaptation. Take advantage of this opportunity to refine your technical analysis skills and deepen your grasp of market intricacies.
Disclaimer: This post is intended for educational purposes only and should not be construed as financial advice. Always conduct thorough research and seek guidance from financial professionals before executing any trading decisions.
Wishing you all success on your trading endeavors! 🚀📈📊

⚠️DXY will go DOWN(Short term)⚠️As I expected in the previous post, DXY reached the resistance lines.✅👇
💡If you look closely at the chart, you will notice that DXY is moving in an Ascending Channel .
💡It seems that DXY failed to break the resistance lines.
💡Also, we can see Regular Divergence(RD-) between consecutive peaks.
🔔I expect the DXY will go DOWN at least to the lower line of Ascending Channel.
U.S.Dollar Currency Index ( DXYUSD ) Analyze, 4-hour time frame⏰.
Do not forget to put Stop loss for your positions (For every position you want to open).
Please follow your strategy, this is just my Idea, and I will be glad to see your ideas in this post.
Please do not forget the ✅' like '✅ button 🙏😊 & Share it with your friends; thanks, and Trade safe.

DXY Hits a 3-Week High Following Fitch US DowngradeBrace yourselves because the DXY has just hit a 3-week high, thanks to the recent Fitch US downgrade. Talk about an unexpected twist, right?
Now, let's dive into the details. Fitch Ratings, the renowned credit rating agency, has downgraded the United States' credit rating, causing quite a stir in the market. As a result, the US dollar has emerged as a haven for investors seeking stability amidst uncertainty. Isn't it fascinating how the market reacts to unexpected events?
But that's not all! This turn of events presents a golden opportunity for traders like you to capitalize on the situation. With the DXY soaring, it's time to consider going long on the US dollar. By doing so, you can potentially benefit from its current haven status and ride the wave of this unexpected surge.
So, here's your call to action: seize this opportunity and consider going long on the US dollar. Keep a close eye on the market trends, analyze the charts, and make informed trading decisions. The profit potential is knocking at your door, and it's time to answer!
Remember, surprises like these are what makes trading so thrilling. Stay vigilant, stay informed, and don't hesitate to take calculated risks when the market throws unexpected curveballs your way.
As always, please conduct thorough research and analysis before making trading decisions. Market conditions can change rapidly, so staying updated and adapting your strategies is essential.

What do we expect from the DXY index this week❗️❓🚀The DXY index failed to break the 🟢 support zone($101.30-$100.82) 🟢 reliably, and with the Double Bottom pattern , it resumed its upward trend and formed a 🐻 Bear Trap 🐻.
💡Also, the DXY index issued a Buy signal through the 50-SMA and 50-EMA .
💡The Bullish Marabozu candle was also a sign and confirmation that DXY's fall below the support zone was just a Bear Trap.
🔔I expect the DXY to have a bullish trend this week and ⚔️attack⚔️ the resistance lines.
📚In general, I try to show you all the points of technical analysis on the chart, which also has an educational aspect(I apologize for the busy chart).📚
U.S.Dollar Currency Index ( DXYUSD ) Analyze, 4-hour time frame⏰.
Do not forget to put Stop loss for your positions (For every position you want to open).
Please follow your strategy, this is just my Idea, and I will be glad to see your ideas in this post.
Please do not forget the ✅' like '✅ button 🙏😊 & Share it with your friends; thanks, and Trade safe.

DXY - What Next?TVC:DXY
Based on what I see on my dxy chart, I feel DXY will be bullish today and tomorrow and if possible will likely be bullish on Wednesday as well.
What do you see?

DXY: BTC 2018Hi guys, i just want to share this simple and useless idea.
Many claim Dxy (Dollar) can rise again.
Obviously i don't know, but looking at the pattern that Btc created in 2018, seems to fit with Dxy know.
Is it this a possibility to range for some months and then go down? Yes.
Can i be wrong? Of course, but i doubt Dollar can rise magically towards new highs in this scenario.
Let's see.
