$dxy #dxy #elliottwave long 4jul23This count is based on my assumptions so anything can happen not a trading or financial advice just for educational purposes only kindly do your own ta thanks trade with care good luck.
Dxylong

LIQUIDITY VOID, DXY LONG.In the 4hr timeframe, XAUUSD is bullish. Price is pushing to fill that liquidity void at 104.014 - 104.138.

DXY will go UP by Symmetrical Triangle🚀DXY index managed to form a Symmetrical Triangle Pattern near the 🟢 support zone($102.85-$102.66) 🟢 and support line.
DXY broke the upper line of the symmetrical triangle.
I expect the breaking of the upper line of the symmetrical triangle to be a sign for the DXY index to go up in the coming days.
U.S.Dollar Currency Index ( DXYUSD ) Analyze, 1-hour time frame⏰.
Do not forget to put Stop loss for your positions (For every position you want to open).
Please follow your strategy, this is just my Idea, and I will be glad to see your ideas in this post.
Please do not forget the ✅' like '✅ button 🙏😊 & Share it with your friends; thanks, and Trade safe.


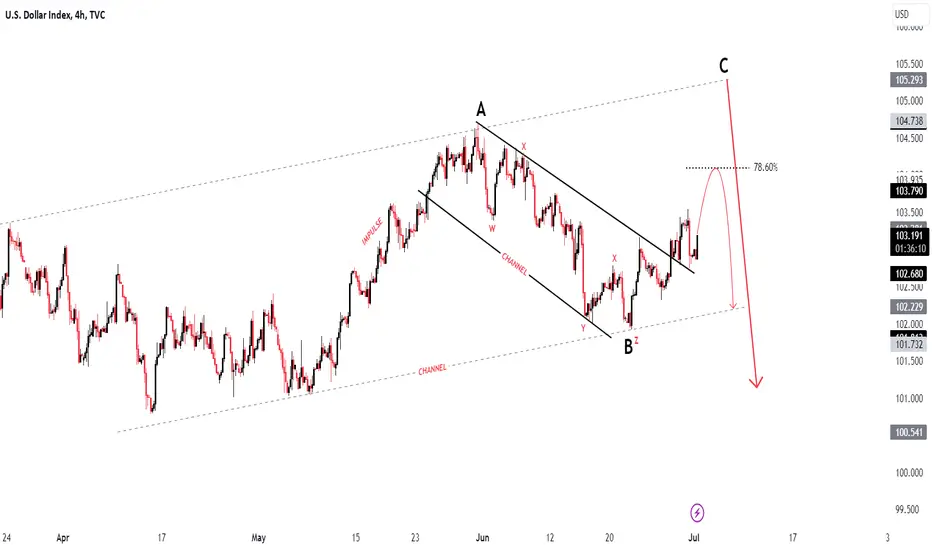
$dxy #dxy #elliottwave long 1jul23This count is based on my assumptions so anything can happen not a trading or financial advice just for educational purposes only kindly do your own ta thanks trade with care good luck.

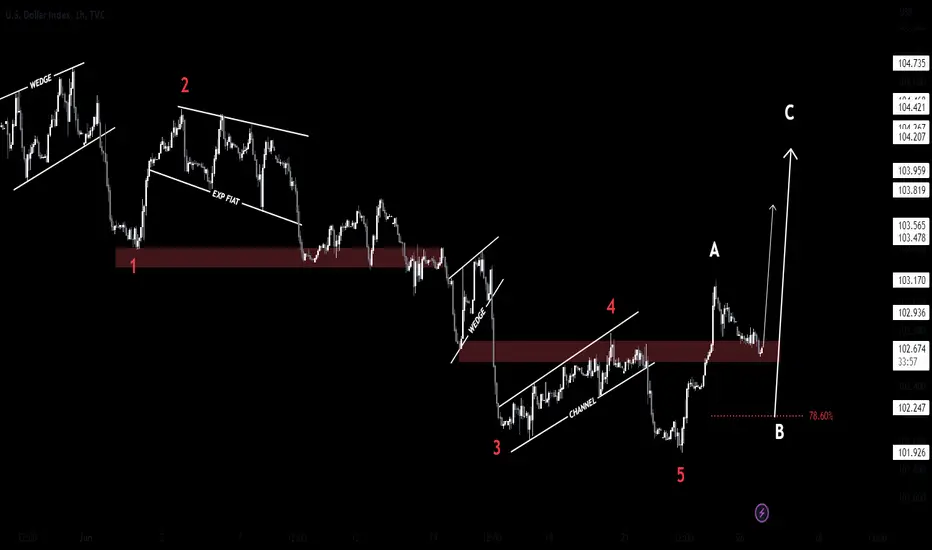
DXY Index Next Possible MovePair : DXY ( U.S Dollar ) Index
Description :
Bullish Channel as an Corrective Pattern in Long Time Frame
Completed " ABC " Corrective Wave
Divergence - RSI
Break of Structure
Impulse Correction
Fibonacci Level - 78.60%
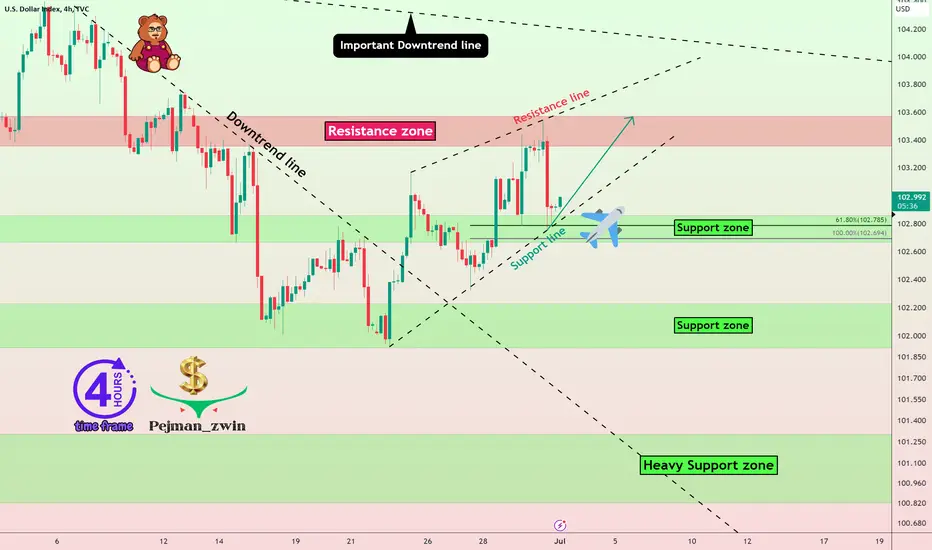
DXY ready to FLY again✈️DXY Index is moving near the 🟢 support zone($102.85-$102.66) 🟢 and support line.
In general, after the DXY succeeds in breaking the downtrend line , we should expect growth of the DXY .
I expect DXY to go ✈️ UP ✈️ again to at least the 🔴 resistance zone($103.57-$103.35) 🔴.
U.S.Dollar Currency Index ( DXYUSD ) Analyze, 4-hour time frame⏰.
Do not forget to put Stop loss for your positions (For every position you want to open).
Please follow your strategy, this is just my Idea, and I will be glad to see your ideas in this post.
Please do not forget the ✅' like '✅ button 🙏😊 & Share it with your friends; thanks, and Trade safe.
DXY - Bullish Harmonic and Bottom FormationWe're observing what appears to be a bullish harmonic pattern, alongside a bottom formation within the current charting landscape. These elements are potent technical indicators that hint at a possible uptick on the horizon.
When one combines this pattern with the formation of a bottom, it further bolsters the likelihood of a forthcoming bullish surge.
The targets of an upward nature as depicted on the chart, represent potential levels should a bullish trend indeed take a firm grip.

Arguments of a week's size. Hi!
We have some important signs for the dollar index that don't bode well for the crypto market!
This is the 1 WEEK CHART.
This is a high degree of reliability.
In fact, what we saw on last week's hourly chart has already developed into a persistent reversal.
1: Ishimoku. The green Kumo cloud has halted Bitcoin's fall. In fact its lower boundary Senkou B has not been tested. Kijun-sen also does not show resistance to the candlestick, and usually turns out to be the next support later...
2. EMA100 area is a support in the weekly chart. This is a very good signal for the continuation of USD strengthening trend!
3. The volatility has stopped falling and the first red shortening bar appeared. I'm sure in a few weeks there will also be the first black cross signifying a squeeze before an upside shot.
4. Stochastic has reversed and is flying up.
5. This is a Heikin Ashi chart and it is more sensitive to a trend reversal than normal Japanese candlesticks. You can see how we started this week.
Conclusion.
Remember, Bitcoin is still private money (even if influential funds buy it for investment purposes). Bitcoin has no monetary authority, it plays on the open market against fiat currencies (primarily the dollar), which are managed by powerful financial institutions.
This new weekly green candle is the result of a +0.25% increase in the Fed's key rate. Dollar borrowing has become expensive. Why should there be free liquidity available in the market to inject into high risk assets? Or do you believe that private hands around the world will outbid the Fed?
No, I do not believe that this weak sideways move of Bitcoin in November-December was a consolidation.
Now the curses will come )))
P.S. If I'm wrong, that's my problem.
You can watch this chart and decide your’s opinion.
I don't want to change your mind at all.
I am only pointing out my thoughts.
But I would like people to think better.

DXY - Buy #DXY in Daily Time Frame Setup
DXY is Moving Up for Resistance
Clearly DXY is make Some Bullish Moves on this Week

EURUSD Bear ConfirmedHello Traders,
On the Daily timeframe, EURUSD has confirmed a shift in market structure. ( BMS )
The entry for a long-term sell should be at the Fair Value Gap.
Good luck. Trade responsibility.

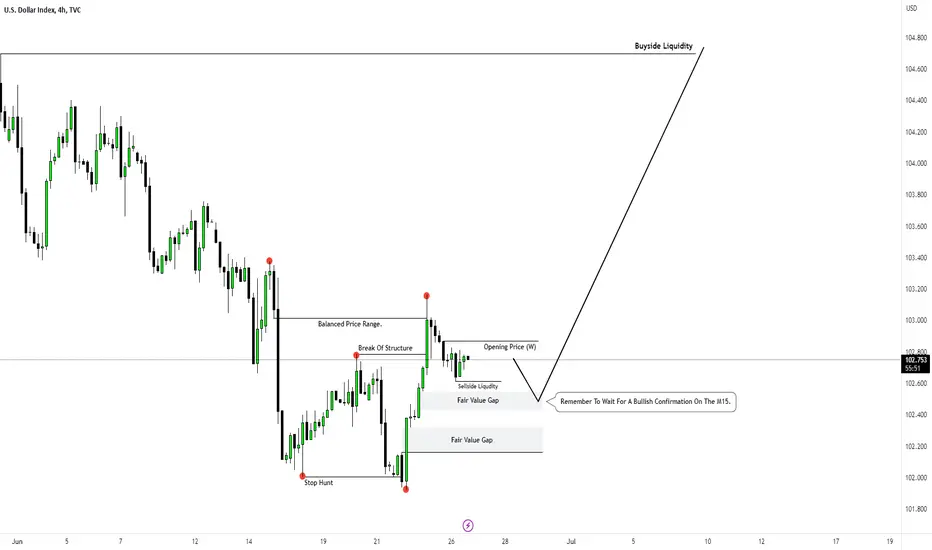
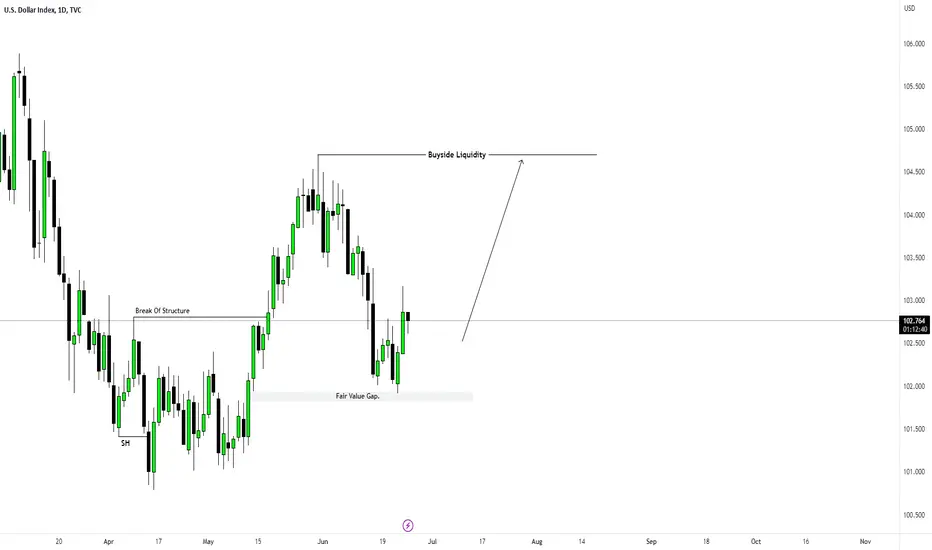
DXYThis Is The Dollar Index On The 4 Hour Time Frame And This Is What I Anticipate To See, Ideally A Sweep Of The Sellside Liquidity Engineered Today Then A Bullish Confirmation On The M15 To Confirm Our Bullish Bias Then We Can See The Dollar Index Rallying To Take The Buyside Liquidity.
DXY DailyThis Is A Simple Anticipation I Have On The Dollar Index, It May Or Not Pan Out But We'll Wait And See, I'll Update You Guys As It Progresses.
DXY Index New Week Possible MovePair : DXY Index
Description :
Completed " 12345 " Impulsive Wave and " A " Corrective Wave
Demand Zone
Break of Structure
Bearish Channel as an Correction in STF
RSI - Divergence
DXY DROP COMING? Must READ!DXY is looking great for a powerful drop after we hit our final correction to the 800ema on H4.
D1 structure is looking great, BASELINE and EMA CLOUD looking to support SHORT LONGER TERM.
====== ENTRTY ======
1) Take a SHORT on xxxUSD when DXY drops 10point when the market opens
2) Wait it out! The big move on DXY will happen when we are at 800 on H4, get a LONG on xxxUSD when that happens.
====== INVALIDATION =======
DXY fixing above PWH invalidates the SHORT positions. Watch for BREAKS at that level.
======= TARGETS =======
For xxxUSD SHORTS, exit when DXY hots 800ema.
For xxxUSD LONGS, exit all LONGS when DXY hits PmthL (Previous Month Low)
P.S I trade with literally zero complicated analysis and still maintain 90% HIT RATE on my LIVE TRADES and ideas.

dxyDXY Is Changing The Direction Again
During these days DXY was testing a very strong support zone and it was not clear about the next movement.

DXYDXY has given breakout from bearish parallel channel with very strong bullish impulse. A little bit of correction is due but the ultimate direction is upward.

DXY Index Next Possible MovePair : DXY Index
Description :
Bullish Channel as an Correction in Short Time Frame with the Breakout of the Lower Trend Line and Retracement
Break of Structure
S / R Level
RSI - Divergence

DXY: The power of the economy!Mr. Biden revived the industry to compete with China, but this intervention could put the US economy and its allies at risk, according to the WSJ.
Jake Sullivan, President Joe Biden's national security adviser, is often preoccupied with foreign threats, such as the Ukraine conflict. But in April, in a speech at the Brookings Institution, he addressed the threat from within, of the long-held view of Washington elites that "the market has always allocated capital efficiently. and perfomance".
Some in policy circles call this view neoliberalism, or free trade, which has been bipartisan for decades. But Sullivan argues, this doctrine has emptied America's industrial base, weakened the middle class and made the country more vulnerable to climate change, Covid-19 and the weaponization of its supply chains. hostile countries.
To solve it, he said that the US needs a new approach, a "modern industrial strategy". Accordingly, the government supports stronger investment in industry and commerce to strengthen the middle class and national security.
Since the 2020 election, Mr. Biden has tried to come up with a unified theory for his economic policies. And Sullivan's recent remarks on the White House's domestic and foreign goals toward China have more clearly depicted what could be called "Bidenomics," with three pillars. With that comes some blind spots and contradictions in this economic policy, according to the WSJ.

EURUSD sell continuationHello Traders,
On the Daily timeframe, EURUSD has shown signs of exhausted buyers and has been creating lower lows since Friday.
I believe the price should continue going lower to fill the price imbalance below.
Good luck. Trade responsibility.

EURUSDEURUSD recently was in strong bullish momentum. But currently it seems like a bullish momentum is fading. A deep correction is also due after such strong impulsive move.

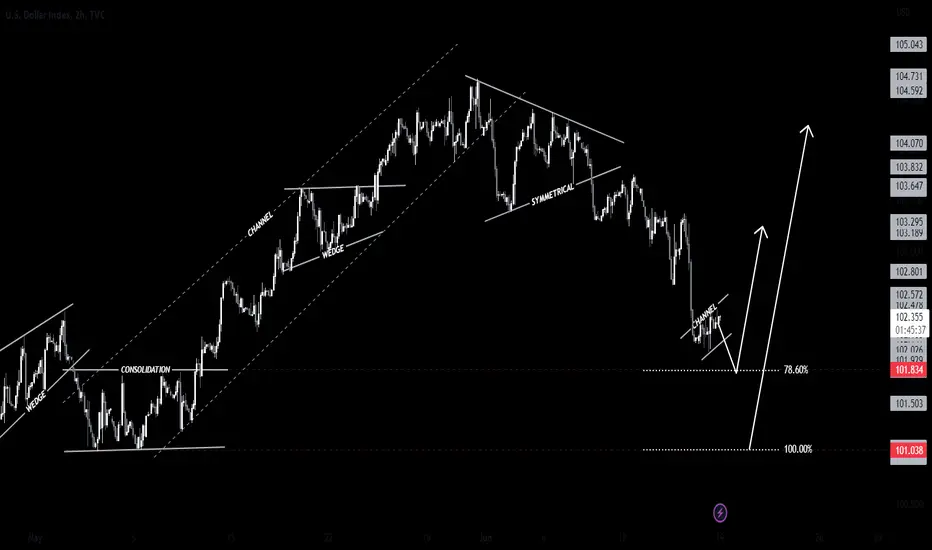
$dxy #dxy #elliottwave long 18jun2023This count is based on my assumptions so anything can happen not a trading or financial advice just for educational purposes only kindly do your own ta thanks trade with care good luck.

DXY Index New Week Possible MovePair : DXY Index
Description :
Bullish Channel as an Correction in Short Time Frame
Consolidation
Break of Structure
Impulse Correction
Fibonacci
S / R Level