$dxy #dxy #elliottwave long 16jun2023 #wavecThis count is based on my assumptions so anything can happen not a trading or financial advice just for educational purposes only kindly do your own ta thanks trade with care good luck.
Dxylong

Dollar index ReversalDollar index looks like in reverse mood
As we can see in weekly time frame Dxy is in Bullish trend so I'm expecting Dollar will fly
What is your idea ...
Are you agree with my idea please let me know in comments

DXY Bullish Retracement (Overall Bearish Bias)DXY has been in a bearish trend. After the previous push to the upside price formed a Double Top, which is a candlestick reversal pattern.
Price then broke the neckline of the double top, retested the area meeting resistance and began another sell off to the downside. Ultimately, forming a lower low.
I am now anticipating price to form a double bottom (bullish reversal pattern) on the 1hr-4hr timeframe and begin a bullish retracement that will form then next Lower High.
I believe price may retrace to the 102.9 - 103.16 area before selling off again.
What do you think, please comment below?

DXY gain from support area 🚀💣🚀Hello 🐋
Based on the chart, the price is close to the support area and channel support ✔️
if
the price doesn't break the support zone to the downside, we can see more gain 💣🚀
otherwise
we can see more correction ❌🧨
👌 Notice: pay attention to the price on shortcut chart (located above the main chart with black colour) 📖💡
Please, feel free to share your point of view, write it in the comments below, thanks 🐋

My Take On DXY 15th June '23When figuring price out one of the things we consider is what price might want to fill and after it has filled that, what might stop price and reverse it. So for DXY we see that it's currently filling a void that was made during the bullish move. It's also at a gap that might be filled. After that I think price might drop a bit lower to take out the old low where liquidity lies and either reverse at the FVG or the bullish order block below it. However, this depends on the bearish impulse on today's candle. The gap above would be a very good take profit point and we know that this move will play out in the opposite direction on XXUSD in case it goes according to my idea

Dollar ready to longDXY create hidden bullish divergence on the daily time frame; a long move is anticipated!
Target Profit 106.1xx

$dxy #dxy #elliottwave long!!!!!This count is based on my assumptions so anything can happen not a trading or financial advice just for educational purposes only kindly do your own ta thanks trade with care good luck.

Greenback Runs US Base Currencies!Here's a Billion DXY nugget for all who have an ear to listen: receive: and learn.
The DXY aka Dollar aka GreenBack aka That BULL aka Dolla Dolla will make her Holla : runs US Base Currencies and is Zeus in the markets.
KNOWING this Objective Fact : you can mark up the DXY and trade it against most US Base Pairs especially FX:EURUSD and whichever way the DXY is biased that day then EURUSD will be biased the exact other way within it's own specific buy/sell model and specific buy/sell schematic.
The DXY is Bullish. :)
FX:EURUSD has fallen.
Never over leverage.
Trust your trade set up. Typically most trade take time to manifest. If it doesn't hit your stop let it be.
Continue to have a Great week of trading!!!

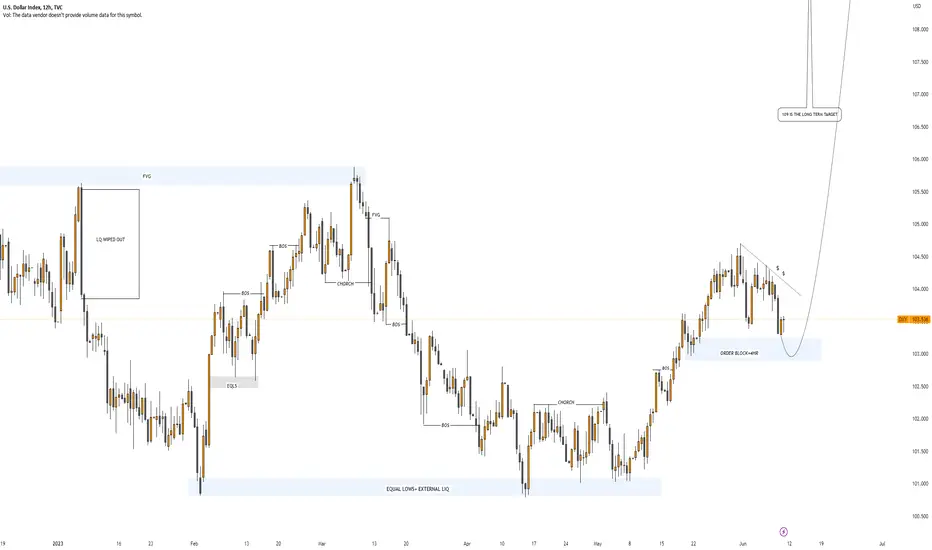
DXY: 109 IS THE NEW TARGETDear Traders, we have a good opportunity of selling XXXUSD pairs and buying USDXXX pairs, as the price currently testing previous LL we are expecting price to bounce from this zone. Let's not miss out on this opportunity.
Good Luck and Trade Safe.
JUST FOLLOW THE SCRIPT - EURUSDWE ARE BEARISH. THE DXY IS BULLISH.
Therefore on a bearish day we expect price to IMPULSE to a AREA of Liquidity right above our Morning Zone before the dump in confluence with the DXY being BULLISH.
WE EXPECT A DUMP TO THE 3RD OR 4TH
SD.
NARRATIVE: MONDAY JUNE 12, 2023 2:58AM EST
Never Over Leverage. Large Trading Accounts are grew over time through compounding.
TRUST YOUR SET UP.
HAVE A GREAT WEEK OF METICULOUSLY CALCULATING AND PRECISE TRADING!!!!!!!!!!
I AM THE ALGORITHM NOW:)

DXY - Dollar Index AnalysisDXY - US Dollar Index Trade Analysis
According to chart pattern DXY is forming Cup and Handle Pattern and this point my be the trend reversal on shorter time frame.
Entry Point for Long: 103.0963
Target: 103.3263
manage your risk according to your account size.
for more analysis
subscribe me

The United States Dollar is expected to trade at 105.52According to Trading Economics global macro models and analysts expectations, the United States Dollar is expected to trade at 105.52 by the end of this quarter. Looking forward, we estimate it to trade at 110.18 in 12 months time.

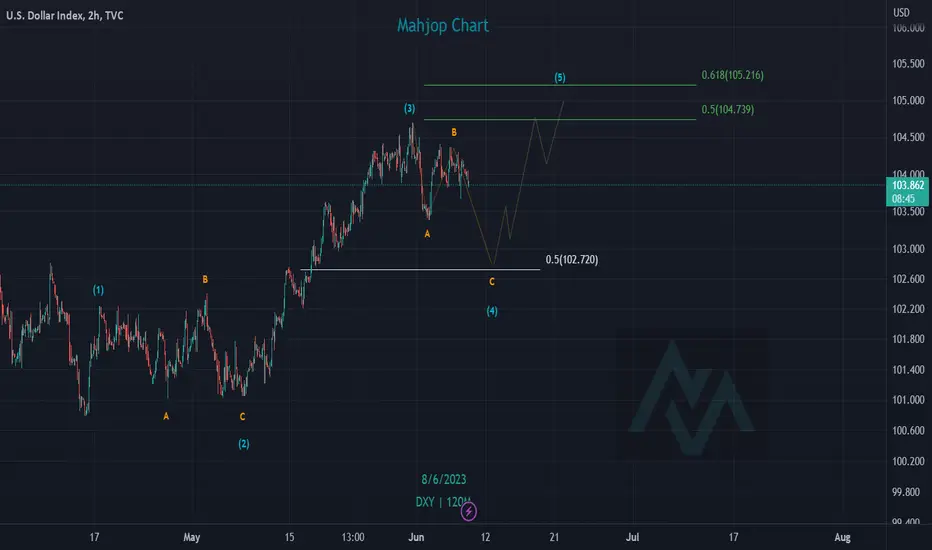
$dxy #dxy #elliottwave long trade setup 9th June 2023This count is based on my assumptions so anything can happen not a trading or financial advice just for educational purposes only kindly do your own ta thanks trade with care good luck.

DXY Trade IdeaMinimum Risk Maximum reward
Not a financial advice , Must do your own research before taking any action

DXY REBOUND....waiting for the market to drop down to our zone where we will be looking for long position as the #dxy completes its fourth wave

libyan dinar forcast libyan dinar is the next victim after EGP and turkish currceny :)
target around 5.2$

dxy forcast for next days !! DXY Continue to fail temporary ,,
the 4 waves could end near 102.7 and than we could see new higher close from 105 pip


DXY aka USdollar aka dollar indexdxy is still bullish at the moment i want to see price action once it pushes up towards 104.4-104.5 area if we get some bearishness there we can see a nice push down if not it will head to that 105 area but this area ia attractive for the fact it created a flip zone here retest and made a move down leaving the orderblock we are testing now
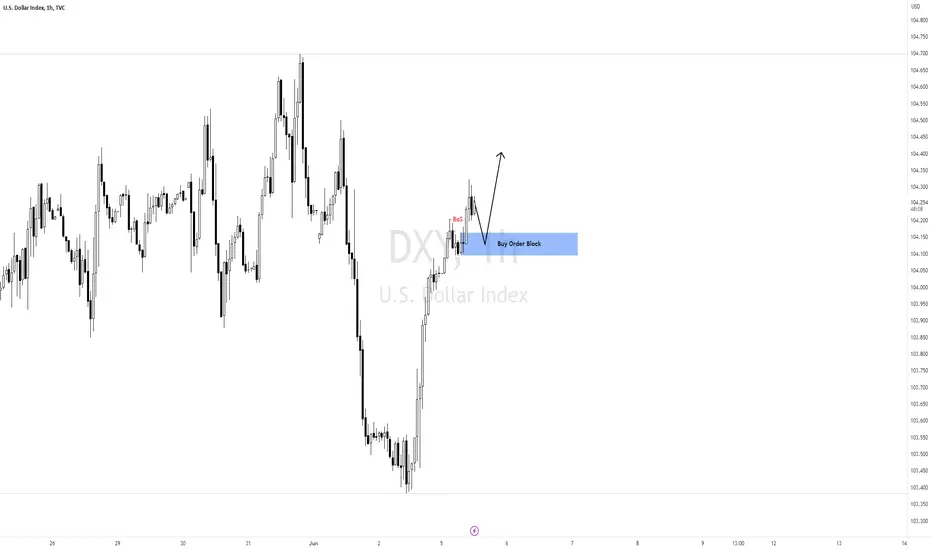
DXY Chart H1Here is my view for DXY on H1. The price could go bullish, you can put a pending order on the Order block or find an entry on LTF within OB Zone. Trade Safe!
DXY brief gain to the resistance area 📖🚀Hello 🐋
Based on the chart, the price is close to the support area and channel support ✔️
if
the price doesn't break the support zone to the downside, we can see more gain 💣🚀
otherwise
we can see more correction ❌🧨
👌 Notice: pay attention to the price on shortcut chart (located above the main chart with black colour) 📖💡
Please, feel free to share your point of view, write it in the comments below, thanks 🐋

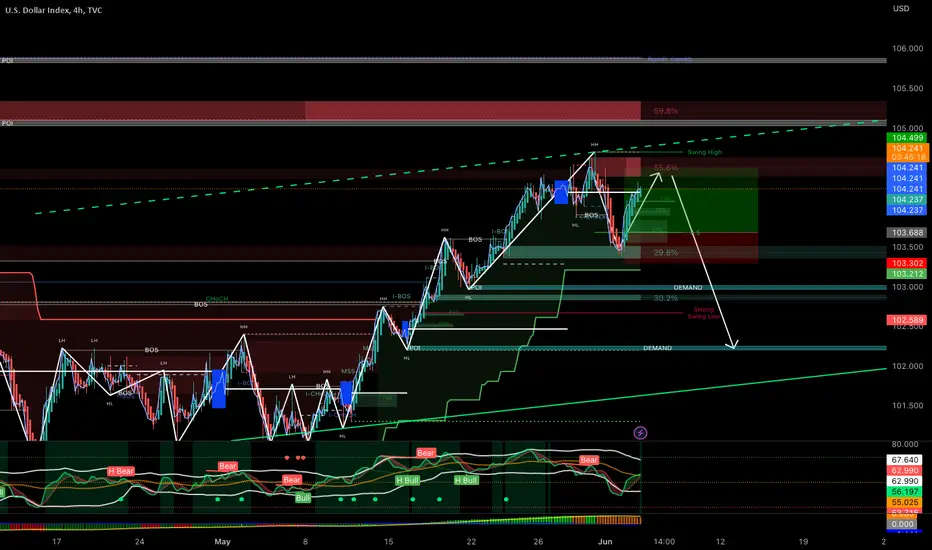
DXY Index Analyze (Road Map, 05/31/2023)!!!🗺️Hi, everyone👋.
To better understand the DXY Index roadmap🗺️, it is better to first look at the DXY weekly time frame:👇(Running well, as I expected ✅)
As you can see, the upward trend of DXY will continue.
Now, I tried to show you the DXY roadmap in the 4-hour time frame using the Elliott wave theory .
It seems that DXY is nearing the end of wave 3, and this wave can end at 🟡 Price Reversal Zone(PRZ) 🟡.
I expect the DXY to return to the first 🟢 support zone($ 103.60-$ 103.36) 🟢 after the end of wave 3 is confirmed and rise again to the top of the 🔴 heavy resistance zone($ 105.80-$ 104.53) 🔴.
U.S.Dollar Currency Index ( DXYUSD ) Analyze, 4-hour time frame⏰.
Do not forget to put Stop loss for your positions (For every position you want to open).
Please follow your strategy, this is just my Idea, and I will be glad to see your ideas in this post.
Please do not forget the ✅' like '✅ button 🙏😊 & Share it with your friends; thanks, and Trade safe.
