DXY one last leg down then continuation for new highsHi there,
DXY is setting up for one last drop to finish 4 wave before it resumes the uptrend, We have a rising wedge on 4h, after breakdown dxy will melt
Good luck with your trades
Dxylong

Dxy 1h outlookAm looking for this chart to give us a buy signal from the formed order block to complete a wxy correction. The correction will support a move to break the previous low for an impulsive buy.

Dxy high problability doing HLi think dxy doing higher low. and next step is th complete correction and one big strong long impulse coming.

DXY RallyTVC:DXY
Same idea as EU just reversed, would like to see how indies open up this week to conform

DXY Trade Idea This trade idea totally based on pure technical analysis with 1% risk and maximum reward ratio.
If you want to succeed in trading you must need to ignore indicators , yopu must need to focus on naked chart

DXY road to 92, SHORT THE USDThe PetroYUAN is competing with the petroDOLLAR now and is causing concerns amongst the US economy. As BRICS gather forces and continues growing as oil rich countries are also joining forces with BRICS to fight against the petroDOLLAR.
Other economic factors why the DYX is looking weak are:
-Inflation: High inflation can erode the value of a currency, as it reduces the purchasing power of consumers and investors. If the US experiences sustained high inflation, it could weaken the US dollar even if interest rates are high.
-Economic growth: If the US economy is not growing as quickly as other economies, it could lead to a relative decline in the value of the US dollar. This could be exacerbated if other economies are experiencing strong growth and higher interest rates.
-Geopolitical risks: Political instability, trade tensions, and military conflicts can all increase risk and uncertainty, which can lead investors to sell US dollars and seek safer assets. If the US is perceived as a less stable or secure country, it could weaken the US dollar.
-Debt levels: High levels of debt can make a country more vulnerable to economic shocks and reduce its ability to stimulate the economy during downturns. If the US experiences a sharp increase in debt levels, it could weaken the US dollar.
-Market sentiment: Investor sentiment can be influenced by a wide range of factors, including news events, social media, and market psychology. If investors become pessimistic about the US economy or the prospects for the US dollar, it could lead to a decline in demand for US dollars and a weaker currency.

FOMC - MARCH 22, 2023 -US30 DOW JONES INDUSTRIAL AVERAGE Hello Traders,
As we approach FOMC and rate decision today, 2pm March 22, 2023
there's a possibility of continued rate hike to curb inflation and that could
send Stock Markets down.
Key Points:
VIX - Volatility Index is bullish for the week
Commodities - Bearish for the week
A rate increase is favourable for USD from an Investor's perspective. Overall economic outlook is bearish considering global world issues i.e: Russia/Ukraine, recession, inflation, etc.
Chart analysis shows clear picture based on trend lines, BOC, CHOC, and imbalance areas from prior week.
Anyways, always trade what you are comfortable with losing.
Until next time!
The Trading Regime.

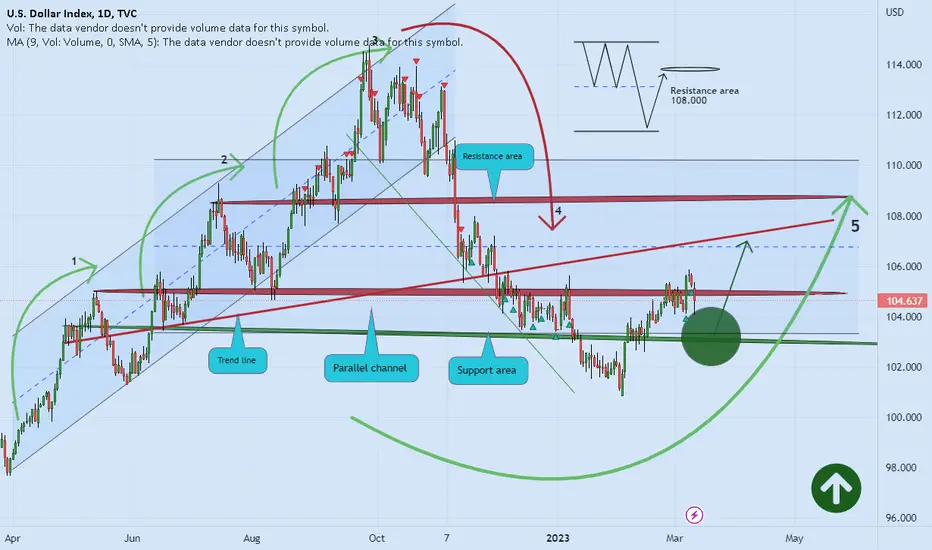
DXY brief gain to the resistance area 📖🚀Hello 🐋
Based on the chart, the price is close to the support area and channel support and even made new ascending channel that we mentioned in our next analysis too ✔️
if
the price doesn't break the support zone to the downside, we can see more gain 💣🚀
otherwise
we can see more correction ❌🧨
👌 Notice: pay attention to the price on shortcut chart (located above the main chart with black colour) 📖💡
Please, feel free to share your point of view, write it in the comments below, thanks 🐋


Intraday BUY DXY (16 MAR 2023)DXY intraday trading alert
3 simple steps to find a quality setup !
Risk Reward Ratio 1: 2
Anyone same idea with me?
BUY DXY
Good luck traders..

Intraday BUY DXY (16 MAR 2023)DXY intraday trading alert
3 simple steps to find a quality setup !
Risk Reward Ratio 1: 2
Anyone same idea with me?
BUY DXY
Good luck traders..

DXY brief gain to the resistance area 📖🚀Hello 🐋
Based on the chart, the price is close to the support area and channel support and even made new ascending channel that we mentioned in our next analysis too ✔️
if
the price doesn't break the support zone to the downside, we can see more gain 💣🚀
👌 Notice: pay attention to the price on shortcut chart (located above the main chart with black colour) 📖💡
Please, feel free to share your point of view, write it in the comments below, thanks 🐋

DXY update#DXY still the same idea... Eyes on 4h FVG's...
Looks like US dollar index is accumulating to eliminate the upper FVG first...
Parallel with that, #Forex #CFD #Crypto will do the opposite...
#NFA #DYOR

DOLLAR INDEXLong term downtrend channel has been broken and it is going for retracement between 50.0% and 61.8% of Fibonacci.
Here is next possible move. CAPITALCOM:DXY

$dxy #dxy #elliottwave long trade setup.This count is based on my assumptions so anything can happen not a trading or financial advice just for educational purposes only kindly do your own ta thanks trade with care good luck.

DXY brief gain to the resistance area 📖🚀Hello 🐋
Based on the chart, the price is close to the support area and channel support and even made new ascending channel that we mentioned in our next analysis too ✔️
if
the price doesn't break the support zone to the downside, we can see more gain 💣🚀
otherwise
we can see more correction ❌🧨
👌 Notice: pay attention to the price on shortcut chart (located above the main chart with black colour) 📖💡
Please, feel free to share your point of view, write it in the comments below, thanks 🐋
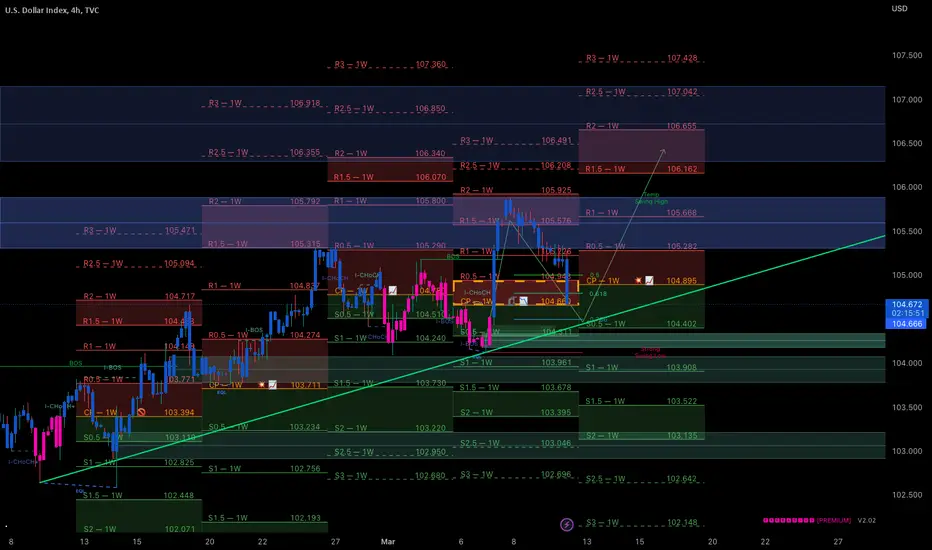
💵U.S.Dollar Currency💵 Index Analyze (DXY,03/10/2023)!!!After the completion of the leading diagonal, DXY Index started to build an Expanding Flat(3-3-5) corrective structure.
I expect the DXY Index to start growing in the coming days and reach the next 🔴resistance zone($109.32-$107.74)🔴.
U.S.Dollar Currency Index ( DXY ) Analyze, 4h-Time frame (Log Scale)⏰.
Do not forget to put Stop loss for your positions (For every position you want to open).
Please follow your strategy, this is just my idea, and I will gladly see your ideas in this post.
Please do not forget the ✅' like '✅ button 🙏😊 & Share it with your friends; thanks, and Trade safe.

dxy nfp setupseems like this news is setting dxy for a nice pull back after that last explosive move if 104.200 holds we can see another leg up for a move up since dxy made a higher high im still bullish biased over all this pull back most def was needed
now if the next push up doesnt break that last dxy high we could see seelers start to step in
DOLLAR dxyLETS start to buy dollar by today.
reasons:
1.Fed testifies that unemployment rate gonna increase.
2.Fed is gonna continuing increase the interest rate.
3.Inflation still high and way far from Fed's target 2.
4.NFT came last month high rate 517K and its highest data until last year June.
5.Today we have NFP data and might be bullish dollar again and even if not I am still bullish pn dollar and
i will look some other support levels to buy.

DXY top-down analysisHello traders, this is a complete multiple timeframe analysis of this pair. We see could find significant trading opportunities as per analysis upon price action confirmation we may take this trade. Smash the like button if you find value in this analysis and drop a comment if you have any questions or let me know which pair to cover in my next analysis.

USDJPY HITS TP 509 PIPSUSDJPY has come to hit my TP, though I'm still expecting some upward movement. I shared an analysis on 22/02/23 concerning DXY gaining strength, which will affect dollar base pairs. I reviewed two pairs which I opened: USDJPY and EURUSD . my EURUSD trade is still open, though I have realized first TP and also added a little position which currently on profit. I will drop how I got into the trade when TP is achieved.

DXY Looking Bullish Before Month EndThe US dollar remains bullish in my eyes on the daily timeframe. Resistances are being overcome while support is holding. The strategy involves a continued move higher after staying in a tight 5 day trading range from Feb 16-22.
I am anticipating an energetic move higher to 105.63 price level as an upside objective before the end of the month.
To invalidate the trade, price would need to trade below 102.6 lows before heading to 105.63.
-Bias: Bullish
-Why: FVG at 105.7 is a draw on liquidity and I expect price to move higher especially if interest rate hikes will continue.
-Targets: 105.6
Consequence of a rising dollar is that equities and gold will feel a pressure to the downside.

DOLLAR INDEX: Bullish context in short-medium term?Hi everyone!
There would be a lot to write about the fundamentals of the US dollar, but time is very precious so I'll just try to translate fundamental analysis into technical analysis with this hourly chart.
I hope it can be useful to someone anyway...
...trade with care! 👍
If you think that my analysis is useful, please...
"Like, Share and Comment" ...thank you! 💖
Cheers!
PS: I would also like to know your opinion about dollar index, what do you think? Post your opinion in the comments....
A.B.
