USD Index Targets 104.820 After US Federal Reserve Meeting?We have learned that almost all US Federal Reserve officials backed a 25-basis-points rate hike at the last FOMC meeting held on January 31 to February 1.
Only a few officials favored a larger 50-basis-points hike at the meeting or said they "could have supported" it. Even so, many more dovish sentences were spoken in the latest meeting than compared to the December meeting. Although, officials did not go as far to consider a pause in rate hikes. The only time this topic was broached was in reference to foreign central banks and their potential strategies.
Of course, the meetings also showed the obligatory note that, although the rate hikes have started to ease inflationary pressure, officials agreed that there was much more work to do to get inflation under control and were definitely aware of the risk of not doing enough, so the drip of dovish language will likely continue for some time before a dovish outlook overtakes a hawkish. Especially, because the meeting took place before the release of the hotter-than-expected jobs and retail sales data from January. This might go some way in supporting the USD in the short to medium term.
Looking at the DXY after the release of the minutes, it looks to have helped the USD index push into the mid 104s, where it is encountering some resistance. The index only has to break into 104.700 to eclipse its recent one week high and return to its month high. A target above this range could include 104.820, which aligns with the 200-EMA and some peaks reached in January.
Dxylong

EXPECT STRENGTH IN DOLLAR PAIRSI spotted a bullish flag chart pattern and a fake out on Dollar index. once dollar index is bullish expect other dollar pairs to gain strength, like: EURUSD, AUDUSD, GBPUSD, XAUUSD, USDJPY, NZDUSD etc.. currently I'm short in EURUSD and USDJPY I'm in long position. Please becareful, reduce your position percentage when trading correlated pairs.

DXY Potential for Bullish Rise to recent swing high Looking at the H4 chart, my overall bias for DXY is bullish, as the current price is above the Ichimoku Cloud. Looking for a pullback buy entry at 103.775 where the overlap support and 61.8% Fibonacci line are, and the stop loss is at 103.189 where
50% Fibonacci line is.
Any opinions, news, research, analyses, prices, other information, or links to third-party sites contained on this website are provided on an "as-is" basis, as general market commentary, and do not constitute investment advice. The market commentary has not been prepared in accordance with legal requirements designed to promote the independence of investment research, and it is therefore not subject to any prohibition on dealing ahead of dissemination. Although this commentary is not produced by an independent source, FXCM takes all sufficient steps to eliminate or prevent any conflicts of interest arising out of the production and dissemination of this communication. The employees of FXCM commit to acting in the clients' best interests and represent their views without misleading, deceiving, or otherwise impairing the clients' ability to make informed investment decisions. For more information about the FXCM's internal organizational and administrative arrangements for the prevention of conflicts, please refer to the Firms' Managing Conflicts Policy. Please ensure that you read and understand our Full Disclaimer and Liability provision concerning the foregoing Information, which can be accessed on the website.

DXY Anticipating more bulleshness on dollarHey traders, here is the analysis for the DXY. If you guys like my analysis please hit like👍 and follow. Thanks. DISCLAIMER:- This is not financial advice.

DXY Chart Analysis....
DOLLAR INDEX MY VIEW-
N.B- In this situation DXY chart create Bullish Flag Pattern's breakout @104.360.
resistance level, then market Buy UP to 105:000; @ 105.500 and 106:000 resistance level.
Then market need seems sell correction to nearest Support 105.500 level.
AronnoFX will not accept any liability for loss or damage as a result of
reliance on the information contained within this channel including
data, quotes, charts and buy/sell signals.
If you like this idea, do not forget to support with a like and follow.
Traders, if you like this idea or have your own opinion about it,
write in the comments. I will be glad.

DXY- BULLISH LONG TERM!Hey Everyone, DXY has rejected at our identified area when we shared an update last time, since then we have been monitoring DXY closely and it seems like price have been holding up smoothly. If it fails we will update you all!!

DXY BULLISHLooking for a Bullish Dollar. I am expecting it to go higher from the level noted today. This means I am looking for shorts on EURUSD. I am posting the EURUSD setup too on my profile. Entries will be on 8:30-9:30 NY TIME.

dxy bulls pulling up for a little bit the 1hr dxy is still bullish and creating hh and hl right at that last bullish ob if 103.800 level is one to watch and also the last higher high level watch it as well dxy still looking bullish to me
DXY Pre-market Analysis Daily TFBased on my analysis, DXY broke out of its previous descending bearish channel last week, and I'm currently anticipating a sustained bullish trend in the coming days or weeks. I have identified specific price levels as potential targets, which are shown on the chart.
However, if the market retraces back into the bearish channel, this could potentially invalidate my bullish outlook, and I would need to reassess the market's direction.
What's your oipinion on this? like and comment below

$dxy #dxy #elliottwave long trade setup.This count is based on my assumptions so anything can happen not a trading or financial advice just for educational purposes only kindly do your own ta thanks trade with care good luck.

DXY - Watch 1h FVG Hey traders, here is the analysis for the DXY. If you guys like my analysis please hit like👍 and follow. Thanks. DISCLAIMER:- This is not financial advice.

End Of The Dollars Plummet?What you see here is a larger time frame analysis of the overall price action of DXY(dollar). Price has moved away from previous major resistance and is now showing bullish price action and is now showing resistance at a price area that previously caused a strong sell of (supply). Price will consolidate here before choosing a direction which I believe will be to the upside. Wait for break of yesterdays manipulated high for entry with stop below the red supply line.

GOLD SHORT TERM INTRADAY IDEAIntraday Analysis - ( 14 FEB 2023 )
Price setting up for CPI data today with many choppy price action and no smooth upside or downside moves. However on the higher timeframe we can see lower lows printed respecting the bearish structure.
Personally am looking at cpi to continue being high with a strong labour data as reflected on NFP day. Potential liquidity grabs to the upside whereby i am eyeing 1876 and 1865 regions for shorts. Would be best if there is straight melts ofcourse. However this is in the event inflation still prints high.
HRHR SELLS 1883
MRMR SELLS 1876 / 1865
SAFEST SELLS below 1850
Will be looking at 1820 if cpi data prints with dollar domination and weakness in risk assets
If CPI data prints low, showing signs of improvements, i would be looking at longs only above 1883 cancelling out the entire downside move.
Either ways stay adaptive to the markets and safest is enjoy a glass of wine with your girl and stay away from the charts.
HAPPY VALENTINES DAY

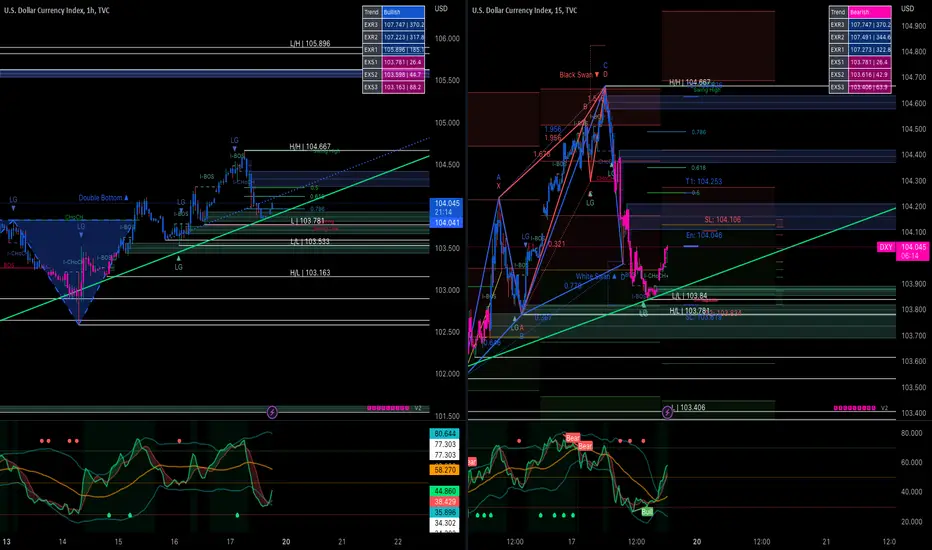
DXY - Anticipating Long from 1h FVG Hey traders, here is the analysis for the USD. If you guys like my analysis please hit like👍 and follow. Thanks. DISCLAIMER:- This is not financial advice.

DXY is set for a rise!Currency Pair : DXY
Possible direction : Bullish
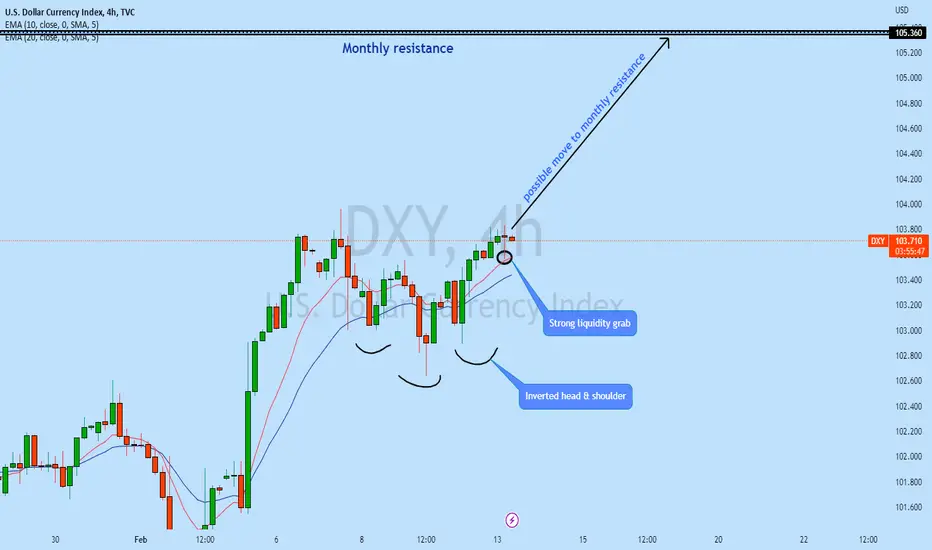
Technical Analysis : After market opening DXY has broken out the resistance with strong liquidity grab from the strong support zone. it is highly likely price will continue to rise as long term trend is bullish and we have seen multiple liquidity grab along the way
Possible trade recommendation : Bullish as per chart sketch
Press like button if you enjoy.
Risk Disclaimer: Trading foreign exchange on margin carries a high level of risk, and is not suitable for all investors. Past performance is not indicative of future results. The high degree of leverage is dangerous and can work against you as well as for you. Before deciding to invest in foreign exchange or any market you should carefully consider your investment goals, level of experience, and risk tolerance. It is EXTREMELY LIKELY that you will sustain a loss of some or all of your initial investment and therefore you should not invest money that you cannot afford to lose. No representation is being made that any account will or is likely to achieve profits or losses. Past performance is not indicative of future results. Individual results vary and no representation is made that clients will or are likely to achieve profits or incur losses comparable to those that may be shown. You acknowledge and agree that no promise or guarantee of success or profitability has been made between you, and Forex Trading Wizard. Do your own research and talk to a professional financial planner in order to be aware of all the risks associated with foreign exchange trading and investing and seek advice from an independent financial advisor before risking any capital.
DXY Index Monthly Move ??Pair : DXY Index
Description :
Bullish Channel as a Corrective Pattern
Break of Structure
Breakout the Consolidation Phase and Completed the Retracement
Rejecting from the Fibonacci Level - 50.00%
Divergence

DXY LONG PLAY 13-02-23 (Daily)I have been bullish on DXY for a few weeks now, I'm targetting consequent encouragement on the large upside wick on the weekly chart. The previous target was filled perfectly.

Golden cross for DXYIs golden cross gonna take place on DXY 200 ema?
Short continuation for crypro..

Dollar Index Chart Analysis....
In this situation DXY chart create Bullish Flag Pattern.So,If breakout @103.777
resistance level, then market Buy UP to 103:999 ; @ 104.720 and 105:600 resistance level.
Then market need seems sell correction to nearest Support 104.950 level.
AronnoFX will not accept any liability for loss or damage as a result of
reliance on the information contained within this channel including
data, quotes, charts and buy/sell signals.
If you like this idea, do not forget to support with a like and follow.
Traders, if you like this idea or have your own opinion about it,
write in the comments. I will be glad.


DXY BullishDollar is looking incredibly bullish.
This rhymes with my overall short outlook. Stocks look weak, commodities look weak, oil looks weak, cryptos are on the verge of total disaster. All very interesting (assuming it continues and heads deeper) considering where we are in the world. As far as the effect on the market - be careful, because if you fomo-ed long into stocks last week, a spike in the dollar is probably going to sting.
Kinda nauseating. Anyway I think this is a good place to maybe expect DXY to spike higher. We will monitor!
God bless!

US Dollar Index - Looking To Buy Pullbacks In The Short TermD1 - Price respected a strong support zone and is bouncing higher.
Bullish divergence.
H4 - Bullish divergence.
Higher highs.
Downtrend line breakout.
Until the strong support zone holds I expect the price to move higher further after pullbacks.

Buy on DXY DipStrong bullish trnd on current Dollar index.
Buy on the dip of the rally.
And take short term profit before the swing high.
