DXY-IT IS TIME TO SELL XXXUSD PAIRS!Dear traders, hope everyone having a great week, DXY we had a massive sell off due to mostly by economic events came out negative for USDOLLAR. What we are expecting on DXY is to reverse from the current price. Though we have NFP which will be crucial
Dxynextmove

DXY - Tool to assess Risk on/ Risk off scenariosHi guys. Welcome to my TA analysis on the dollar index. ALot of talk has been going on about whether or not we are in a bull market for bitcoin and if equities will rally further or not. In order to assess or determine if its likely that we are, the dollar is used by many analysts to gauge at what the sentiment is, whether "RISK ON" or "RISK OFF". As such i also have come to analyze and use DXY as such a tool.
RISK ON = When dollar is decreasing in price, other assets tend to go up. ( Hence we hear people mention "oh, the dollar is inversely related to stocks, crypto)
RISK OFF = sentiment is scared to invest and people flock to the safety of cash/dollar, Increasing the value of the dollar and prices of other assets decrease in price
With that lets look into what i see in the charts for DXY.
This analysis is done on the 2 day timeframe.
I've zoomed out to include about 17 years of data.
So PRICE ACTION
As you can see its interacting with the Red line that is drawn on chart. This is the 200 Day Moving Average. If you look left at all the examples i put up, everytime price action goes down we are below this line for atleast 100 days to as long as couple of years. WE also decline between 2% to as much as 20%.
The 2 recent times, we were under it for 380 days and 488 days with price dropping further down. Ofcourse our current price action doesnt have to do this but because it occured previously it is not out of the question.
At the least expect sideways action, which is also not a bad thing for RISK ON mentality.
BUT as of now we have CONFIRMED below the 200 dma on the 2 day timeframe. I expect the dollar to drop more in the intermediate to longer term of atleast 3 months to a 1 year even. The longer the dollar stays below, the stronger RISK ON mentality gets. This would validate the recent Crypto uptrend and may push equities, housing and others up too.
To further support my thesis, check out the 2 indicators i put up
1. RSI - I believe we have further sell off on the RSI and im expecting it to do below the 20 level, as it did in the examples i circled with white. Also notice the white horizontal resistance line i drew. As long as we stay below here, it validates my thesis of dollar staying down. Im expecting atleast 1 touch point near or below the 20 level. RSI is a close indicator of price action, when it points down, price usually follows and vice versa.
2. ADX and DI - Ths tracks momentum. As highlighted red line is crossing up, indicating bearish momentum to pick up. When price action is below the 200 dma and a bearish cross occurs we usually go down in price.
CONCLUSION: With everything mentioned, in my opinion i believe DXY to go down further in price, it staying in a downtrend for atleast 3 months to 1 year. Supporting the idea that maybe we are in the beginning stages of a crypto bull market and we may see equities rally more.
Thanks for tuning in. Hope this helped. If you like the content, please BOOST, COMMENT and FOLLOW. Check out my other charts on DXY. If you liked what you read, i also do potential buy/sell analysis on stock/ cryptos.
DISCLAIMER: This is not financial advice. I am not a financial advisor. Everything expressed in my posts are my opinion and for educational purposes. When trading please do manage your risk and protect yourselves with stop losses.

DXY Weekly CloseOnly a personal opinion - DXY Weekly
Seems positive for the USD today; look out two weeks, and it can still remain around the 102 level.
It will be sideways in the area 102-103 for the following week, now attempting to go to area 103.
If it break, the area 103 will continue to the area 104,448.
Perhaps the usd will receive some good news.

views in dcb for DXYTVC:DXY made retracement of 61.8% successfully after made a significant downtrend and reversed from a strong resistance zone. now if it breaks 101.3-100.8 it will down till 99.8-99.4 to 97.7-96.9 and moreover 97.02 also a fibonacci forward zone of 127.2%. allover trend is downtrend.
Disclaimer - This chart analysis is only for educational purpose. Do proper research before trade/investment or consult with your financial advisor. This expressed opinion/view/analysis isn't a trade/investment advice/recommendation. SEBI unregistered independent trader/analyst.

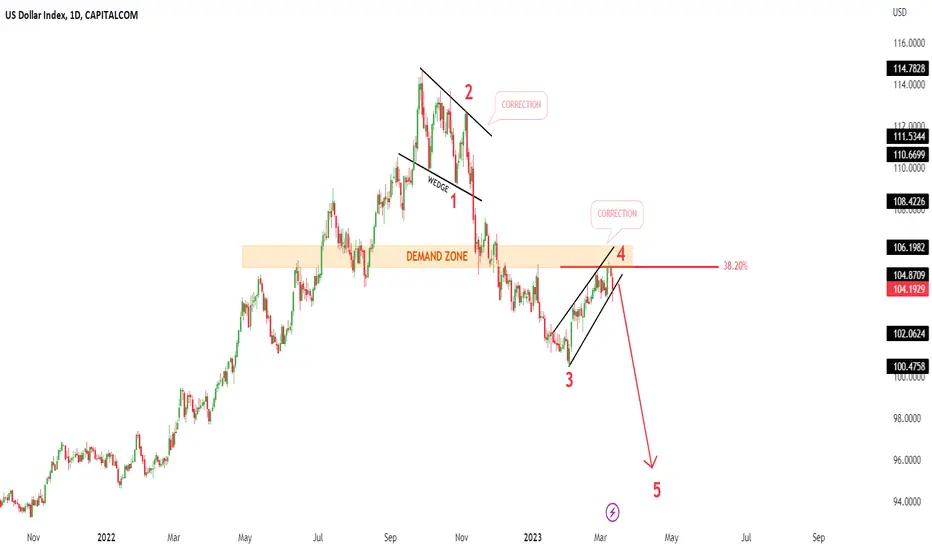
DXY Index New Week Move Pair : DXY Index
Description :
Rising Wedge as an Corrective Pattern in Short Time Frame and Breakout the Lower Trend Line
Divergence
Rejecting from the Daily Demand Zone
Break of Structure
Completed " 1234 " Impulsive Wave at Fibonacci Level - 38.20%
#DXY LTF update...#DXY LTF update...
Deviating January high didn't convince me. I expect #DXY to wipe out the monthly FVG...
If it wipe out the monthly FVG first before liquidating the previous low, I expect a good correction of USD. Parallel with that #BTC will make hh's again…

DXY LONG PLAY 06-02-23 (H1)
The weekly close was very bullish, this is my first target next week. I am targeting the daily FVG and equilibrium of the FVG. My long-term play is the weekly volume imbalance as it has been for a few weeks but it may take months to play out.

Friday's look at DXYHELLO TRADERS, I wish you a pleasant end of the week.. so let's get to the analysis
If during today's NY session we rebound from the marked zone 106.630 - 106.780, then we can continue further upwards to test the zone of interest around 107.750

DXY (High Probability Buy Setup soon)The U.S. Dollar Currency Index (DXY) is showing continuing strong BULLISH move towards ATH of 114.773 of Mon 26 Sep '22, with U.S. inflation figures out later on today are in the spotlight, with the data expected to reinforce bets that the Feds will continue to tighten policy aggressively, hence extra strength to the DXY.
Keep a close eye on DXY today, happy pip hunting traders.

DXY US Dollar Bearish DivergenceThe US dollar is losing strength after getting rejected from the 2nd top. It also formed bearish divergence.
Currently, it is holding above the trend-line support and a breakdown below it, would be a bearish confirmation for it and if it gave a close above 2nd top then that would confirm more upside move in the price of the US dollar.

Triple Top on the DXY? 109.9 (Opinion)No position was opened. If so, a pullback for its next move up is required. Crypto could be making its next move up. Correlations in TOTAL and the DXY are very noticeable right now.
A slight pull back could mean cryptos next leg up.

Dollar In ranging, Short expectedNow Dollar index consolidate on108.3-109.3. If breakout then dollar gonna another high to 111.2; If NFP data will negative, Dollar gonna 106.3 and go on.
Big Picture! Dollar now on solid bullish trend or up trend and still dominates the higher price.
DISCLAIMER
Remember, there is no place for luck in trading - only strategy!
This analysis can change at anytime without any update and it is only for the purpose of assisting traders to make independent investments decisions. We are the only one person who is responsible for our physical, mental health, relationships, success, and money in our lives. So taking a trading or investment risk on the markets based on this idea. You deserve the profit and you are responsible for your potential loss. Any opinions, news, research, analyses, prices, or other information discussed in this idea.
Here i anticipated by price action, please do not consider investment advice, Because i'm not your official financial advisor. The author of this analysis does not accept liability for any loss or damage.


DXY need correctionDXY create higher high & lower high; bearish divergence pattern. in technical view dxy need a correction. I also see another view of dxy; dxy create bearish butterfly pattern.

DXY Jan 2021 PA and Divergence with Time Speculationas we had analyzed this index earlier in lower time frames (240,D), we are getting more confluences or trend reversal even in the higher time frames of weekly.
we can see the price has reached one of its significant support zones and it is diverging with MACD and Its Histogram so forming a Bullish Divergence, which is the sign of trend reversal and we may have more confirmation as Price Action analysis also show that.
the TP zone has been Specified by Fibonacci retracement levels and Fibonacci Time base tools.
we may have some range and Accumulation at the same Support zone which the price is Currently located or instant trend reversal as USA Administration policies are also changing Due to the presidential Elections or if Washington faces more riot and chaos so does the index fall are reaches the heavy Support zone (Green Box)
we can think of shorting the USD Quote Currency Pairs such as EURUSD, GBPUSD, AUDUSD...
and long the USD Base Currency Instruments like USDJPY...
what do you think about it?

DXY: POSSIBLE MOVEMENT BEFORE AND AFTER NFPHere is my idea on dollar index, expect price come to correction area.
If you have any idea, comment below and don't forget give thumbs up

DXY Daily charts.DXY has hit the bottom of the channel, apparently in my opinion, the market will respect the channel support, and we can look forward, retaining its upward trend. However, it is a risk I am happy to take, for a BUY trade.


US-Dollar possible next big movesHi!
First of all:
it's a personal, purely technical view
without taking news or economic miracles into account!
or an alien invasion...
your opinion on this is very welcome in the comments!
Part 1: way up
let's switch to a smaller time frame to see why I think it would be possible
There is still a key level from the last up move in 2014 that has not been tested again.
I could imagine this will happen before we see another upward movement.
this key level is also in the range between 78.6 and 88.2 fibonacci.
anyone who knows a bit about fibonacci, knows that the market likes to hit this area again before major movements happen. mostly ... not always but often.
if this happens and the market does not break through here, the way could be free to go upwards.
Part 2: way down
here i take the same principle - just rotated
there is still the level of the high between 2000-2002 which has not been retested.
here again the fibonacci with the same levels. only rotated this time.
the range between 110 and 115 would be a very good short entry for me. because there could be a really tough resistance.
if the market goes above 121, we can look forward to more golden times.
if not... Michael Burry gets his next big short.
the only question would then be how far the usd can fall. the target area at -27 Fib is only a guess!
maybe someone already sees possibilities!
maybe I'm completely wrong?
we will see...
thanks for reading and have a nice day
not a trading recommendation or a investment advice
just my own opinion


BULLISH DXYDXY has bottomed out around the 89.50 level and has continued to grind higher since. The next level that we took out was the 89.90 level which now acts as support and the upward trend line and pivot area. I expect a move higher in the dxy in the coming weeks and therefore I will sell the rallies in EURUSD and AUDUSD and buy the dips in USDJPY.
Good luck!

DXY Bearish Than BullishDollar create descending channel with hidden bearish divergence. So now its gonna complete 5 than supper bullish for dollar!

