Dollar Index - Expecting Bullish Continuation In The Short TermH4 - Strong bullish momentum followed by a pullback.
No opposite signs.
Until the two Fibonacci support zones hold I expect the price to move higher further.
If you enjoy this idea, don’t forget to LIKE 👍, FOLLOW ✅, SHARE 🙌, and COMMENT ✍! Drop your thoughts and charts below to keep the discussion going. Your support helps keep this content free and reach more people! 🚀
--------------------------------------------------------------------------------------------------------------------
Dxyprediction

7.2 Gold bulls continue to rise, bears come to an end temporarilFrom the 4-hour analysis, the upper focus is on the 3345 line of suppression, the lower short-term support focuses on the 3314-3316 line, and the key support of 3295-3301 line is focused on. The overall support is based on this range to maintain the main tone of low-multiple participation. In the middle position, watch more and do less, be cautious in chasing orders, and wait patiently for key points to enter the market.
Gold operation strategy:
1. Gold 3316-24 line long, retrace to 3295-3303 line to add more positions, stop loss 3293, target 3340-45 line, continue to hold if broken;

Continue to try to short gold,It's expected to touch 3355-3345 Gold has broken through 3380 twice, but recovered quickly, indicating that the bulls still have some defensive power. At present, gold has touched 3400 again; it can be seen that the bulls' potential defense is still good, but it is not enough to support the continued rebound of gold in the short term. Obviously, gold is still under pressure in the 3410-3420 area in the short term. If gold cannot break through this resistance area in the short term, gold may continue to maintain a volatile state and continue to seek strong support downward. Only after gold breaks through the 3410-3420 area, it is expected to continue to rise and touch the area near 3450 again.
When gold tested the support near 3380 several times during the day and tried to break through this area, after gold failed to break through the 3410-3420 area in the short term, I think gold will be more likely to choose a downward direction, or even continue to test the 3355-3345 area. Therefore, for short-term trading, before breaking through the 3410-3420 area, we should not chase gold too much, and we can try to short gold in this area appropriately.

U.S. Dollar Index (DXY) Bearish Setup – Supply Zone Rejection & 🔹 Trend Overview
📊 Overall Trend: Bearish (Downtrend)
📉 Price is forming lower highs and lower lows within a descending channel.
🔻 Recently bounced off a support zone, now heading toward a potential pullback.
🔵 Supply Zone (Resistance Area)
📍 Zone Range: 100.049 – 100.601
🧱 Acts as a resistance block where sellers might step in.
📏 Confluent with EMA 70 at 100.178, strengthening its validity.
🔸 Trade Setup – Short Position
🟠 ENTRY POINT: 100.088
❌ STOP LOSS: 100.587 – 100.595 (Just above supply zone)
🎯 TARGET: 98.000 (With intermediate support levels)
📌 Support Levels
🔹 98.112 – First minor support
🔹 98.106 – Close-range confirmation
🔹 97.885 – Additional support zone
🟦 Main Target: 98.000
⚖️ Risk/Reward Ratio
🟧 Small risk above supply zone
🟩 Large reward to downside = Favorable R:R
📌 Summary
📈 Expecting a pullback into supply zone.
🧨 Look for bearish confirmation around 100.088.
🎯 Target the downside at 98.000 for profit.

DXY Bearish Setup: Sell from Supply Zone to 99.100 TargetTrend: 📉 Bearish Bias
Key Zones & Strategy:
🔶 Supply Zone (Sell Area)
📍 100.584 – 100.906
⚠️ Price may face selling pressure here
🔵 Entry Point:
🎯 100.584 (bottom of supply zone)
🔴 Stop Loss:
❌ 100.906 (just above resistance)
🟢 Target Point:
✅ 99.100
📉 Aligned with lower support line
Technical Indicators:
📏 Descending Channel
🔽 Price moving within parallel downward trend lines
📊 EMA (70) – Orange Line
🔁 Acting as dynamic resistance
Trade Setup Summary:
📌 Sell in the Supply Zone
🛑 Stop Loss: 100.906
🎯 Target: 99.100
⚖️ Good Risk-Reward Ratio
Warnings & Tips:
⚡ Watch for Breakouts:
If price breaks above 100.906 ➡️ 📈 Bearish idea invalid
📰 Check News Events:
FOMC, CPI, or other USD events may cause volatility

DXY LONG/BUYBy utilizing Fibonacci retracement levels, historical patterns, , we can formulate a hypothesis that the market might follow a similar trajectory if bullish sentiment prevails.

Dollar Index at Risk: Key Support Holds the Fate of the TrendThe U.S. Dollar Index (DXY) has broken down from a Head & Shoulders pattern, confirming a bearish reversal after a successful retest of the neckline. The price is currently near a key support area, and if it fails to hold, a drop toward the lower strong support zone is likely.
Additionally, RSI is showing bearish divergence and is below the neutral 50 level, indicating weakening momentum.
DYOR, NFA

3.31 Gold officially breaks through 3100In the early Asian session on Monday (March 31), spot gold once again saw a surge in prices shortly after the opening. The most active gold futures contract in New York was traded in one minute from 10:22 to 10:23 Beijing time on March 31, with 890 lots traded, and the total value of the trading contracts was US$279 million. Affected by Trump's latest tariff news, spot gold maintained the current bull market trend. The gold price broke through the US$3,000 mark and broke through US$3,100 only half a month after breaking through the US$3,000 mark. As of 10:39 Beijing time, it was reported at US$3,105.23 per ounce.
Gold technical analysis: Gold closed higher with a big positive line last week, and after consolidating at a high level, it increased strongly and closed at a high level. The weekly K-line is still strong, with a big bald positive line. There will be further continuation this week. However, the monthly line closed today. After the volume is released, we must also be careful of the wash of the high and fall. The daily chart has continued to rise and set a new high. The Asian session is a slow consolidation and then a slow new high. The consolidation is not the high, and the volume is the top. At present, there is further rise in the short term. Gold was stimulated by risk aversion over the weekend. It opened high and fell back on Monday. However, gold fell back under pressure at 3100 in the short term. We must pay attention to adjustments. Then gold is just adjusting. Wait patiently for it to fall back before going long. The technical side of gold shows a strong upward trend. US$3070 has become a new short-term support level. The current upward momentum is sufficient and there is momentum for further rise. The influence of gold bulls on the current trend of gold has reached the highest level in history, but the trading scale and heat have not reached the most crowded range in history. There is still room for funds to further increase positions, which provides support for gold prices.
3.31 Gold Operation Strategy Reference:
Short Order Strategy:
Strategy 1: When gold rebounds around 3100-3103, short (buy short) in batches with 20% of the position, stop loss at 3110, target around 3085-3075, and look at 3070 if it breaks; (Strategy is time-sensitive, more real-time layout strategies are announced in the channel.)
Long Order Strategy:
Strategy 2: When gold pulls back around 3070-3073, long (buy long) in batches with 20% of the position, stop loss at 3060, target around 3085-3095, and look at 3105 if it breaks; (Strategy is time-sensitive, more real-time layout strategies are announced in the channel.)

DXY LONG/BUYBy utilizing Fibonacci retracement levels, historical patterns, , we can formulate a hypothesis that the market might follow a similar trajectory if bullish sentiment prevails.

DXY SELL/SHORTBy utilizing Fibonacci retracement levels, historical patterns, , we can formulate a hypothesis that the market might follow a similar trajectory if bearish sentiment prevails.

On 3.19, gold continued to fluctuate upward after breaking throuAs a safe-haven asset, gold has attracted more buying amid global political tensions: the escalation of the conflict in the Middle East and the continued strikes by the United States against the Houthi armed forces in the Red Sea region may affect the energy supply chain. The uncertainty of the ceasefire negotiations between Russia and Ukraine has led to a high risk aversion in the market. The increase in domestic political risks in the United States may affect market confidence and push up gold demand.
The rise in gold on March 18 is in line with my thinking. Obviously, the US market was suppressed at 3028. After a short-term retracement, it further broke upward. It is expected to continue the upward trend at night and see the suppression of 3044.
The weekly and monthly lines are concerned about the upper track position, and even diverge upward under the impetus of market sentiment. The specific position cannot be determined because there is no reference point, but it is only necessary to follow the market trend to do it, and the transaction is relatively simple. From a technical perspective, the upper track of the weekly line is 3030, and the upper track of the monthly line is 3050. This is the position that needs attention. In addition, the previous two waves of rises have gone through 4 positive monthly K lines, and then closed with a negative correction.
Support level
$2994; $2982; $2950
Resistance level
$3025; $3050; $3080

3.14 Risk aversion and interest rate cuts have pushed gold to thGold is supported by risk aversion and interest rate cut expectations, and the overall trend remains upward. Short-term technical aspects also show that the advantages of the bulls have been strengthened.
On the daily chart, gold has set a new record high and performed very strongly. For the support below gold, radicals pay attention to the upper rail position of the daily and weekly Bollinger bands at $2,983, which is also the low point of the gold price falling back in the morning. Secondly, the low point of the fall after the intraday high in the US market on Thursday was $2,976. The continued fall suggests that the gold price has the risk of adjustment. Pay attention to the previous historical high of $2,956; for the pressure above gold, pay attention to the breakthrough of the integer position of $3,000. If it breaks through and stands firm here, it will not guess the top. The 5-day moving average is golden cross upward, the KDJ and RSI indicators are golden cross upward, and the MACD indicator forms a dead cross, indicating that the advantages of the bulls in the short-term technical aspect are further strengthened.
Resistance points: 2,990, 3,000, 3,010
Support points: 80, 70, 56

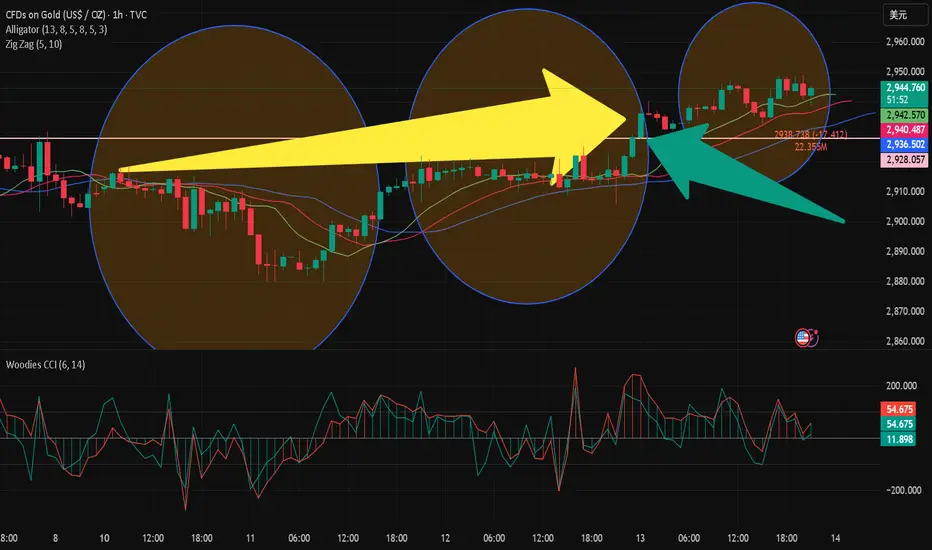
3.13 Technical analysis of gold short-term operationGold market analysis:
, Gold hourly level: In the morning, it rose from 2932 to 2946, and fell back to 2932 from 2946 in the afternoon. It rose from 2932 to 2948 in the European session. From the trend of the Asian and European sessions, it can be seen that it may enter a certain range of back and forth consolidation; combined with the trend of the bottom of 2880 rising to 2948, it can be found that there is a similar pattern in early March. After a short-term continuous rise, it will enter the box oscillation for several hours, and then continue to rise in a short-term continuous rise, and then continue to enter the box oscillation; then combined with the yellow channel in the above figure, pay attention to the pressure of the upper rail 2951-53 tonight. If it is suppressed, it may fall back to 2932-30 repeatedly. The lower rail support is an ideal bullish point. It will move up to 2923-25 tonight, which is also the top and bottom conversion position. If it can be touched, it is necessary to continue to follow the bullish
Resistance point l: 2945 2955 2970
Support level: 2935 2920 2900
Traders, if you like this idea or you have your own opinion about it, please write it in the comments. I will be happy
3.11 Gold’s short-term signal resistance levels are mixedSpot gold rebounded slightly in the Asian session on Tuesday (March 11) and is currently trading around $2,896.52 per ounce.
The technical signals of spot gold are a bit mixed. It has successfully stabilized near the support level of $2,879 per ounce and started to rebound. The focus on the resistance near 2,915 is on the top.
Between March 4 and March 7, a temporary top was formed in the range of $2,894 to $2,927. This indicates that the target is $2,861. However, after a brief confirmation, the top became invalid as the price of gold climbed above the neckline of the pattern at $2,894.
The rebound increases the possibility of resuming the upward trend from $2,832. A breakthrough of $2,909 will be seen as a strong signal to resume the upward trend.
Before the price of gold climbs above $2,915, the price of gold may still be biased to the downside, as the current rebound may just be a correction to the top, and the correction is a bit excessive.
On the daily chart, gold is also neutral in the range of $2891 to $2934, similar to the situation on the hourly chart.
When gold moves out of the range, the signal will become clearer. The wave pattern suggests that the market may experience a small decline first, followed by a strong rebound.

US Dollar Index Short Term Sell IdeaH4 - Strong bearish momentum
Lower lows
Until the two strong resistance zones hold my short term view remains bearish here.

3.5 Technical Analysis of Short-term Gold OperationsThe non-farm payrolls (NFP) and consumer price index (CPI) data to be released this week will be the focus of market attention. If the data is strong, especially the inflation data is higher than expected, the market may reduce the bet on the Fed to cut interest rates. The market currently expects the Fed to cut interest rates by 75 basis points this year, an increase from the 44 basis points expected last week.
Gold Technical Analysis - Daily Chart
From the daily chart, gold received support near $2,832 last Friday and rebounded to $2,900 driven by tariff concerns. However, from this time frame, market information is limited, so it is necessary to further zoom in on the analysis period to get more details.

3.5 Technical analysis of gold short-term operation Key point 25Looking back at the overall market, gold has rebounded for two consecutive days, but from the perspective of the morphological structure, it is not yet in a state of reversal. Beware of the risk of a fall after a surge.
From the perspective of the one-hour and four-hour structures, the overall trend is still in a downward trend. Although there has been a strong rebound in the past two days, the rebound is not a reversal.
Today, we need to focus on $2925, which is 680 yuan, as the dividing line between today's long and short turns. Below this area, given the rebound in the past two days, I think we can try to go south to see a fall. Refer to the 2895 or 2880 area below.
However, if the box continues to oscillate today and closes above $680 or $2925, it will bottom out and turn to long! At that time, we will adjust our thinking and look north to see new highs!
Note that the short-term market is approaching a turning point, and 2925 needs to be paid attention to.

Mighty Dollar Eyes Further GainsThe US Dollar Index (DXY) commenced the new year on a strong note, breaking out of its consolidation phase and surging toward the 109.50 level on January 2.
◉ Technical Observations
● The daily candle close on Friday formed an inside bar bearish candle, indicating a potential pullback in the week ahead.
● Immediate support levels are situated between 107.50 and 107.00.
◉ Market Outlook and Key Events
The US jobs report comes out on Friday and will be the main focus for the market this week. A strong jobs report could strengthen the US dollar, affecting emerging markets and commodities.

The collapse of US stocks across the board, is this a sign of a 8.2 US stocks collectively plunged
Qualcomm fell 9%
Nvidia fell 6%
Tesla 6%
Philadelphia Semiconductor Index fell 8%
Intel fell short of expectations
Is the above directly related to the news of interest rate cuts in September?
The answer is "YES"
What do you think of this comment area? Welcome to comment

DXY Dollar Index Technical Analysis and Trade Idea👉🔍 We can observe that DXY has been in a bearish trend recently. However, it has experienced a significant move into a key support zone. In the video, we discuss market structure, price action, and the trend. I'm expecting to see a potential reaction and an opportunity to go long if the price action unfolds as described in the video. As always, this is for educational purposes only and should not be considered financial advice. 📊✅

DXY: UP or DOWN ?Hello traders, hope you are doing great.
For upcoming Days, I think we'll probably see a downtrend correction in DXY at first and after that we'll probably see growth up to the specified Level and beyond that.
and finally tell me what do you think? UP or DOWN? leave your comment below .
If this post was helpful to you, please like it and share with your friends.
Thanks.

US Dollar Index Short Term Sell IdeaH4 - Bearish trend pattern
Strong bearish momentum
Until the strong resistance zone holds I expect the price to move lower further after pullbacks.

DXY and USD Pairs Technical Analysis and Trade Idea In this video, we provide a succinct analysis of the U.S. Dollar Index (DXY) and its potential impact on USD pairs. Following recent bullish momentum, the DXY has become overextended, reaching resistance levels. Currently, we observe a significant retracement toward support. Our main goal is to identify an optimal buy entry point within this critical support zone, assuming price action aligns with our analysis from the video.
As always, the video offers valuable insights into trade entry points, trend analysis, market structure, and price action. It’s essential to recognize that this content serves an educational purpose and should not be construed as financial advice." 📈🚀📊
