DXY Bearish SpeculationWe are forming our right shoulder, we might get an extension to the next resistance before heading down, price action shall tell us.
Dxysetup

SHORT TERM Bearish view on Dollar indexSHORT TERM Bearish view on DXY
DXY Head & Shoulders Pattern on the Daily, retest and rejection of critical retracement zone. Details are on the chart.
Thank you for support and likes. Feel free to comment below.


DXY MOVE UPDXY:
- Still in the uptrend channel
- It has touched the support line
- Being in the demand zone
- Touched the .782 Fibo retracement
- Wave 5 is finished
- Bullish Divergence
- Set to form Chyper pattern
Bullish/Long:
-TP 1 at 95.70
-TP 2 at 96.50
Invalid if drops through 94.68 low

DXY POTENTIAL REBOUND AREATVC:DXY REBOUND..?
Hello! I have for you very interesting long idea
Stop on the chart. All details available on chart, but if you need - please comment and let's discuss.

DXY POTENTIALLY TO SET BEARISH CYPHERCypher Pattern Rules:
- Point B is the Fibonacci retracement of point XA of 0.382 to 0.618
- Point C is an extension of XA of at least 1,272 or between 1,130 - 1,414
- Point D is the Fibonacci retracement of the XC point of 0.782
DXY has the potential to form a similar formation, with point B of 0.32 and point C a little longer at 1.667. DXY also managed to move up to form an uptrend channel after touching this year's low at 88.25 points, if DXY successfully maintains to move in the uptrend channel then there is a possibility that DXY will finish the pattern by touching 99-100. If this happens.
The key point is if the DXY slumps and exits the uptrend channel and continues to penetrate 88.25, the failed pattern is formed, meaning that as long as the pattern has not been formed, it will still be a lot of possibilities. But if the pattern is successfully formed until it is finished then it will be very helpful to project the next DXY trend, here the pattern formed is bearish cypher.


Support & Resistance Fight95.00 resistance and 94.00 support is a key area of interest for the Dollar as you can see how price reacted previously to these levels. It has tapped 95.00 today and pulled back so there is bullish pressure there, but can the bears keep it below this level and closer to 94.00?

DXY Strength - But A Trendline In The Way?The last two weeks we have seen some bullish moves with the Dollar which broke the DXY out of a low range. However on a weekly chart, we can see it has now reached a descending trendline around the 93.00 level. Could this be a bit of a make or break move for the Dollar? With a break to the upside and push towards previous 2017 highs or a rejection and downside move to test 87.00 area.

Up Down Up DownThe Dollar Index has been stuck in this wedge pattern since the beginning of 2018. After a large fall from the 95.00 area it seems to have stalled and now deciding on whether to continue pushing down, or prove this wedge pattern is the bulls getting ready to go! Between 90.50 and 80.50 seem to be keen bounce areas for price to reverse so keep an eye for a a strong rejection / break of these levels...

Long on DXY based on Inverted H&S Chart PatternThis research is for informational purposes and should not be construed as personal advice. Trading any financial market involves risk. Trading on leverage involves risk of losses greater than deposits.
Please comment below and Like if you agree with my analysis.

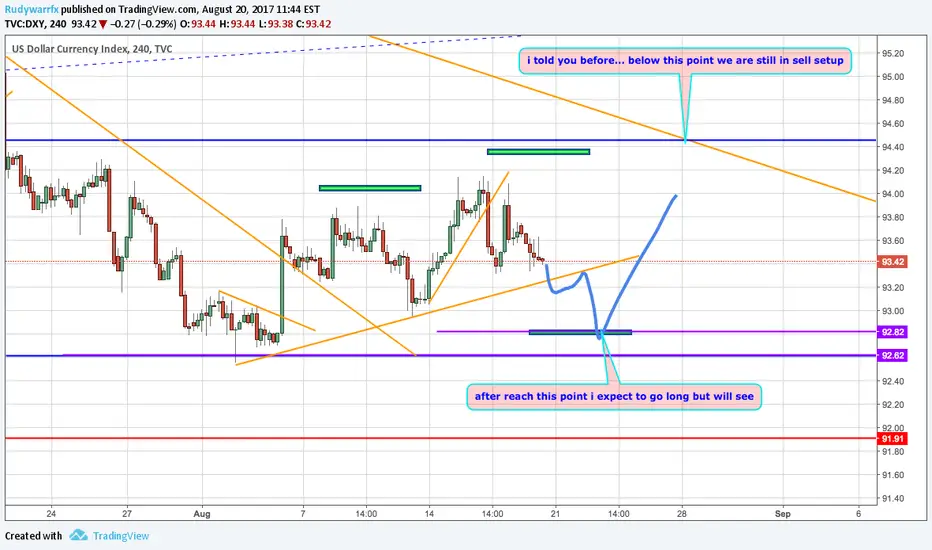
DXY lookapproaching the internal trendline, if main trend line is broken be careful to be short before price clear the support zone


DXY next daysweakness in DXY but not for to long... will se how the market reacts the next couple of days Trade Safe guys and thanks for your comments
DXY @ 1h @ will 101.78 holds this week & confirm bullish trend ?Take care
& analyzed it again
- it`s always your decision ...
(for a bigger picture zoom the chart)
Best regards
Aaron

DXY @ 1h @ will flag-formation be confirmed this 52nd week `16Take care
& analyzed it again
- it`s always your decission ...
(for a bigger picture zoom the chart)
Best regards
Aaron
