DXY: The US dollar faces the risk of being sold off?Investors sold the dollar late last week at the fastest pace in a year, hoping for lower interest rates next year after the Federal Reserve ends its policy rate cut. significantly raise interest rates.
State Street, one of the world's largest asset managers, said the asset manager was prepared to sell 1.6% of its dollar positions this month, the largest monthly outflow since last November. The company said. In particular, investors have enjoyed "significant" selling every day since the release of the US employment report on November 3rd.
"The developments over the past two weeks suggest that demand for the dollar is undergoing a rapid reassessment," said Michael Metcalfe, head of macro strategy at State Street. He added that the recent sell-off in the dollar signals an end to the "extraordinary dollar glut."
``Investors are thinking, ``If interest rates are really cut, there is no need to hold so many dollars,'' the expert said.
Experts predict that the sell-off by asset managers may be just the beginning of a long-term trend among investors to reduce their exposure to US assets, with the US dollar weakening in November. This was the worst monthly performance of the year.
According to the Financial Times, a weaker U.S. dollar is beneficial for emerging countries because it helps them repay dollar-denominated loans and potentially draws investors back to developing countries. This comes after a huge sale of foreign currency-denominated bonds this year.
Dxyshort!!!!!!!!!!!!!

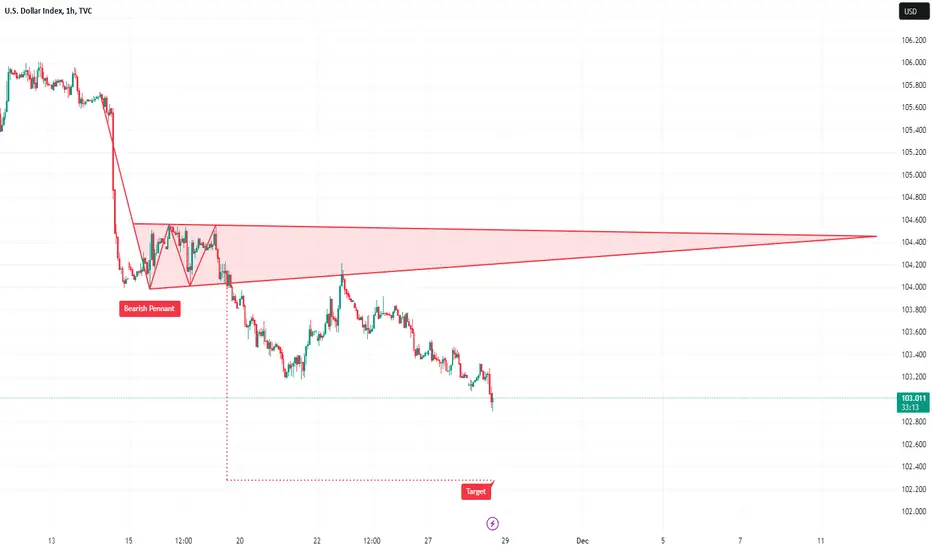
DXY → Extra losses in the pipelineTVC:DXY extends the leg lower for the fourth session in a row on turnaround Tuesday.
Further weakness in the index is expected to challenge the key support at 103.00 sooner rather than later. The loss of this region exposes the weekly low of 102.93 (August 30) ahead of another round level at 102.00.
In the meantime, while below the key 200-day SMA (103.60), the outlook for the index is expected to remain bearish.
DXY update roadmap for trading heloo dear trader
I am waiting for the fall ...
my road map on this chart
What is institutional price action?
It's a tactic most often employed by institutional and retail traders. Generally, these traders use leverage to place large trades on the basis of small underlying price movement. The short-term nature of these trades makes other strategies, such as technical or fundamental analysis, less effective.
stop loss need for any position
goodluck... mehdi

DXY SHORT TILL 98.824Certainly! Below is a more detailed and comprehensive template for publishing your idea on TradingView for the US Dollar Index (DXY):
---
**Title:**
Short on DXY - Target Price 98.824 📉
**Introduction:**
Greetings, fellow traders! Today, I'm sharing my analysis on the US Dollar Index (DXY) and a potential short-term trading opportunity that I've identified.
**Analysis:**
*Technical Analysis:*
The DXY is currently exhibiting signs of weakness based on my technical analysis. Key resistance levels at have held, and the price is showing a potential bearish trend reversal.
*Fundamental Factors:*
In addition to technical analysis, consider fundamental factors influencing the USD. Recent economic data or geopolitical events may contribute to the bearish sentiment.
**Trade Setup:**
*Entry Point:*
I'm looking to enter the short trade if the price breaks below . This would confirm the bearish momentum.
*Stop Loss:*
To manage risk, my stop-loss order is set at . This is a crucial point to prevent significant losses in case the trade doesn't go as planned.
*Take Profit:*
My target for this short trade is set at . This level aligns with my smart money concept technical analysis.
**Risk Management:**
I am risking 20% of my trading capital on this trade. This ensures that even if the trade goes against me, the impact on my overall portfolio is limited.
**Disclaimer:**
Trading involves risk, and this idea is for educational purposes only. It's essential to conduct your own analysis and consider your risk tolerance before making any trading decisions.
**Chart Setup:**
I've attached my chart template for reference.
**Tags:**
#DXY #USD #Forex #ShortTrade #TechnicalAnalysis #RiskManagement
Feel free to share your thoughts, ask questions, or provide feedback. Happy trading, and may the markets be in your favor! 🚀
---
Feel free to modify this template according to your specific analysis and trading style. Always ensure your content aligns with TradingView's guidelines and provides valuable information for other traders.

USD Weakens; Currencies ResilientThe Dollar Index (DXY), measuring the greenback against a basket of key currencies, extended its decline to 103.40 (from 103.75) during the holiday trading session.
The Canadian Dollar (CAD) outperformed, causing USD/CAD to drop by 0.7% to 1.3615, hitting a one-month low. Canada's year-on-year retail sales for September surged to 2.7%, beating expectations of 2.0%.
The British Pound (GBP/USD) rebounded to 1.2605 (from 1.2540), while the Euro (EUR/USD) rose to 1.0942 (from 1.0905). Germany's IFO Business Climate increased to 87.3 in November, beating forecasts but slightly lower than the previous reading of 86.9.
The Australian Dollar (AUD/USD) extended gains to 0.6585 from 0.6560, nearing its three-month high. The New Zealand Dollar (NZD/USD) climbed to 0.6085 (from 0.6045) on strong sentiment from Australia and risk appetite.
Against the Japanese Yen, the U.S. Dollar (USD/JPY) dipped to 149.45 from 149.65 in subdued trading. The greenback closed lower against Asian and emerging market currencies.
USD/CNH (Dollar-Offshore Chinese Yuan) dropped to 7.1475 from 7.1515, and USD/THB (Dollar-Thai Baht) ended nearly unchanged at 35.40 (from 35.43). USD/SGD fell to 1.3405 from 1.3420.
Global bond yields rose, with the 10-year U.S. Treasury yield reaching 4.47% (from 4.40%). The 2-year U.S. Treasury yield increased to 4.95% (from 4.90%). Germany's 10-year Bund yield rose by 3 basis points to 2.64%, and Japan's 10-year JGB yield spiked to 0.76% (from 0.71%).
The U.S. stock markets closed stable on Thanksgiving, with the Dow rising 0.27% to 35,383 (from 35,287), and the S&P decreasing to 4,557 (from 4,560). Global equity markets showed mixed performance.
The VIX, measuring U.S. stock market volatility, dropped to its lowest close since January 2020, reaching 12.46, a 2.7% decrease. Increasing expectations suggest that central bank tightening measures have concluded, contributing to calmer stock markets.

DXY (Dollar) Shorts from 103.300 down to 102.200This Weeks DXY bias is to expect another major move to the downside to continue its bearish trend that it has now set. To capitalise on this movement we will wait for a minor pull back up to a near unmitigated supply, (which will be the 9hr) to look for entries to get into this selling trend.
From this we will look for our usual wyckoff distribution to play out on the lower time frame and a CHOCH inside our POI to the enter our sell positions. I would love to see the asian high get swept as well because it will increase our confluence for a stronger sell bias. Overall I am temporarily bearish for the dollar and I expect price to keep dropping for the rest of this year.
Confluences for DXY (dollar) sells are as follows:
- Price is temprorarily bearish due to the perpetual BOS to the downside.
- There's still trend liquidity left to the downside that hasn't been taken.
- For price to react off next there is a demand zone below on the 4hr region.
- There is a clean supply 9hr that caused an impulsive to the downside.
- By the candle stick anatomy bearish candles are very strong holding lots of momentum.
P.S. I would ideally wait for this structure to break first before seeing the correction back up to the 9hr however, if price goes that low I see it continuing going down to reach our next demand. Which we will then anticipate a potential short term buy back up.
ALSO WE HAVE REACHED 100 FOLLOWERS, SO MANY THANKS! BE SURE TO SHARE THE PAGE TO YOUR FELLOW TRADERS AND HAVE AN AMAZING TRADING WEEK AHEAD!!!

DXY ideaHello Traders !!
As We can See Dollar index (DXY) Continually Bullish without any retest From Last 11 Weeks
We Can See there is no imbalance in Last 4 Candle so we expect dollar must Sell to 103/100
if You are Agree my idea
Please Like & Comments

A deeper pullback is seen below 104.00TVC:DXY reverses two consecutive daily advances and resumes the downward bias on Friday.
In case bears regain control, the breakdown of the November low of 103.98 (November 14-15) should pave the way for a quick test of the critical 200-day SMA at 103.61 prior to the weekly low of 102.96 (August 30).
In the meantime, while above the key 200-day SMA, the outlook for the index is expected to remain constructive.

USDJPY Update - Big Profits aheadBig profits on USDJPY, we are 250+ pips in profit in some day on a single positions. If we can break 149.250 level, UJ will officially enter in a new daily downtrend after weeks of uptrend. New target show us 200+ pips again of profit. Stay tuned

DXY Preparing for Another Leg Down! Grab This Next Short Entry!DXY confirmed its breakout from the bull channel to the downside and is currently showing some minor support at the 200EMA. I would expect the price gap from here to the 9EMA at 105.000 to close followed by another leg down. We have to be careful to not get caught in a 2 legged trap, which is also a possible outcome at this level.
How do we trade this?
Wait for a sell signal at the 9EMA with a strong bear bar closing on or near its low before entering a short.
Key Points
1. 200EMA Showing Some Support
2. Two Pushes down, Third Probable
3. Gap to fill to the 9EMA around 105.000.
4. Look for another Short entry at 105.000 with a sell signal
You are solely responsible for your trades, trade at your own risk!
Let us know what you think in the comment section below!

Another drop to 104.00 remains in storeTVC:DXY manages to pick up extra pace and extends further the bounce off multi-week lows around 104.00 on Thursday.
In case bears regain the upper hand, the breakdown of the November low of 103.98 (November 14-15) should pave the way for a quick test of the critical 200-day SMA at 103.61 prior to the weekly low of 102.96 (August 30).
In the meantime, while above the key 200-day SMA, the outlook for the index is expected to remain constructive.

DXY → Extra losses look likely below 104.00TVC:DXY attempts a mild recovery to the 104.30/40 band after bottoming out just below the 104.00 support earlier in the session on Wednesday.
The breakdown of the November low of 103.98 (November 14-15) should pave the way for a quick test of the critical 200-day SMA at 103.60 prior to the weekly low of 102.96 (August 30).
In the meantime, while above the key 200-day SMA, today at 103.60, the outlook for the index is expected to remain constructive.

#DXY The dollar has reached the reversal zone#DXY
The dollar has reached the reversal zone (Harmonic Enlightenment pattern)
The decline prediction fails with a daily close above 108.14. Otherwise, we wait for the green targets
The "Butterfly" pattern is a technical analysis pattern used in trading, including cryptocurrency trading. It is a specific type of harmonic pattern that traders use to identify potential reversal points in the price of an asset. The Butterfly pattern is characterized by several price points that form specific geometric shapes on a price chart. Here's a brief explanation of the Butterfly Bearish Harmonic Pattern in crypto:
1. **Initial Move:** The pattern begins with a significant price move, which could be either an uptrend or a downtrend, depending on whether it's a bearish or bullish Butterfly pattern.
2. **X-A Leg:** This is the first leg of the pattern and represents the initial move's retracement. It's labeled as "X" and is usually the point where traders first identify the potential pattern.
3. **A-B Leg:** This leg is the next move in the opposite direction of the initial move, labeled as "A." It retraces a portion of the X-A leg.
4. **B-C Leg:** The B-C leg represents a move in the direction of the initial X-A leg and is labeled as "B."
5. **C-D Leg:** The final leg, labeled as "D," is the most critical part of the pattern. It extends beyond the X-A leg and typically ends near a Fibonacci extension level of 1.618 or 2.618 of the X-A leg.
The Bearish Butterfly pattern suggests a potential reversal to the downside. Traders look for this pattern to anticipate that the price may start declining after completing the D leg. It's important to note that not all identified patterns result in price reversals, so traders often use additional technical indicators and risk management strategies to make informed trading decisions.
Remember that cryptocurrency markets are highly volatile, and trading based solely on technical patterns carries risks. It's crucial to conduct thorough research and consider other factors before making trading decisions in the crypto market or any financial market.

After inflation, the US dollar will increase sharply next weekThe US dollar was barely changed in early European trading on Tuesday ahead of the latest inflation data that could determine the direction of US monetary policy, while sterling rose as investors British workers continue to benefit from healthy wage increases.
At 3:10 a.m. ET (08:10 GMT), the dollar index, which tracks the greenback against a basket of six other currencies, was trading virtually unchanged at 105.516.
Trading was largely confined to a narrow range on Tuesday as traders cautiously awaited the release of the US consumer price index at the end of the October session, a number likely to boost sentiment. believe. Book}} meeting.
Analysts expect annual revenue growth to rise 3.3% year-over-year, down from 3.7% in September, while also expecting a 0.1% increase over the month, lower than the 0.4% increase observed last month.
Some Fed officials, including Chairman Jerome Powell, have warned that persistent inflation could cause the central bank's interest rates to rise further and any signs that prices are harder to come by than expected are all likely to sharply increase bets on rising interest rates. US central bank. Higher interest rates - a scenario that bodes well for the dollar.

#Dxy $Dxy #Elliottwave 13Nov23 Short Wave CThis count is based on my assumptions so anything can happen not a trading or financial advice just for educational purposes only kindly do your own ta thanks trade with care good luck.

GOLD ANALYZE 1H Hello dear traders,
In the global gold market, on the 1-hour timeframe, we are witnessing a downward trend where the price, after forming a bottom at 1931.5 and making an upward spike, indicates the possibility of forming a price pivot.
We have two scenarios for the movement of gold:
1. If the trendline is broken, we expect further price growth. However,
2. if the price shows a reaction at the trendline and turns back towards the pivot, we anticipate price support.
It is worth mentioning that if the floor at 1931 is lost, this analysis loses its validity.
Thank you for following me. Wherever you are, stay safe and profitable.

$DXY Idea UpdateHi guys, this time i bring you all a Dollar analysis, where my direction is bearish if the yields really throw it down with the SMT Divergence, I'm bearish because we closed under the Weekly Inverted Fair Value Gap and also we have an OB which is really strong even though it has a lot of liquidity in the upper part, but still, im expecting to see DXY going after the PWL mainly, and then if it really plays out slowly then we could go after those EQLs and the Weekly BISI where we would bounce off back again after the 50% of the Monthly FVG above.
UPDATE: I'm still leaning onto the bear side, this matches with my FX:EURUSD analysis, so i feel like this will play out nicely, the only reason for which i confirmed short on DXY was because we had a CISD after all.

$DXY Analysis ''Are we going after the sellside liquidity?''Hi guys, this time i bring you all a Dollar analysis, where my direction is bearish if the yields really throw it down with the SMT Divergence, I'm bearish because we closed under the Weekly Inverted Fair Value Gap and also we have an OB which is really strong even though it has a lot of liquidity in the upper part, but still, im expecting to see DXY going after the PWL mainly, and then if it really plays out slowly then we could go after those EQLs and the Weekly BISI where we would bounce off back again after the 50% of the Monthly FVG above.

USDJPY Long Term ShortUSDJPY is going to reverse soon IMHO. I do not exclude we could see some stop hunt, reaching 152.500 level. 153/153.500 is a good Stop, target is around 500+ pips, near 146.000

DXY$ Shorts from 105.800 down towards 105.200As expected our last week scenario (A) played out perfectly like we anticipated which was seeing a bullish reaction from the 4hr demand. For this week's bias we are still temporarily bearish with the dollar as it's approaching a clean 14hr supply zone. As soon as it gets tapped in I will be waiting for my lower time frame confirmation i.e. a Wyckoff distribution schematic and a clean CHOCH to the downside.
I would preferably wait for the asian high to get swept inside the zone before looking for a drop in the dollar index. I am bullish long term but, as price has broken structure a few times to the downside I would like to catch sells down towards the next demand at least.
My confluences for DXY$ Shorts are as follows:
- Price approaching a 14hr supply zone that has broken structure the downside.
- Imbalances have fully been filled and momentum has slowed down (good sign for a reversal)
- Huge trend line left way below that price would want to grab and theres also lots of liquidity below to target as take profit levels.
- In order for price to keep pushing up it will need to enter a level of demand, so as of now we will be trying to catch sells down towards a demand.
P.S. Only if my extreme 7hr supply zone gets violated, we will then know if price wants to continue in its bullish trend or not. But as of now I see price dropping more due to the perpetual BOS's. Also, as the dollar is a direct negative correlation to most of my pairs, the bias will suggest a bullish move to take place for EU, GU and gold If DXY$ decides to continue bearish.

EURUSD Bullish Outlook WeeklyThis chart shows the 1hr analysis I have landed at. Last weeks analysis played out rather accurate and ended at the final spot I predicted as we ended bullish for the Euro. I see the geopolitical news being a factor that the dollar is getting beat up the way it is, as well as Gold on its move last week, there wasn't much give for the Dollar.
I have several levels marked up on this chart and this is due to the intraday scope I am looking at for the coming week. I being a bullish character in EUR/USD I have my main levels I want to be ran marked and I will attempt to enter with stops relative to the next level, and if I get stopped, I will probably look for more bullish attempts at the retracement back to the next level (the one that stops me) and see if I cant regain a loss, and catch the start of what hopefully can be a bullish week.
There is still lots of room to cover If i am going to switch bearish on this pair. There could be resting liquidity at many of these levels due to the uptick in the war and many stock positive moves that took place on US30 movers last week. Time will tell, but this is what I am looking at for this week.
Will update on Sunday, the 12th.
Check out the links in my bio for AI tools and indicators. Go check em' out. I built a PineScript LLM that helps you code your own strategies and indicators even if you know nothing about coding and a TradeGPT agent that can supplement probably 98% of internet Guru's as far as valuable information in a timely manner,. Just thought I would offer that knowledge as well!

DXY SELLOverview of my DXY sell idea. I have been following this for a longtime but i've decided to share it. Technically my chart explains itself, but fundamentally the US economy is in a very bad shape, increased government borrowing and on the brink of a debt default, inflation, war, all this is affecting the US which hasn't fully recovered from the coronavirus outbreak.
Fundamental: Recent NFP 150,000 from previous of 336,000.
Increased government borrowing
Thanks for reading my analysis.
Comment below if you think we will see continued downtrend on the Dollar.
Disclaimer: This analysis is only made on speculation and are solely the views of the analyst, there is no guarantee the analysis will play out. Do your own research before taking a trade.

Downfall in DXY has begun?In my previous post on DXY ,i mentioned how i expected it to move up a tiny bit in wave c of Z before starting to tumble. Well, from the fresh piece of evidence available it seems like that the expected tiny bounce failed which in Elliot wave terms means that wave Z has truncated.
That also means that the first leg to the expected downfall towards 93-94$ mark is already in place.
A few other things to add to this view:
i. The closing price yesterday came below the channel support
ii. the horizontal trend support is also broken
iii. by breaking the low of 105.36 the index has technically entered a downtrend according to the classic Dow Jones theory(lower high and lower low formation).
Note*- This post is for educational purpose only
