DXY reached my target (114)DXY reached 114.5 today, and now its retesting before going to touch 115, and it'll drop down to the BLACK box again (108-109) and It'll do accumulation at this zone (108-109) before going bullish towards 120....
Enjoy :)
Dxyshort!!!!!!!!!!!!!

DXY AT IMPORTANT RANGEHello friends, today Jerome Powell indicated that they should increase interest rates further more, they said same thing last month but it didn't give much strength enough to DXY enough, so I expect such a move which I have indicated in the chart... and J Powell speech indicates that there's loads of supply of US dollar in the market, and to make US Dollar strong, they should lower down the dollar note printing... and they have to lower the supply of US Dollar.... this indicates that US dollar supply is high, which means collapse of DXY... and I expect US dollar crash anytime soon, and I predict that it may happen after NFP report on 10 March...
Hope y'all wellness....

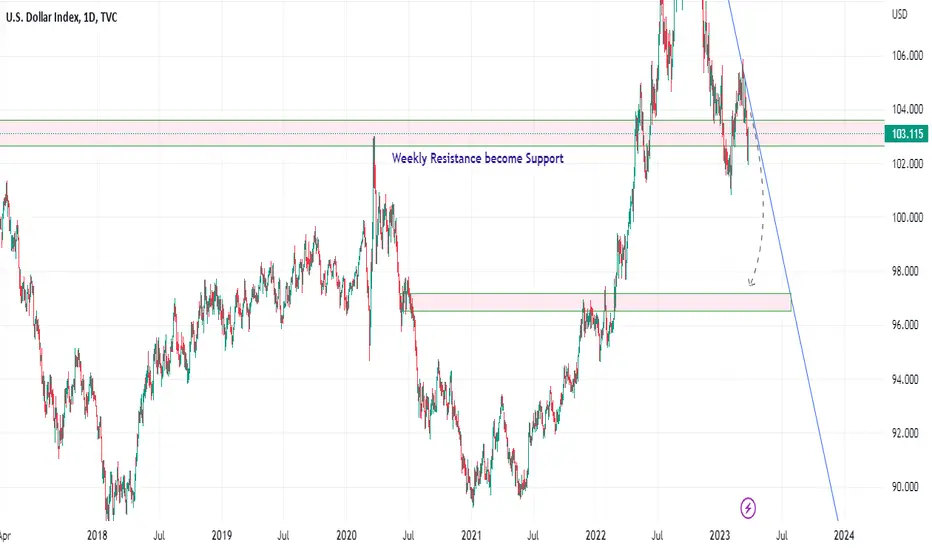
DXY NEW WEEKLY OUTLOOKOn the 4th of April, price made a significant move on dollar, price broke to the downside sharply cause XAUUSD to fly over 500 pips.. since then we have been on a pullback, this does not mean price is now bullish, it is just a retest and i am still selling dollar... next week will be fire the way i am seeing it, watch out for price action.. I will be selling dollar and Buying GOLD, target should be around 2050.. be prepared.. its good friday today, enjoy your Easter, see y'all next week.

DXY : Short Trade , 1hHello traders, we want to check the DXY chart in the 1-hour time frame. The price is moving in a downward channel and after breaking the key level of 101.900, it has pulled back to this level. We expect this level to act as a resistance level for us. Play and maintain the downward trend of the price and drop to the next key level around the price of 100,900. Good luck.

Time comes for USD to dieWe completed wave two of wave c and now we are in wave 3 of c and it will Be hard movements so keep your eyes opining and see what will happens.

DOLLAR OUTLOOK FOR THE NEXT 3 MONTHS I have noticed a bearish rally is approaching on DOLLAR and economic news seem to be the driven force.. i will continue to hold long term.

#DXY- BUY XXXUSD to catch Big Moves!!Dear Traders, following yesterday data on NFP we have now identified that USD pairs will be bullish for longer time as fear of recession has risen again, from negative NFP to increasing tax on Capital gains, everything indicating towards a negative DXY; we also have CPI next week which will be interesting and important for the investors and traders. It will be better to leave USD pairs alone on Monday where we will have a better understanding of the price action.
Please Like and Follow for more

DXY FALL INCOMING! xxxUSD to SPACEDXY us currently BEARISH and we are only look for SHORTS here.
How does this help us trade the market?
RULE - DXY goes DOWN, xxxUSD go UP
CHEATSHEET - Your xxxUSD trades will not move if DXY isn't ready for that big impulse legs
I make sure when I take SUD trades that day is in full support of the direction am taking.
I won't get in on any new xxUSD LONG if DXY hasn't reached the UB (Upper Band ) on the H4.
We already have the EMA CLOUD, so every UB will be a badass impulse trigger (Learn the HOOD SUITE SYSTEM)
I will be on full throttle LONG on xxxUSD (check for NOTIFICATIONS to see which of the USD pairs we will be attacking) when DXY reaches the UB on H4 as the next impulse leg should kick in from there.
INVALIDATION - IF we get a close on the PREV HIGH level then we will chart a course for the next move when that happens.
P.S I will post money making trades like this everyday and everything you see on my chart is
from the HOOD SUITE INDICATORS, everything you need is right in front on you inside the indicator.
(The key zones, Levels for manipulation, visible SL for invalidation, Alert when trade setup is ready).
No trend lines or complicated analysis, all you have to do is FOLLOW!

Is DXY tracing out a H&S top?Looking at a chart of the DXY it appears to be working on forming a head and shoulders top. Pattern is not complete until it breaks through the neckline, but the formation can clearly be seen and is currently working on the right shoulder. Should the pattern complete it targets a measured move to 87.75. I'll leave you to make your own conclusions as to what this means for risk assets.

DXY SELL The beginning of the downward trend to the bottom of thDXY The beginning of the downward trend to the bottom of the channel

DXY WEAKNESS! xxxUSD LONG Rally coming!// THE DIRECTION //
DXY is currently looking weak here. (Reason - PA, EMA Cloud, SUITE B, BL, Below PW.5 and anticipating a retest for the next fall )
The best way to trade xxxUSD is to understand what DXY is doing.
IF DXY falls, xxxUSD rally up and right now we are about to have just that and we expect this to drop all the way down to PML (Previous Monthly Low)
// INVALIDATION //
Invalidation here would be DXY breaking the previous high @ 103.350.
Brace yourselves, the rally will happen.
Keep your eye out for my xxxUSD idea next.
P.S I will post money making trades like this everyday and everything you see on my chart is
from the HOOD SUITE INDICATORS, everything you need is right in front on you inside the indicator.
(The key zones, Levels for manipulation, visible SL for invalidation, Alert when trade setup is ready).
No trend lines or complicated analysis, all you have to do is FOLLOW!

DXY one last leg down then continuation for new highsHi there,
DXY is setting up for one last drop to finish 4 wave before it resumes the uptrend, We have a rising wedge on 4h, after breakdown dxy will melt
Good luck with your trades

DXY ShortDollar index is all set for shorting having a very long weekend of being down dollar index is one more time going to short
DXY road to 92, SHORT THE USDThe PetroYUAN is competing with the petroDOLLAR now and is causing concerns amongst the US economy. As BRICS gather forces and continues growing as oil rich countries are also joining forces with BRICS to fight against the petroDOLLAR.
Other economic factors why the DYX is looking weak are:
-Inflation: High inflation can erode the value of a currency, as it reduces the purchasing power of consumers and investors. If the US experiences sustained high inflation, it could weaken the US dollar even if interest rates are high.
-Economic growth: If the US economy is not growing as quickly as other economies, it could lead to a relative decline in the value of the US dollar. This could be exacerbated if other economies are experiencing strong growth and higher interest rates.
-Geopolitical risks: Political instability, trade tensions, and military conflicts can all increase risk and uncertainty, which can lead investors to sell US dollars and seek safer assets. If the US is perceived as a less stable or secure country, it could weaken the US dollar.
-Debt levels: High levels of debt can make a country more vulnerable to economic shocks and reduce its ability to stimulate the economy during downturns. If the US experiences a sharp increase in debt levels, it could weaken the US dollar.
-Market sentiment: Investor sentiment can be influenced by a wide range of factors, including news events, social media, and market psychology. If investors become pessimistic about the US economy or the prospects for the US dollar, it could lead to a decline in demand for US dollars and a weaker currency.

Intraday Sell DXY (22 MAR 2023)DXY intraday trading alert
3 simple steps to find a quality setup!
Risk Reward Ratio 1:2
Anyone same idea with me?
SELL DXY
Good luck traders...

DXY Chart Analysis....
AronnoFX will not accept any liability for loss or damage as a result of
reliance on the information contained within this channel including
data, quotes, charts and buy/sell signals.
If you like this idea, do not forget to support with a like and follow.
Traders, if you like this idea or have your own opinion about it,
write in the comments. I will be glad.

Dxyso far dxy looks very bearish, next stop can be 100 ema. from where i expect the bounce. as another bearish signal we can see Rsi crossing.

DXY US. Dollar Index | Down Trend Lower Lows and Lower Highs are technical patterns that are commonly used in chart analysis to identify potential downtrends in the DXY US Dollar Index.
A Lower Low occurs when the price of the index reaches a new low during a given period that is lower than the previous low. This suggests that the price is continuing to trend downward.
A Lower High occurs when the price of the index reaches a new high during a given period that is lower than the previous. This suggests that the price is struggling to get higher levels and may be trending downwards.
These patterns can be used by traders and investors to identify potential selling opportunities or confirm existing US dollar downtrends. However, they should be used in conjunction with other forms of analysis and not relied on exclusively.
Fibonacci retracement is a popular technical analysis tool used to identify potential levels of support and resistance in financial markets. The tool is based on the Fibonacci sequence and retracement levels are calculated using ratios derived from this sequence.
When applied to the DXY US Dollar Index, Fibonacci retracement levels can help identify potential areas of support and resistance. For example, a common retracement level is 50%, which represents a potential area of support or resistance at the halfway point between a market's high and low.
If the DXY Index is in a downtrend, a trader might look for potential buying opportunities near a Fibonacci retracement level, such as the 38.2% or 50% level, which could represent potential areas of support.
Conversely, if the DXY Index is in an uptrend, a trader might look for potential selling opportunities near a Fibonacci retracement level, such as the 38.2% or 50% level, which could represent potential areas of resistance.
It's worth noting that Fibonacci retracement levels should not be relied upon exclusively for making investment decisions, and should be used in conjunction with other forms of analysis and risk management techniques.
Follow me for more Ideas.

EURUSD LONG DaytradeOn the 15 minute chart with trendlines drawn, a bullish megaphone pattern is seen.
This is a suitable basis to take a long trade with price is near to the ascending support trendline
with a stop loss just outside ( below) that line The trade is supported by the current downtrend
of the USD (^DXY) as seen in the link below.
The megaphone is demostrative of increasing volatility which the experience trader can
turn into profits.
As this is on a 15-minute time frame this entry is only suitable to a daytrader
who is scalping or at least closing the trade within the same session.


$dxy #dxy #elliottwave short trade setup.This count is based on my assumptions so anything can happen not a trading or financial advice just for educational purposes only kindly do your own ta thanks trade with care good luck.

DXY MARKET OUTLOOK - BEARISH TREND?DXY MARKET OUTLOOK - BEARISH TREND?
DXY has broke the bullish trendline in the Daily Chart. Here's the potential movement for DXY.

DXYPullback, we'll see what the market does upon it's opening.
DXY bias looks like it wants to continue to the downslide.
Now that the dust has settle from NFP i'm looking for a push to the downside in the coming week.
Everyone have a safe and enjoyable Sunday.
Disclaimer: This is not trade advice. Trading foreign currencies, stocks, indices, etc can be a challenging and potentially profitable opportunity for investors. However, before deciding to participate in the financial markets, you should carefully consider your investment objectives, level of experience, and risk appetite. Most importantly, do not invest money you cannot afford to lose!!!
Good luck and Happy trading!
